21-8-2017
Predicting mortgage demand using
machine learning techniques
Kevin Bonnes
I
MASTER THESIS
August 2017
Master Business Information Technology, University of Twente
Faculty of Electrical Engineering, Mathematics and Computer Science (EEMCS) Faculty of Behavioural, Management and Social sciences (BMS)
Parts of this thesis have been redacted due to confidentiality
AUTHOR
Kevin Bonnes
Master Business Information Technology
GRADUATION COMMITTEE
Dr. Ir. Maurice van Keulen
Faculty EEMCS, University of Twente
Dr. Chintan Amrit
Faculty BMS, University of Twente
Dennis Spangenberg
Topicus
Stefan Hessels
II
PREFACE
This thesis marks the end of my study period at the University of Twente. After completing my Bachelor Business & IT in 2014, this thesis is written as a final assignment for my Master Business Information Technology. It is a perfect example of combining both the Business and IT fields. By specializing in Business Analytics, I learned a lot about data science and its related topics. This thesis contains a practical example of applying this knowledge in a business context.
I would like to thank my supervisors at the University of Twente, Maurice van Keulen and Chintan Amrit, for their support, guidance and feedback during the project. Especially the feedback on my thesis provided me with useful directions on how to improve the quality of the thesis, and maintain a clear structure.
I would also like to thank Topicus, for providing me the opportunity and resources to work on my thesis. Thanks to my supervisors at Topicus, Dennis Spangenberg and Stefan Hessels, for their support and guidance during the project. In particular the standups every other day, and the retrospectives every two weeks, helped a lot during the project. Furthermore, thanks to Lennart Boot and Michel Brinkhuis for their feedback and help during the project.
III
ABSTRACT
IV
MANAGEMENT SUMMARY
Context
At Topicus, a software product called FORCE is developed, which is used at multiple financial institutions to manage the mortgage application process. A mortgage application coming in at the financial institution has to pass a large number of actions and checks before it can be turned into an offer. A large part of this mortgage application process is performed automatically by the system, but some of the actions have to be performed manually by employees of the financial institution, depending on the type of mortgage application and the quality of the data.
Research Problem
In order to process the mortgage applications within the designated time standards, it is important for the financial institutions to have enough mortgage acceptors available to handle the continuous inflow of mortgage applications. The amount of mortgage applications coming in at a certain moment fluctuates significantly, and is influenced by multiple factors. Hence, it is difficult for the financial institutions to determine the optimal amount of personnel needed at any day, to balance the tradeoff between throughput time of the mortgage applications and personnel costs. In this research, a predictive model is developed using machine learning techniques that provides a prediction of the amount of mortgage applications per day coming in for the next week, in order to provide assistance with the personnel planning. Furthermore, an overview is given of the most important factors that influence the amount of mortgage applications, and recommendations are given on how to use the model at the financial institutions for personnel planning. The research question of our research is as follows:
How can domain data be used to predict the amount of mortgage applications per day for the next week?
Methodology
In order to develop a machine learning model that can predict the amount of mortgage applications per day, for the next week, the CRISP-DM process model is used to structure the project. CRISP-DM is a process model that is used to ensure the quality of data mining projects. It describes the most common steps used in a data mining project and helps structuring the project. A literature study and multiple interviews were conducted in order to get an understanding of the context of the research problem, and to develop a list of possible predictors. Historical event log data and publicly available data were used as input for our predictive model, and five machine learning techniques (Decision Tree, Random Forest, Gradient Boosting Machines, Support Vector Regression and Neural Networks) were applied to create the predictions. The models are validated using repeated cross-validation, and evaluated using several evaluation criteria.
Results
V Forest model is around --- NUMBER REDACTED --- of the actual amount of mortgage applications per day.
Model RMSE MAE MAE/Mean R2
Random Forests (RF) --- RESULTS REDACTED DUE TO
CONFIDENTIALITY --- Gradient Boosting Machines (GBM)
Support Vector Regression (SVR) Neural Networks (NN)
Classification and Regression Tree (CART)
The most important features of our model are as follows:
The financial institution’s interest rate
Changes in the financial institution’s interest rates
The amount of mortgage applications on the previous day
Holidays
The day of the year
By analyzing the results of our model, we can see that in particular the ‘outliers’ (i.e. the days with an extremely high amount of mortgage applications) are consistently under-predicted. These outliers are often influenced by changes in mortgage interest rates, which implies that there is still room for improvement in our model. As the changes in interest rate are one of the most important features of our model and are influenced by many factors, and hence hard to predict, a dynamic dashboard is proposed. In this dashboard, interest rate changes can be entered manually, so that their impact on the amount of mortgage applications is shown real-time.
Conclusions
A predictive model was created using the Random Forest technique, which predicts the amount of mortgage applications per day with a mean absolute error of --- NUMBER REDACTED --- mortgage applications per day. This can directly be converted to the amount of personnel needed at the mortgage application department of the financial institutions, by dividing it by the amount of mortgage applications handled per person per day.
VI
LIST OF FIGURES
Figure 1 – Competitive position of financial institutions in the mortgage market ... 2
Figure 2 – CRISP-DM Process Model ... 6
Figure 3 – Research Method using the CRISP-DM framework ... 7
Figure 4 – Mortgage interest rates are currently at its lowest point ... 13
Figure 5 – Long-term fixed interest rate periods are receiving increased popularity ... 14
Figure 6 – Anscombe’s quartet. ... 19
Figure 7 – Daily amount of mortgage applications over time ... 21
Figure 8 – Density plot of the amount of mortgage applications per day ... 21
Figure 9 – Total amount of mortgage applications per month ... 21
Figure 10 – Random Forest: Actual vs. Predicted ... 31
Figure 11 – Random Forest: Residual plot ... 31
Figure 12 – Predictions of the amount of mortgage applications per day: June & July ... 31
VII
LIST OF TABLES
Table 1 – List of possible predictors ... 12 Table 2 – Example overview of the database table ... 20 Table 3 – Overview of features used in our models ... 23 Table 4 – Overview of features selected for final model (included variables are denoted by ‘X’,
VIII
GLOSSARY
API Application Programming Interface
ARM Adjustable Rate Mortgage
BKR Bureau Krediet Registratie
BVAR Bayesian Vector Autoregressive model CART Classification and Regression Trees
CBS Centraal Bureau Statistiek
CCC Correctheid en Compleetheid Controle
CRISP-DM Cross Industry Standard Process for Data Mining
CRM Customer Relationship Management
DNB De Nederlandsche Bank
ECB European Central Bank
Euribor Euro Interbank Offered Rate
FinTech Financial Technology
FRM Fixed Rate Mortgage
GBM Gradient Boosting Machines
IDE Integrated Development Environment
LTV Loan-To-Value
MAE Mean Absolute Error
MAE/Mean Mean Absolute Error divided by the mean
MLR Multiple Linear Regression
NHG Nationale Hypotheek Garantie
NN Neural Networks
OSINT Open Source Intelligence
RF Random Forest
RFE Recursive Feature Elimination
RMSE Root Mean Square Error
SaaS Software-as-a-Service
STP Straight-Through Processing
IX
TABLE OF CONTENTS
1 Introduction ... 1
1.1 Topicus ... 1
1.2 Dutch mortgage market ... 1
1.3 Mortgage application process ... 2
2 Research Problem ... 4
2.1 Motivation ... 4
2.2 Research Questions ... 5
3 Research Methodology ... 6
3.1 CRISP-DM ... 6
3.1.1 Business Understanding ... 7
3.1.2 Data Understanding ... 7
3.1.3 Data Preparation ... 8
3.1.4 Modeling ... 8
3.1.5 Evaluation ... 8
3.1.6 Deployment ... 8
3.2 Tool selection ... 8
3.3 Structure of this report ... 8
4 Business Understanding... 10
4.1 Domain analysis ... 10
4.1.1 Related work ... 10
4.1.2 Interviews ... 11
4.2 Predictors of the amount of mortgage applications ... 12
4.2.1 Overview of predictors ... 12
4.2.2 Mortgage interest rates ... 12
4.2.3 Changes in regulations ... 15
4.2.4 Other predictors ... 16
4.3 Predictive analytics ... 18
5 Data Understanding ... 20
5.1 Data collection ... 20
5.2 Data exploration ... 21
6 Data Preparation ... 22
6.1 Data pre-processing ... 22
6.2 Feature engineering ... 22
X
7 Modeling ... 27
7.1 Selection of modeling techniques ... 27
7.2 Model building ... 27
7.3 Model validation ... 27
8 Evaluation ... 29
8.1 Model evaluation ... 29
8.2 Discussion of results ... 30
9 Deployment ... 34
9.1 Visualization ... 34
9.2 Recommendations for deployment ... 35
10 Conclusions, Limitations and Further Research ... 37
10.1 Conclusions ... 37
10.2 Limitations ... 38
10.3 Recommendations for further research ... 39
Bibliography ... 40
1
1
INTRODUCTION
In this chapter, the research domain is introduced. An introduction on Topicus is given as well as the software product called FORCE, which can be used to manage the mortgage application process for financial institutions. A brief introduction is given on the Dutch mortgage market, and the position of the
financial institutions in the Dutch mortgage market, and finally an introduction is given on the mortgage application process in FORCE.
1.1
TOPICUS
Topicus is an IT service provider that offers software solutions for different industries. The company is located in Deventer, but has multiple offices throughout The Netherlands. Topicus was founded in 2001 by five employees, but has currently grown to over 650 employees and is still growing.
The company specializes in chain integration and Software-as-a-Service (SaaS) solutions. Chain integration is the concept of integrating different systems within a chain in a business process and facilitating information exchange between them. This is often done using Application Programming Interfaces (APIs). An API is a set of standards that define how one can communicate with a specific software system.
Topicus offers software solutions in different sectors: finance, healthcare, education, government and legal. Each of these sectors consists of different business units, and each business unit consists of one or multiple teams. At Topicus.Finance a software product called FORCE is developed, which can be used to manage mortgage requests and quotations. Multiple financial institutions use FORCE. Each of these financial institutions has their own implementation of the software product, with customized functionality, and sometimes their own teams within Topicus that are dedicated to their implementation of the product. The implementations of FORCE used by these financial institutions are different from the standard FORCE product because they need to provide integration with a number of external systems used at these financial institutions.
In FORCE, the financial institution’s employees can process and manage mortgage applications. A mortgage is a loan given by a financial institution to a house owner, in which the borrower’s property functions as a security for the loan. Since most individuals do not have the funds to buy a house straight away, they can apply for a mortgage so that the mortgage lender helps them providing funding. The mortgage borrower then pays a monthly payment to the lender, until the debt is paid off. The lender also expects an interest rate to be paid as a compensation. There are different types of mortgages. The two basic mortgage types are the fixed rate mortgage (FRM) and the adjustable rate mortgage (ARM). The difference between these types is the interest rate, which either remains fixed for a certain period of time or is adjustable depending on interest market index. Next to this there are differences in the payment schemes, the two main types are linear mortgages and annuity mortgages. The difference between these types is the repayment scheme. In an annuity mortgage, the monthly payment increases gradually, whereas it remains constant in a linear mortgage.
1.2
DUTCH MORTGAGE MARKET
2 gained a lot of popularity lately, and has attracted interest from both industry participants and consumers. It aims to provide automated financial services that reduce the throughput time of transactions and transaction costs (Dapp, Slomka, AG, & Hoffmann, 2014).
In the Dutch mortgage market there are numerous different mortgage lenders, which can roughly be categorized in three different categories: banks, insurance companies and other financial institutions. The banks are generally the most influential type of mortgage lenders, and have a combined market share of about 60% (van Dalen, 2016). Insurance companies and other financial institutions both have a market share of about 20% of the total mortgage market in The Netherlands.
Recently, the competitive position of the banks in the Dutch mortgage market has received some pressure. Due to the entry of new players in the Dutch mortgage market, that can offer mortgages at a lower interest rate, the market share of the big banks has decreased by about 20% over the last four years (van Dalen, 2016). This can be seen in Figure 1. These new entrants have lower costs than the traditional players, and can thus provide ‘cheaper’ mortgages in terms of interest rates, which can often save the consumers a significant amount of money. Due to this, they have taken a considerable amount of market share and are slowly pressuring the competitive position of the big banks, which are having difficulties to remain competitive in terms of interest rates. This has led to an increased interest in FinTech from the banks, hoping that it allows them to regain market share by increasing their competitiveness in terms of interest rates and reduced costs.
1.3
MORTGAGE APPLICATION PROCESS
[image:13.595.73.495.370.635.2]FORCE is a software product developed by Topicus, used to handle the mortgage application process. With FORCE, a large part of the mortgage application process can be automated. It is a mid- and backoffice product, which offers functionality for processing and managing mortgage applications. The financial institutions that work with FORCE can have their own frontend systems, in which a mortgage advisor or a user can apply for a mortgage. Once the application is completed, the frontoffice systems
3 can send it to FORCE. When a mortgage application enters the system in FORCE, several main steps will be conducted. First, the information in the application is extracted and connected to the CRM-system of the financial institution. Afterwards, a Correctheid en Compleetheid Controle (CCC) is performed, to ensure the completeness and correctness of the information. Afterwards, multiple other steps are conducted, such as reviewing the information and documents in the mortgage application and conducting a credit check at Bureau Krediet Registratie (BKR), in order to see if the applicant is creditworthy. Finally, the application is either accepted, rejected, or sent to another department for further checks. If the application is accepted, a quotation will be made by one of the employees. This entire process of handling a mortgage application is too complex to be shown in detail, as there are dozens of other steps and statuses that a mortgage application will undertake, up until the quotation process.
In the best possible case, when all of the checks are positive and the mortgage application gets accepted, the process up until the quotation is completely automated. This is called Straight-Through Processing (STP). For all other requests, manual input will be required from the financial institution’s employees. All of these steps that are performed by the system or by any of the employees are logged in a database. This log data contains multiple variables, amongst others the id of a mortgage application, the status of the mortgage application, the time and date of the status change and the employee that performed the action. This date and timestamp can be extracted from the database and can be used to train a predictive model.
4
2
RESEARCH PROBLEM
This chapter covers the research problem of our research, and describes how this research will provide value to Topicus and its customers. First, the motivation of the research is discussed, which provides the reasoning behind our research problem. Second, the research question and its subquestions are proposed.
2.1
MOTIVATION
The mortgage application process consists of multiple actions and subprocesses, of which a large part is performed automatically, without human interference. However, some of the actions have to be performed manually by employees of the financial institutions. This entirely depends on the type of application. Each application has different characteristics so the processing time is never the same. For example, applications submitted by entrepreneurs require manual processing and thus have a longer processing time, due to the fact that they have to add extra documents in their application (Geertsma, 2016).
Due to the variability in the amount of mortgage applications and the different natures of them, it is difficult for the financial institutions to determine how much personnel is needed at any given time to process these applications. Currently they have to keep on scaling up and down in terms of personnel real-time manually, in order to keep the processing time of these applications within the designated time standards, which is not cost-efficient. Providing insight into the amount of personnel needed at any given time can significantly decrease the personnel overhead by preventing personnel over-allocation, and it lowers the average throughput time of mortgage applications and helps preventing outliers in the throughput times.
The entire process of getting insight into the amount of personnel needed at any given time is a too complex research problem to be handled at once, but it can be split up in multiple smaller research problems, that can each be handled within a master thesis. For example, by providing a more accurate prediction of the amount of mortgage applications and their expected processing time, the amount of personnel needed at any given time could be more accurately predicted. In this research we will focus on one of these research problems: predicting the amount of mortgage applications coming in at any specific time within FORCE, in order to get more insight in the amount of personnel needed at the dedicated departments of the financial institutions. This will be done by creating a predictive model. Not all of the mortgage applications will lead to an actual mortgage, but the amount of mortgage applications generally does give a decent indication of the expected activity on the mortgage market (Boumeester, 2016). This study will contribute to this by conducting a subpart of this research problem, and providing recommendations for future research, for example for a subsequent master thesis. In terms of business value, Topicus is currently working on a management information dashboard for its customers, in which they can incorporate this information in order to improve the value of the dashboard. Next to this, Topicus may want to use this information for future purposes, for example in one of their start-ups called Jungo. Jungo is a mortgage lender that makes use of ‘crowdlending’, it allows third-party lenders to crowdfund a part of the mortgage, in order to lower the interest rates (“Jungo,” 2016).
5 in decision making, and provide a better estimation. Predictions will be made for a timeframe of one week.
2.2
RESEARCH QUESTIONS
Based on the problem mentioned above, the following research question was defined.
RQ. How can domain data be used to predict the amount of mortgage applications per day for the next week?
In order to answer this research question, the following subquestions were defined.
SQ1. What are the variables in the domain data that influence the amount of mortgage applications?
SQ2. Which techniques and algorithms can be used to create a model that is able to predict the amount of mortgage applications?
SQ3. Which technique performs best on our dataset?
6
3
RESEARCH METHODOLOGY
In this chapter the research methodology is discussed. An overview is given of the CRISP-DM model, and each of its stages is discussed briefly and applied on our research project. Finally, an explanation is given of the tool selection and the remaining structure of this report is discussed.
3.1
CRISP-DM
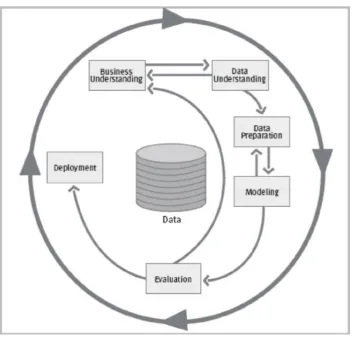
In order to complete the project and develop a valid predictive model several steps will need to be conducted. To model these steps, the CRISP-DM process model will be used (Chapman et al., 2000). An overview of the CRISP-DM model can be found in Figure 2 (Alnoukari & El Sheikh, 2012).
The CRISP-DM model is a process model to ensure the quality of knowledge discovery project results (Chapman et al., 1999). It describes the common steps used in a data mining process and helps structuring the project (Wirth & Hipp, 2000). It is considered as the leading methodology for data mining and knowledge discovery projects (Kurgan & Musilek, 2006; Marbán, Mariscal, & Segovia, 2009; Piatetsky, 2014).
[image:17.595.72.426.239.579.2]The CRISP-DM model consists out of six stages: Business Understanding, Data Understanding, Data Preparation, Modeling, Evaluation and Deployment. The sequence of these stages is not strict, the arrows only indicate the most important flows, but in any particular project the sequence of these steps
7 may vary (Wirth & Hipp, 2000). In general, this is an iterative process in which new features are continuously created and evaluated.
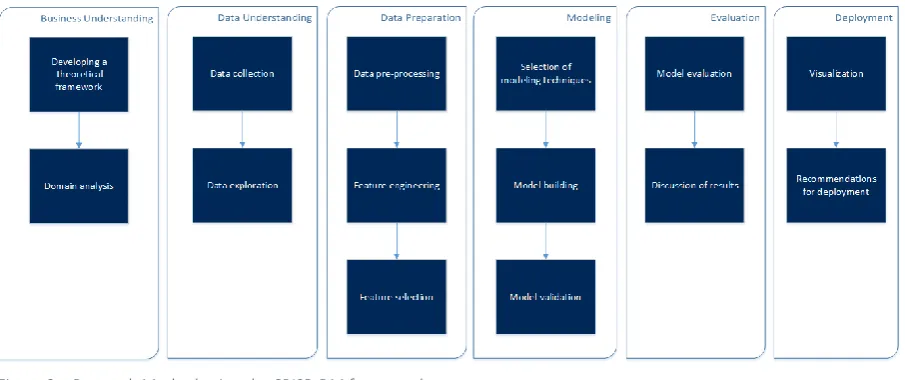
In our research, the CRISP-DM model will be used as a framework for our predictive model. Each of these six stages contain a number of activities, but not all of these are applicable to our research project. In order to customize the framework to our research project, we have mapped the different stages of the CRISP-DM framework onto the activities required in our research project. An overview of this can be found in Figure 3. Below, the six stages as well as the activities in these stages are explained in more detail and are applied to our project.
3.1.1 Business Understanding
In the first stage, a theoretical framework is developed and background information is collected on the domain. This is done in order to get an overview of the objectives and requirements of the final solution from a business perspective. A theoretical framework is developed by conducting a literature review. The theoretical framework contains an overview of the related research in this research area, and an overview of the concepts in predictive analytics and the different models that are feasible for our research project. The theoretical framework covers the most important terms and theories from the different topics that are involved in our research.
For the domain analysis, background information on the mortgage application process and the mortgage domain is collected in order to get a better understanding of the different topics. Also a list of possible predictors is developed by using literature and conducting interviews. An initial list of predictors is formulated using literature, and interviews with several domain experts within Topicus are used to validate that list.
3.1.2 Data Understanding
[image:18.595.73.526.208.398.2]In the Data Understanding stage the raw data is collected from the database using an SQL query and its characteristics and distributions are explored. Event logs are kept in the database and can be used for predictive modeling. Once the data is collected, the data is explored and visualizations are made of the different variables to get an understanding of the data. With these visualizations we can already see some of the relationships in the data and identify possible features. The data exploration activity is important for becoming familiar with the data and identifying data quality problems (Chapman et al., 2000).
8 3.1.3 Data Preparation
The goal of the Data Preparation stage is to transform and enrich the dataset so that it can be fed into the models. After the data is collected and explored, it can be pre-processed so that it can be used directly in our predictive model. With the pre-processed data one can perform feature engineering. Using historical data and external data, different features can be generated. For some of these features the data has to be collected first, from publicly available sources (e.g. Centraal Bureau voor de Statistiek). After the feature engineering activity, a subset of features will be selected that provide predictive value for our models.
3.1.4 Modeling
In this stage, several models are developed based on the dataset. First, a selection of predictive models is made (e.g. Neural Networks, Random Forests). These models are trained on the dataset and used to make predictions. The models are validated using a test set and repeated 10-fold cross-validation (Friedman, Hastie, & Tibshirani, 2001). For each of the models, hyperparameters are optimized and data pre-processing is done if needed (e.g. centering, scaling, multi-collinearity checks). Some of the models have specific requirements on the form of the data, which require specific pre-processing activities (Chapman et al., 2000).
3.1.5 Evaluation
In the Evaluation stage, the results of the different models in the previous stage are discussed and evaluated, and a final model is selected. Model evaluation will be done using several criteria, amongst others the performance of the model and the model interpretability. For ensuring the validity of our research, cross-validation is used. The selection of a final model is done by a t-test.
3.1.6 Deployment
In the last stage, our model is fed with real-time data and predictions are made for the upcoming period. These predictions are visualized in a dashboard. Furthermore recommendations for deployment are written to give the financial institutions some guidance on the deployment of our model, and to use it within their decision making processes.
3.2
TOOL SELECTION
There are a number of tools available for performing predictive analytics, both open source tools and commercial tools. Some of the most popular open source tools are RStudio, Weka, RapidMiner and KNIME. According to multiple studies, the differences between these tools are minor, and the tool selection is mostly based on personal preferences (Al-Odan & Al-Daraiseh, 2015; Meka & Patil, 2015). Because of its ease of use and abilities to visualize the data, RStudio will be used for our project (“RStudio,” 2016). RStudio is an integrated development environment (IDE) for R, a programming language for data analysis and statistics (“R: The R Project for Statistical Computing,” 2016). It contains a wide range of predictive models in different libraries.
3.3
STRUCTURE OF THIS REPORT
10
4
BUSINESS UNDERSTANDING
In this chapter a domain analysis is conducted using interviews and a literature study, and an overview of predictors is presented. Also an introduction is given on predictive analytics. In the domain analysis, interviews and a literature study are conducted in order to get an overview of related research and provide a list of possible predictors. Also the dynamics involved with the mortgage interest rates and mortgage interest rate changes at the financial institutions are discussed, as well as changes in rules and regulations. In the last subchapter, several types of problems in predictive analytics are discussed and an overview of appropriate models is presented.
4.1
DOMAIN ANALYSIS
An important aspect of a data analysis project is obtaining domain information, by conducting a domain analysis. A domain analysis can be used to get an understanding of the different factors that influence the amount of mortgage applications and to formulate a list of possible predictors that can be used for our model. There are multiple studies that confirm the importance of conducting a domain analysis (Kopanas, Avouris, & Daskalaki, 2002; Wu, Zhu, Wu, & Ding, 2014). In our research project, the domain analysis will consist out of a literature study and several expert interviews. A part of the domain analysis has already been discussed in Chapter 1, the remaining information will be presented in the following subchapters.
4.1.1 Related work
Most of the research done in the mortgage prediction domain is kept internally at the financial institutions, due to the classified nature of the data and the importance of the results. Financial institutions that provide their data for data analysis generally use the results of this analysis for own use. Their goal is to improve their internal processes and to provide competitive advantage to their company, and generally do not want their competitors to have access to the analysis. This conflicts with the goal of scientific research, to provide publicly accessible information that can be used for further research. This is one of the reasons that there is a lack of scientific research publicly available. However, albeit the scarcity of literature on predicting mortgage applications, there are a number of papers that provide similar research in related domains, for example the prediction of home sales.
In a study performed on the Swiss mortgage market, the authors show the relationship between house prices and mortgage demand (Basten & Koch, 2015). The authors investigate the different causal relationships between house prices and mortgage demand, and use regression analysis to calculate the correlations between these two variables. They found that house prices do not only influence mortgage demand, but that mortgage demand in return also influences the house prices. Both correlations are positive, the variables affect each other in a positive way.
A study performed by Dua & Smyth (1995) uses a Bayesian Vector Autoregressive model (BVAR) to predict home sales, using variables such as housing prices, mortgage interest rates, unemployment rates and real disposable income as input for the model. Another study by Dua, Miller & Smyth (1999) reaches similar conclusions. They forecast US home sales based on a combination of different variables. They found that variables with a longer lead seem to perform better in their model than variables with a shorter lead.
11 In a study conducted by Gupta, Tipoy & Das (2010), the authors have used several univariate and multivariate models to predict home sales in the US, using amongst others variables such as home prices, mortgage interest rates and unemployment rates. The results have shown that Bayesian models seem to outperform the other models used in this study.
There are also a number of papers predicting the probability of default of a mortgage loan. The probability of default denotes the chance that a mortgage borrower is unable to make its payments. Galindo & Tamayo (2000) have used a number of machine learning models to predict the probability of default. The results show that the Classification and Regression Trees (CART) algorithm performed the best, with an average error rate of 8.31%. In another paper, Feldman & Gross (2005) also use CART to predict the probability of default. Their results show that the borrowers’ features, rather than the mortgage contract features, are the best predictors of the probability of default.
The dynamics around mortgage interest rates are also interesting for our research. There are a number of papers that explain parts of these dynamics for the Dutch mortgage market (De Haan & Sterken, 2011; Toolsema & Jacobs, 2007). Amongst others, these papers show that the mortgage interest rates seem to respond asymmetrically to cost changes in the Dutch mortgage market, rising faster than falling. In general, there can be many reasons that influence the mortgage interest rates, amongst others the degree of competition, the costs of lending, the risks financial institutions are facing and regulatory measures on the financial institutions (Mulder & Lengton, 2011).
4.1.2 Interviews
In order to get an overview of the different aspects involved in the mortgage application domain, multiple interviews were conducted with domain experts within Topicus. Since not all of the domain knowledge is available via scientific literature, and a part of the domain knowledge is client-specific and may contain sensitive data that can provide a competitive advantage in the mortgage market, we use interviews to fill this gap.
In general, three types of interviews can be categorized: unstructured interviews, structured interviews and semi-structured interviews (DiCicco‐Bloom & Crabtree, 2006). The main difference between these categories is the degree to which questions are formulated upfront and whether one can divert from these questions or not. In our research project we use unstructured interviews. Unstructured interviews provide the benefit that the interviewer does not need to restrict the questions that can be asked (Doody & Noonan, 2013). Unstructured interviews are particularly useful when little is known about a certain topic, or for collecting background data (Ryan, Coughlan, & Cronin, 2009). It offers the benefit of asking in-depth questions on a certain topic.
For our interviews, even though we did not use a predefined set of questions, a list of topics was formulated to form the ‘skeleton’ of the conversation. Publicly available information was used to develop an initial list of predictors, and the interviews were used to validate and extend this list. Furthermore, the interviews were used to provide insight in the different aspects involved in the mortgage domain, and the context of our research.
12
4.2
PREDICTORS OF THE AMOUNT OF MORTGAGE APPLICATIONS
“Garbage in, garbage out” is a widely used term in the field of computer science (“Garbage in, garbage out,” 2005; Hand, 1999). The term refers to the fact that software systems will only provide sensible output if they are provided with the right input. Even the most intelligent software systems will produce incorrect output as long as the input data is nonsensical. Basically, the performance of our model is mostly determined by the quality of our input data. If the different predictors we choose to include in our model do not have enough predictive power, the model will never be able to provide any accurate predictions. In order to prevent this risk we will combine our domain knowledge with the domain knowledge of several experts within Topicus in order to create a list of possible predictors.
4.2.1 Overview of predictors
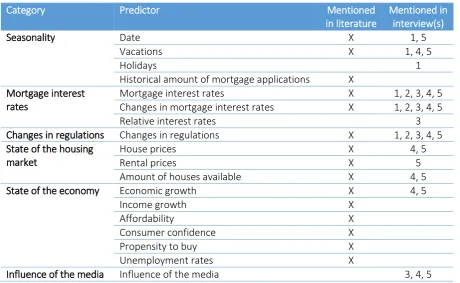
[image:23.595.70.531.285.568.2]An overview of the predictors can be found in Table 1. In the next subchapters, the predictors will be discussed in more detail.
Table 1 – List of possible predictors
Category Predictor Mentioned
in literature
Mentioned in interview(s)
Seasonality Date X 1, 5
Vacations X 1, 4, 5
Holidays 1
Historical amount of mortgage applications X Mortgage interest
rates
Mortgage interest rates X 1, 2, 3, 4, 5
Changes in mortgage interest rates X 1, 2, 3, 4, 5
Relative interest rates 3
Changes in regulations Changes in regulations X 1, 2, 3, 4, 5
State of the housing market
House prices X 4, 5
Rental prices X 5
Amount of houses available X 4, 5
State of the economy Economic growth X 4, 5
Income growth X
Affordability X
Consumer confidence X
Propensity to buy X
Unemployment rates X
Influence of the media Influence of the media 3, 4, 5
4.2.2 Mortgage interest rates
13 As mentioned in Chapter 1.2, there is a stiff competition between banks, insurance companies and other competitors in the mortgage market in The Netherlands. The main difference between the mortgages offered by these types of companies lies in the mortgage interest rates. Even a small difference in mortgage interest rates can often save or cost the borrower a vast amount of money, due to the large sum of a mortgage. In Figure 4, an overview can be found of the historical interest rates over the last 15 years (Vrieselaar et al., 2017). From the figure, it can be seen that the mortgage interest rates are at its lowest point since 2003.
In general, there are two types of mortgage interest rate: variable rates and fixed rates. Variable interest rates are generally lower than fixed interest rates, but can change every month. Fixed interest rates are slightly higher, but are fixed for a certain period of time. When this period of time increases, the mortgage interest rates also go up. E.g., the mortgage interest rate for a fixed period of 30 years is higher than the mortgage interest rate for a fixed period of 5 years. A fixed interest rate is generally preferred when the mortgage interest rates are expected to rise, or when the borrower wants to know its monthly expenses upfront. A variable interest rate is preferred when interest rates are expected to decrease. As can be seen in Figure 5, the long-term fixed interest period have received increased popularity the last two years, due to the low mortgage interest rates (Vrieselaar et al., 2017). Next to the type of interest rates, there are multiple other factors that affect the interest rates, such as the default risk of the borrower (i.e. with a higher default risk, the lender requires a higher interest rate) and interest rate discounts.
[image:24.595.77.519.187.477.2]Furthermore, interest rates are also influenced by the cost of lending for the financial institutions itself. By far the biggest part of a mortgage is funded by debt, which the financial institutions lend from the ECB or from other financial institutions. The mortgage interest rate depends heavily on the cost of which the financial institution can get its funding, and the fixed interest period of the lending. For the short-term interest rates (i.e. the interest rates with a fixed interest period of up to one year), the Euribor can be used as an indicator for the mortgage interest rate. For the long-term interest rates (i.e. interest
14 rates with a fixed interest period of 5 to 30 years), the capital market interest rates can be used as an indicator.
As mentioned in the interviews, for the financial institutions, the relative height of its mortgage interest rates compared to their competitors is important, as it has a large impact on the amount mortgage applications coming in. If a financial institution has a significantly higher interest rate than its competitors, it will generally receive fewer mortgage applications as the independent mortgage advisors will forward its customers to a different mortgage lender.
--- PARAGRAPH REDACTED DUE TO CONFIDENTIALITY ---
[image:25.595.79.516.118.409.2]Besides the mortgage interest rate itself, interest rate changes also have a big impact on the amount of mortgage applications. Whenever the interest rate will decrease, one can expect a sudden drop in the amount of mortgage applications right before the interest rate decrease, and a peak in the amount of mortgage applications right after the interest rate decrease. With an interest rate increase, this relationship goes the other way around: right before an increase in interest rate the amount of mortgage applications peak, as consumers generally want to submit their mortgage application against the lowest rate, and right after an increase in interest rate the amount of mortgage applications drops. As mentioned in the interviews, changes in mortgage interest rates are often announced somewhere between 1 and 2 days before the actual change. The financial institutions deliberately announce these as late as possible, so that they do not provide their competitors with useful information. Mortgage advisors then have a few days to submit their mortgage applications, in case they want to make use of the old interest rate. Advisors often have multiple mortgage applications ready to be submitted, and are waiting for the best moment in terms of interest rates for the actual submission.
15 One of the factors influencing these decisions are the predictions for the mortgage interest rate for the upcoming period (i.e. if the mortgage interest rate is expected to decrease, it can be beneficial to wait with submission). There are multiple financial institutions in the Dutch mortgage market that provide mortgage interest rate predictions on a monthly or quarterly basis (Bokeloh, 2017; Vrieselaar et al., 2017). These predictions give an indication of what the interest rate might do in the upcoming period, but by no means give an accurate prediction. Even the domain experts seem to disagree every now and then, and the interest rates are dependent on so many factors that it is often difficult to provide an accurate prediction.
For the financial institutions, there can be a number of reasons to change its mortgage interest rate, as mentioned in the interviews. First of all, the mortgage interest rate is based on the cost of lending for the financial institutions itself. If the cost of debt is higher, the financial institutions will compensate this by charging higher interest rates for its mortgages, in order to keep a profitable margin on their products. This cost of lending is mainly based on the capital market interest rate, for the long-term loans, and the Euro Interbank Offered Rate (Euribor), for the short-term loans. If either of these changes significantly, one can expect the financial institutions to respond by changing their own mortgage interest rates. This usually happens after a few days.
Second, financial institutions generally work with a budget for their mortgages. Based on the amount of funding they can get, and on the interest rates and the duration of the funding, they determine a budget for their mortgages for the upcoming period. Ideally, financial institutions want to match the duration of the fixed interest period of a mortgage with the duration of the lending of debt for that mortgage. Once a financial institution is almost out of budget for a specific fixed interest period, it may choose to increase the interest rate for mortgages with that fixed interest period. This way, borrowers will apply for mortgages with a different fixed interest period, or may choose to go to another mortgage lender. Finally, financial institutions sometimes increase their interest rates during the summer months, and at the end of the year, as there is less personnel available to handle the requests due to vacations and holidays. With less personnel available they can handle less mortgage requests, so in order to keep the processing time the same they choose to reduce the input, by increasing the interest rates. Financial institutions may also specifically keep interest rates low for mortgages with a certain fixed interest period. For example, in order to increase its market share, a financial institution can offer a low interest rate for mortgages with a fixed interest period of 20 years, whereas the interest rates for other mortgages are in line with the market. Interest rate changes are not always directly influenced by changes in the cost of lending, but can have numerous reasons.
4.2.3 Changes in regulations
16 Generally there are two types of changes in regulations directed by the government: changes in the mortgage loan regulations and changes in Nationale Hypotheek Garantie (NHG). Changes in the mortgage loan regulations include amongst others changes in the maximum mortgage (i.e. the maximum rentable amount), also called the Loan-To-Value (LTV) ratio, and changes in the mortgage interest deduction. The LTV ratio is a financial term that indicates the ratio of the mortgage loan to the value of the property. The maximum LTV ratio is set by the Dutch government, and is currently capped at 101%. This means a mortgage borrower cannot lend more than 101% of the value of the property. This ratio was decreased by 1% each year, for the past 5 years, and is expected to decrease even further in the upcoming years, as the government wants the mortgage borrowers to bring in more equity in order to reduce risks. Changes in the mortgage loan regulations generally come into force the 1st of January each year.
Changes in NHG often occur at the 1st of July. NHG is a guarantee system for mortgage borrowers that buy a house, which serves as a safety net in case a mortgage borrower is unable to pay its mortgage costs due to circumstances such as unemployment. If a mortgage borrower goes default (i.e. is unable to pay its mortgage), NHG will offer possibilities to temporarily resolve the problem. A mortgage borrower can qualify for a mortgage with NHG under several conditions, the most important one being that it is only available for mortgages where the maximum mortgage is capped at a certain amount. The main advantage of having a mortgage with NHG is that the default risk is much lower for the mortgage lender, which results in a lower mortgage interest rate for the borrower and thus saves costs.
As mentioned in the interviews, these changes in regulations generally come into force at the 1st of January or the 1st of July, and are announced at Prinsjesdag, in which the government introduces its regulations for the next year. Changes in regulations can have different effects on the amount of mortgage applications, depending on the impact of the change. If a change in regulations has a negative impact on the consumer, one can generally expect an increase in the amount of mortgage applications before the change in regulations takes place, and a decrease in mortgage applications after the change, as the consumers generally want to submit their mortgage applications before the regulation change affects them. The other way around, if a change in regulations has a positive impact on the consumers, one can expect a decrease in the amount of mortgage applications before the change, and an increase in mortgage applications after the change.
In the last few years, the changes in regulations generally had a negative impact on the consumer. The NHG maximum rentable amount has decreased multiple times, and the LTV has gone down from 106% to 101% over the past five years. It is expected to negatively affect the consumer for at least a few more years in the upcoming future.
4.2.4 Other predictors
Besides the mortgage interest rates and changes in regulations, several other predictors were mentioned in the literature and interviews. These will be discussed briefly below. Furthermore, besides looking at the predictors of the amount of mortgage applications, we will also look at factors that affect the housing market. Since there is a strong relationship between the housing market and the mortgage market (i.e. the amount of houses sold and the amount of mortgage applications), we can assume that the factors that influence the housing market may affect the amount of mortgage applications (Boumeester, 2016).
17 (“Zomerdipje in hypotheekaanvragen,” 2016). According to Boumeester (2016), the amount of mortgage applications are low in January and February and during the summer months, and there are peaks in May, June, November and December. These findings were also confirmed in the interviews. We also expect a drop in the amount of mortgage applications during the weekends, as most of the mortgage advisors are not working during these days. Furthermore, holidays (e.g. Easter, Pentecost, and Christmas) are expected to have a negative impact on the amount of mortgage applications. Finally, even though there seems to be no autocorrelation between the amount of mortgage applications over time, we still want to include the historical amount of mortgage applications in our model (Brockwell & Davis, 2016). Even though the amount of mortgage applications are not dependent on the amount of mortgage applications for the previous day, week or month, there is still a time component present and there may be a correlation between these factors.
Another aspect that influences the amount of mortgages is the state of the housing market (Basten & Koch, 2015; Boumeester & Lamain, 2016; Deira, 2015; Pettinger, 2009, 2013; Van der Laan, 2015). In the housing market there are several factors that are of importance. First of all, the average house prices and expected changes in house prices have an effect on the amount of mortgage applications. If house prices are expected to increase, people might think it is a good moment to buy a house, and thus more mortgage applications may be coming in at the financial institutions. As mentioned in Chapter 4.1.1, this relationship between the two variables also works the other way around. House prices do not only influence the amount of mortgage applications, but mortgage applications in return also influence house prices. Second, rental prices are important. If the cost of renting is high, buying becomes more attractive compared to renting. Third, the amount of houses available has an effect on the amount of mortgages sold. If the supply of houses is large, the average house prices are going to drop and it will become more attractive to buy a house. All of these factors influence the amount of houses sold and thus the amount of mortgage applications. In the interviews each of these factors was identified as a possible predictor.
There are also a number of factors mentioned that are related to the state of the economy and the financial position of the consumers. In case of economic growth, or a growth in income, the amount of mortgage applications may increase as people are more likely to buy a new house (Boumeester & Lamain, 2016; Pettinger, 2013). The affordability of a house (i.e. the ratio of house prices to income) also plays an important factor here. If the incomes increase, but the house prices lag behind, the demand in houses should rise and thus the amount of houses and mortgages sold (Pettinger, 2009). Also an increase in consumer confidence has a positive effect on the housing market, and may thus increase the amount of mortgage applications (Deira, 2015). Finally, economic factors such as the propensity to buy and unemployment rates may also influence the financial position of a potential house buyer. In the interviews the importance of the economic situation was confirmed, albeit they only influence the amount of mortgage applications on the long term.
18
influence of the media. A technique to collect information from news websites and other kinds of publicly available sources is called Open Source Intelligence (OSINT) (Stalder & Hirsh, 2002).
4.3
PREDICTIVE ANALYTICS
Predictive analytics is a field in data mining that encompasses different statistical and machine learning techniques that are aimed at making empirical predictions (Finlay, 2014). These predictions are based on empirical data, rather than predictions that are based on theory only (Shmueli & Koppius, 2010). In predictive analytics, several statistical and machine learning techniques can be used to create predictive models. These models are used to exploit patterns in historical data, and make use of these patterns in order to predict future events. These models can be validated using different methods to determine the quality of such a model, in order to see which model performs best. The quality of such a model is also called predictive power (Shmueli & Koppius, 2010).
Predictive analytics can be applied in many different fields. Some of these include marketing, financial services and retail. According to a survey regarding the applications of predictive analytics (Eckerson, 2007), some of the most used applications of predictive analytics are cross-selling/upselling, campaign management and customer acquisition. However, in practice it can be applied to almost any field (Gandomi & Haider, 2015).
There are generally two types of problems predictive analytics is used for: classification problems and regression problems. The main difference between these two problems is the dependent variable, the target variable that is being predicted. In classification problems, the dependent variable is categorical (e.g. credit status). In regression problems, the dependent variable is continuous (e.g. pricing) (Gandomi & Haider, 2015).
The techniques that are used in predictive analytics to create a model depend heavily on the type of problem. For classification problems, classification techniques are used such as Naïve Bayes and decision trees. These techniques often consist out of one or multiple algorithms that can be used to construct a model. For decision trees, some of the algorithms are Classification and Regression Trees (CART), C4.5 and Conditional Inference Trees. Especially C4.5 and CART are some of the most influential data mining algorithms (Chen, Chiang, & Storey, 2012), because they are generally easy to use and simple to understand and interpret.
19 In order to compensate for the disadvantages of the individual models, ensemble models can be used. An ensemble model is a set of individually trained models, which predictors are combined to increase the predictive performance. Ensemble models are generally more accurate than any of the individual models that make up the ensemble model (Opitz & Maclin, 1999). Examples of techniques used for creating an ensemble model are bagging and boosting. With bagging, multiple versions of a predictor are used to create an aggregated predictor, in order to increase the accuracy of the model (Breiman, 1996). An example of a bagging algorithm is random forests, which combines a set of decision trees to increase the model performance (Ho, 1995).
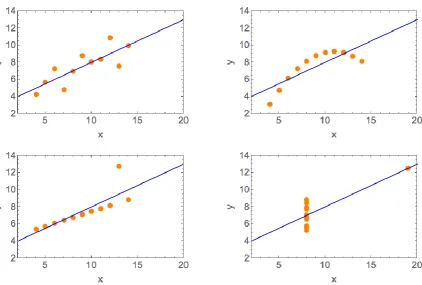
[image:30.595.95.518.67.352.2]A combination of the machine learning techniques mentioned above can be used to create predictive models. These models can then be validated and compared based on predictive power, which can be calculated using a set of statistical measures, such as Mean Absolute Error (MAE), Root Mean Square Error (RMSE) and R2 (Willmott & Matsuura, 2005).
20
5
DATA UNDERSTANDING
This chapter discusses the Data Understanding stage of the CRISP-DM framework. The Data Understanding stage has been split up in two parts: data collection and data exploration. In the data collection subchapter we will discuss characteristics of the event log data, and how the data has been extracted from the database. In the data exploration subchapter, the data and its characteristics are explored to extract useful information for our models.
5.1
DATA COLLECTION
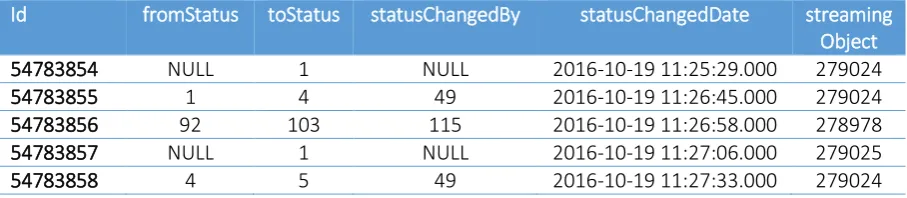
For our research we are working with a dataset from one of the clients of the FORCE product. Since the structure of the event log data is the same for each of the clients of the product FORCE, our solution can easily be generalized to other clients of the system. We will be using an anonymized version of the FORCE database of that specific financial institution to extract the data from. This is an SQL database that contains a number of tables that are used within FORCE. Since we are only interested in the event log data we will only be using one of the tables. This table contains data about the status changes in FORCE, for every mortgage application. Every action performed by the system or by a user on a mortgage application is logged, and the status before and after that specific action is logged. The table contains amongst others information about these statuses, the object of which the status was changed and the date and time of the status change. An example of the table structure and the data can be found in Table 2. For our analysis we are mainly interested in the date and time at which each of the mortgage applications have entered the system.
[image:31.595.71.525.540.639.2]In this table, the Id is the unique identifier of the row. The columns called fromStatus and toStatus indicate the status before and after the status change. In case the fromStatus column is NULL, there is no previous status, which means the object has just entered the system. The statusChangedBy column indicates the id of the employee that performed the status. If the statusChangedBy column is NULL then this action was performed automatically by the system. The statusChangedDate column contains the date and time of the status change. The streamingObject column contains the id of the object. This object is not always a mortgage application, it can also be for example a contract, so a further selection on the type of object has to be made.
Table 2 – Example overview of the database table
Id fromStatus toStatus statusChangedBy statusChangedDate streaming Object
54783854 NULL 1 NULL 2016-10-19 11:25:29.000 279024
54783855 1 4 49 2016-10-19 11:26:45.000 279024
54783856 92 103 115 2016-10-19 11:26:58.000 278978
54783857 NULL 1 NULL 2016-10-19 11:27:06.000 279025
54783858 4 5 49 2016-10-19 11:27:33.000 279024
21
5.2
DATA EXPLORATION
Since the objective is to make a prediction per day, our dataset can be grouped per day to create meaningful visualizations. The dataset contains data from January 2013 until May 2017. In order to get a feel of the amount of mortgage applications per day and the distribution of the mortgage applications, different visualizations can be made using R. Two graphs have been created, which can be found in Figure 7 and Figure 8. Both of these graphs only contain the amount of mortgage applications on the weekdays. As there are almost no applications coming in on the weekends they have been excluded from the graphs.
As can be seen from the graphs, there seems to be a seasonal pattern on a monthly level, but from these graphs it is not very clear. It also seems like there are some outliers, so these data points will have to be investigated to see if they will have to be included in our model, as there can be multiple underlying reasons for outliers in our dataset. It also seems there is an increase in mortgage applications during the last few months of each year, which confirms our findings in Chapter 4.2.4. The amount of applications per day during these months is almost doubled compared to the other months. This can have multiple explanations so this will have to be accounted for in the model.
The density plot shows the distribution of the amount of mortgage applications. It seems the distribution of the amount of mortgage applications is normally distributed, slightly skewed to the right with a long tail. This is due to the outliers mentioned before. The median seems to be at around --- NUMBER REDACTED --- mortgage applications per day.
Next to these plots, it is also interesting to look at the amount of daily mortgage applications per month. An overview of this can be found in Figure 9. In this plot we can confirm some of the findings from the literature, as discussed in Chapter 4.2. The amount of applications is slightly lower during the beginning of the year, and lower during the summer months. At the end of the year it rises again.
--- FIGURE REDACTED DUE TO CONFIDENTIALITY ---
Figure 7 – Daily amount of mortgage applications over time
--- FIGURE REDACTED DUE TO CONFIDENTIALITY ---
Figure 8 – Density plot of the amount of mortgage applications per day
--- FIGURE REDACTED DUE TO CONFIDENTIALITY ---
22
6
DATA PREPARATION
The Data Preparation stage of the CRISP-DM framework contains three elements: data pre-processing, feature engineering and feature selection. In the data pre-processing subchapter we pre-process the data so that it contains the right format for our models. In the feature engineering subchapter we create a list of features, using the predictors mentioned in Chapter 4.2.1. In the feature selection subchapter we select a subset of features that are useful for our model.
6.1
DATA PRE-PROCESSING
In the data pre-processing phase we pre-process our data to a suitable format for our predictive model. This phase consists out of the following steps. First, the data is grouped by day. Since we want to get insight in the amount of personnel needed on a daily level, we want to group the amount of mortgage applications per working day. In our definition of a working day at the financial institution, a working day ends at 17:00 so any application that enters the system after 17:00 will be processed the next day. The time component of a mortgage application is ignored afterwards.
Second, as there are minimal applications coming in during the weekends, we choose to transfer these applications to Monday. Third, mortgage applications that entered the system before the 1st of January 2013 have been removed from our dataset. From the dataset we can see that the log data starts at the --- DATE REDACTED ---. However, due to instability in the system and different changes in FORCE that affected the amount of mortgage applications coming in, we choose to exclude the data from before the 1st of January 2013. As this data would not be useful for our model, it is excluded. Finally, missing dates (i.e. dates without any mortgage applications) have been added to the model, as these need to be predicted as well.
6.2
FEATURE ENGINEERING
23 is announced, we may already expect an increase in mortgage applications. This increase in mortgage applications happens before the actual interest rate change itself.
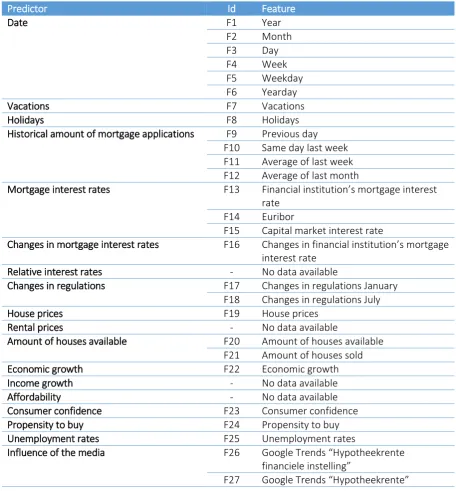
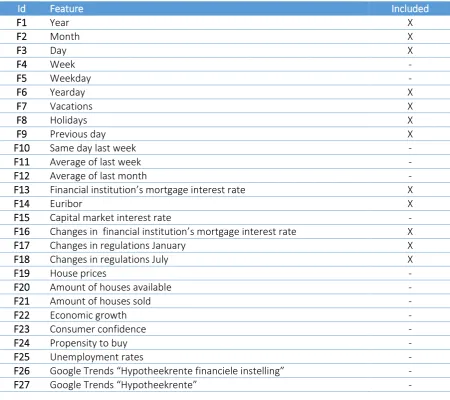
[image:34.595.69.526.208.700.2]In Table 3, an overview of the features can be found, as well as their corresponding predictors as mentioned in Chapter 4.2.1 and listed in Table 1. As can be seen in the table, we created a total of 27 features using different datasets. For four predictors (relative interest rates, rental prices, income growth and affordability), there was no suitable external data available. These have therefore been excluded from our research project.
Table 3 – Overview of features used in our models
Predictor Id Feature
Date F1 Year
F2 Month F3 Day
F4 Week
F5 Weekday F6 Yearday
Vacations F7 Vacations
Holidays F8 Holidays
Historical amount of mortgage applications F9 Previous day F10 Same day last week F11 Average of last week F12 Average of last month
Mortgage interest rates F13 Financial institution’s mortgage interest rate
F14 Euribor
F15 Capital market interest rate
Changes in mortgage interest rates F16 Changes in financial institution’s mortgage interest rate
Relative interest rates - No data available
Changes in regulations F17 Changes in regulations January F18 Changes in regulations July
House prices F19 House prices
Rental prices - No data available
Amount of houses available F20 Amount of houses available F21 Amount of houses sold
Economic growth F22 Economic growth
Income growth - No data available
Affordability - No data available
Consumer confidence F23 Consumer confidence
Propensity to buy F24 Propensity to buy
Unemployment rates F25 Unemployment rates
Influence of the media F26 Google Trends “Hypotheekrente
financiele instelling”
F27 Google Trends “Hypotheekrente”
24 holidays (F7, F8) were extracted (Kalender 365, 2017; Schoolvakanties Nederland, 2017). Also aggregations are made of the historical amount of mortgage applications (F9 – F12).
For the mortgage interest rates, the financial institution’s mortgage interest rates were derived from their database (F13). Also two indicator of the financial institution’s mortgage interest rate were used in our model: the Euribor rate (F14) and the capital market interest rate (F15) using external data from De Nederlandsche Bank (DNB) (De Nederlandsche Bank, 2017). Also changes in the financial institution’s mortgage interest rate were used as a feature (F16), explicitly making a separation between a decrease in mortgage interest rate and an increase in mortgage interest rate. Both of these have a different impact on the amount of mortgage applications, as explained in Chapter 4.2.2. These changes in mortgage interest rate almost impact the days before and after the actual change. Data regarding relative interest rates could unfortunately not be found. Current interest rates of all financial institutions in the Dutch mortgage market are available, but no historical data could be found.
For the changes in regulations two features have been created. A separation has been made between changes in the mortgage loan regulations (F17), which generally come into force at the first of January, and changes in NHG regulations (F18), which generally come into force at the first of July. External data was obtained from NHG and Rijksoverheid (Ministerie van Algemene Zaken, 2016; NHG, 2016). Three features have been derived to incorporate the changes on the housing market into our model. A feature was derived using housing prices on the Dutch housing market (F19), and two other features indicate the amount of houses available and the amount of houses sold given a specific timestamp (F20, F21). External data was extracted using Kadaster and Centraal Bureau voor de Statistiek (CBS) (CBS StatLine, 2017b; Kadaster, 2017). For the rental prices, no external data source was found, so this predictor was excluded from our research project.
Regarding the state of the economy, four features were created using data from CBS: economic growth, consumer confidence, propensity to buy and unemployment rates (F22 – F25) (CBS StatLine, 2017a). For the income growth and affordability, the data was aggregated on a yearly level, and hence not useful for our model as our data is aggregated on a daily level. The variance between the observations would be too low to contain enough predictive power for our models.
Finally, the influence of the media was added by analyzing Google Trends data (Google Trends, 2017). Two features were derived using the search terms “Hypotheekrente” and “Hypotheekrente financiele instelling” (F26, F27), in which the term “financiele instelling” is replaced by the name of the actual financial institution. There are several other sources of external data that could have been used to collect OSINT, but these have been excluded from our analysis due to time restrictions.