MASTER THESIS
What Project Management System
does the Multidisciplinary Team want?
A requirement study to compare the users’ wishes
with two project management systems.
Renée de Wolf, BSc.
2
What Project Management System does the
Multidisciplinary Team want?
A requirement study to compare the users’ wishes with two
project management systems.
UNIVERSITY OF TWENTE.
FACULTY OF BEHAVIOURAL, MANAGEMENT AND SOCIAL SCIENCES (BMS). HUMAN FACTORS AND ENGINEERING PSYCHOLOGY.
AUTHOR.
Renée de Wolf, BSc. S1593013
SUPERVISORS UNIVERSITY OF TWENTE. Dr. M. Schmettow
S.M. Vosslamber, MSc.
SUPERVISOR ELITAC B.V. B.S. Bicknese, B.Eng.
3
Abstract
4
Table of Contents
1. Introduction ... 6
1.1 Project Management Approaches ... 6
1.2 Project Types ... 8
1.3 User Centered Design ... 9
1.4 Requirement Engineering ... 10
1.5 Company Background ... 13
1.6 Goal of this study ... 14
1.7 Structure ... 14
2. Method ... 15
2.1 Research Design ... 15
2.2 Participants ... 16
2.3 Part 1 Interviews and Focus Group ... 16
2.4 Part 2 Card Sorting ... 20
2.5 Part 3 System Evaluation and Comparison ... 21
3. Results ... 23
3.1 Part 1 Interviews and Focus Group ... 23
3.2 Part 2 Card Sorting ... 31
3.3 Part 3 System Evaluation and Comparison ... 34
4. Discussion ... 36
4.1 Reflection results ... 36
4.2 Implications for practice ... 39
4.3 Strengths and limitations ... 41
4.4 Reflection research design ... 42
4.5 Optional recommendations ... 44
5. References ... 46
Appendix A. Informed Consent ... 51
Appendix B. Interview Protocol ... 52
Appendix C. Focus Group Protocol ... 55
Appendix D. Mind Map V2 ... 57
5
Appendix F. Python code for heatmap ... 59
Appendix G. Ontology: content-labels throughout the system ... 60
Appendix H. Checklist Requirements Jira ... 62
6 What Project Management System does the Multidisciplinary Team want?
A requirement study to compare the users’ wishes with two project management systems.
1.
Introduction
The development of embedded systems is a complex endeavor. As Matzler and Hinterhuber (1998) described, one does not only need to meet customers’ expectations and reach a high level of customer satisfaction. Also, time is essential, as time to market is becoming
increasingly more important. Ensuring a good communication between different disciplines involved in the development helps to circumvent that resources are wasted. And lastly, it is critical to make sure the development process of product development is conducted
systematically. Managing a project helps in making the development process more efficient and effective. This Project Management (PM) entails planning, organizing, directing, and controlling of company resources for a relatively short-term objective that has been
established to complete specific goals and objectives (Kerzner, 2013). Note that ‘short-term’ is a definition that varies among different industries. The ISO 21500 by Zandhuis and Stellingwerf (2012) provides the following definition; “PM is the application of methods, tools, techniques and competences to a project”. This includes the integration of various phases of the project life cycle, producing deliverables that are measurable, tangible outputs, such as hardware-, software-, or interim deliverables, accomplished through processes (Kerzner, 2013; Zandhuis & Stellingwerf, 2012).
But efficient PM requires more than good planning, like obtaining relevant information in a timely manner, and analyzing and reviewing this (Kerzner, 2013). PM software is a big support in this matter for it helps in managing the development process. But which one among the many different systems does one choose? Multiple factors that have to be taken into account are for example the choice in management approach, the type of project, and no less important; the users’ wishes regarding such system.
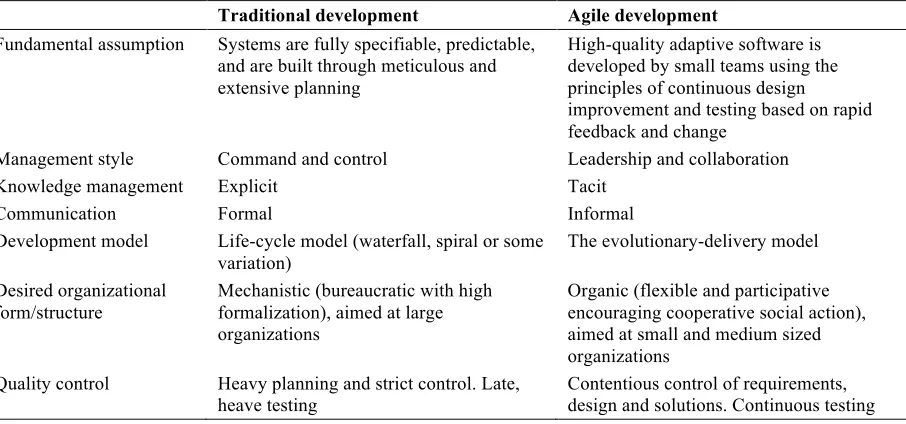
1.1 Project Management Approaches
7 Table 1.
Main differences between traditional development and agile development (Dybå & Dingsøyr, 2008).
Traditional development Agile development
Fundamental assumption Systems are fully specifiable, predictable, and are built through meticulous and extensive planning
High-quality adaptive software is developed by small teams using the principles of continuous design improvement and testing based on rapid feedback and change
Management style Command and control Leadership and collaboration Knowledge management Explicit Tacit
Communication Formal Informal
Development model Life-cycle model (waterfall, spiral or some
variation) The evolutionary-delivery model Desired organizational
form/structure Mechanistic (bureaucratic with high formalization), aimed at large organizations
Organic (flexible and participative encouraging cooperative social action), aimed at small and medium sized organizations
Quality control Heavy planning and strict control. Late,
heave testing Contentious control of requirements, design and solutions. Continuous testing
Traditional relies on specification-driven methods, such as the waterfall method, using extensive planning, codified processes, massive documentation, and rigorous reuse to make development an efficient and predictable activity (Boehm, 2002; Hoda & Murugesan, 2016). The customer is involved in the beginning and at the end of the project only (Castillo,
2016b).
In the 1990s, alternatives to the traditional approaches emerged, giving rise to agile approaches (Könnölä et al., 2016). These agile methods improve the process flexibility and transparency, making the development more efficient and productive. As case evidence in the study of Könnölä et al. (2016) showed, the interdependencies between work of each
developer were better taken into account, product visibility was increased, and
8 Warren, Hemsley, & Stevens, 2010), for example by developer-tester interaction
accompanying the development (Bjarnason, Unterkalmsteiner, Borg, & Engström, 2016). According to Špundak (2014), this iterative approach should help in building a final project scope and a better customer satisfaction. Furthermore, this approach has a greater focus on informal communication (Collyer et al., 2010; Coram & Bohner, 2005). An agile approach example is the scrum method, which is according to Hoda and Murugesan (2016) the most popular agile method. Typically, one has a team of approximately four to 10 people with a ‘product owner’ (responsible for the return on investment), a ‘scrum master’ (one responsible for ensuring that the whole team is working well together and follows the agile-scrum
methodology), and the developers (Castillo, 2016a). The idea is to iteratively develop a scope of what is to be done by using repetitive periods called ‘sprints’, and validating and
prioritizing the outputs.
1.2 Project Types
Within an organization, each project is unique and differs e.g. in resources used, deliverables provided, etc., which makes that project management is practiced differently in different contexts (Besner & Hobbs, 2012; Zandhuis & Stellingwerf, 2012). The type of project deliverable itself is according to Besner and Hobbs (2012) considered as more representative of the patterns of variation in practices than the industry. Therefore they looked at differences in the context in which different types of projects are found.
Using data of a worldwide survey with 2,339 project management practitioners, Besner and Hobbs (2012) chose to compare the four biggest subgroups: ‘business and financial services’, ‘engineering and construction’, ‘IT and telecommunication’, and
9 Next to the PM approach and project type, one needs to know what the users want and need to make a sound decision regarding a PM system. This basically is a question of user-centered design.
1.3 User Centered Design
A system should be consistent with the knowledge and experiences of the user, making it is easer to learn and use (Roske-Hofstrand & Paap, 1986). Bringing the user into the
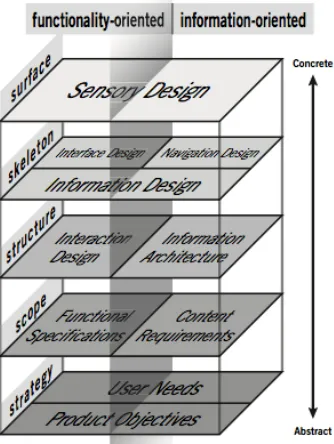
[image:9.595.215.382.415.637.2]development process is called User Centered Design (UCD). The ISO 13407 describes that the idea of UCD is that one is engaged in an iterative development cycle, where the users’ needs are taken into account during developing, as well as the needs of the owner and the developer (Earthy, Jones, & Bevan, 2012). The UCD processes deal with the total system, using a multi-disciplinary activity, and focusing on making the system usable (ISO, 1999). A somewhat similar holistic design approach is the User Experience Design (UXD) by Garrett (2006), shown in figure 1. However, where the UCD focuses on making the system usable, the UXD also incorporates a satisfying user experience.
Figure 1. The Elements of User Experience Model (Garrett, 2006).
10 informational aspects. With functional specifications, the set of operations the product will enable the user to perform are meant. The informational aspects, or content requirements, describe the information the product needs to communicate to the user.
Third, the structure is uncovered by looking at the information architecture. When developing systems, this is important because a system should be consistent with the knowledge and experiences of the user, making the system easier to learn and use (Roske-Hofstrand & Paap, 1986). But it also influences the emotional impact, making the product feel familiar and comfortable (Garrett, 2006). The last two steps entail more interaction and interface design related aspects, like arrangement and visual choices.
1.4 Requirement Engineering
For choosing a PM system, the users’ wishes have to be clear. In this, requirement
engineering is an important activity, for other phases in the development process depend on it. It can be defined as the process of seeking, uncovering, acquiring, and elaborating requirements (Zowghi & Coulin, 2005).
1.4.1 Eliciting Requirements
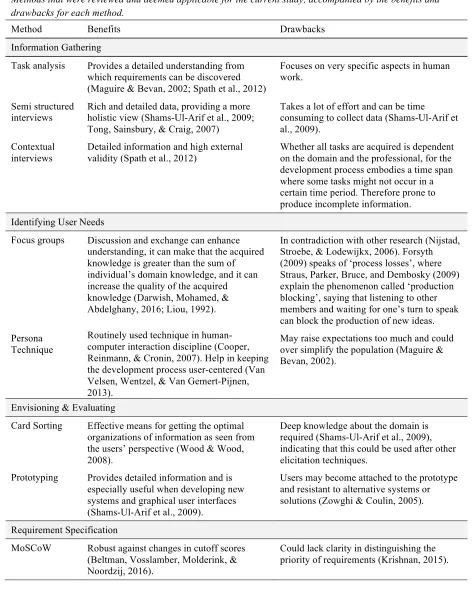
There are different elicitation techniques that could be used to gather requirements (Maguire & Bevan, 2002; Spath et al., 2012). Shams-Ul-Arif, Khan, and Gahyyur (2009) for example explain eighteen different tools for the elicitation part, giving advantages and disadvantages for each one. Also Zowghi and Coulin (2005) give a summary of twenty techniques with comparisons. The more applicable options for the current study, e.g. due to the number of participants or time constraints, are shown in table 2. The table summarizes methods to gather information, identify user needs once data has been collected, potential techniques that help with envisioning and evaluating the data, and lastly a technique that supports
requirement specification. For each method or technique the benefits and drawbacks are written down.
Regardless of the research method, Mason (2010) explains that the sample size should be large enough to ensure that most or all important information is uncovered. This is
11 Table 2.
Methods that were reviewed and deemed applicable for the current study, accompanied by the benefits and drawbacks for each method.
Method Benefits Drawbacks
Information Gathering
Task analysis Provides a detailed understanding from which requirements can be discovered (Maguire & Bevan, 2002; Spath et al., 2012)
Focuses on very specific aspects in human work.
Semi structured
interviews Rich and detailed data, providing a more holistic view (Shams-Ul-Arif et al., 2009; Tong, Sainsbury, & Craig, 2007)
Takes a lot of effort and can be time consuming to collect data (Shams-Ul-Arif et al., 2009).
Contextual interviews
Detailed information and high external validity (Spath et al., 2012)
Whether all tasks are acquired is dependent on the domain and the professional, for the development process embodies a time span where some tasks might not occur in a certain time period. Therefore prone to produce incomplete information.
Identifying User Needs
Focus groups Discussion and exchange can enhance understanding, it can make that the acquired knowledge is greater than the sum of individual’s domain knowledge, and it can increase the quality of the acquired knowledge (Darwish, Mohamed, & Abdelghany, 2016; Liou, 1992).
In contradiction with other research (Nijstad, Stroebe, & Lodewijkx, 2006). Forsyth (2009) speaks of ‘process losses’, where Straus, Parker, Bruce, and Dembosky (2009) explain the phenomenon called ‘production blocking’, saying that listening to other members and waiting for one’s turn to speak can block the production of new ideas. Persona
Technique
Routinely used technique in human-computer interaction discipline (Cooper, Reinmann, & Cronin, 2007). Help in keeping the development process user-centered (Van Velsen, Wentzel, & Van Gemert-Pijnen, 2013).
May raise expectations too much and could over simplify the population (Maguire & Bevan, 2002).
Envisioning & Evaluating
Card Sorting Effective means for getting the optimal organizations of information as seen from the users’ perspective (Wood & Wood, 2008).
Deep knowledge about the domain is required (Shams-Ul-Arif et al., 2009), indicating that this could be used after other elicitation techniques.
Prototyping Provides detailed information and is especially useful when developing new systems and graphical user interfaces (Shams-Ul-Arif et al., 2009).
Users may become attached to the prototype and resistant to alternative systems or solutions (Zowghi & Coulin, 2005).
Requirement Specification
MoSCoW Robust against changes in cutoff scores (Beltman, Vosslamber, Molderink, & Noordzij, 2016).
[image:11.595.61.533.125.723.2]12 1.4.2 Documentation
After the elicitation face, the output is analyzed and transformed into requirements, which are in turn documented. Requirements can express different areas, e.g., requirements representing user needs, or requirements concerning the design. Maguire and Bevan (2002) for example make a distinction between user requirements, usability requirements, and organizational requirements, while Hansen, Berente, and Lyytinen (2009) talk about design requirements. Van Velsen, Wentzel, and Van Gemert-Pijnen (2013) use functional and modality
requirements, service requirements, organizational requirements, content requirements, usability and user experience requirements. Looking at the UXD of Garrett (2006), the following distinction can be made in requirement types: functional, content, structure, and more design related requirements. The distinction made can depend on the subject under investigation during the research study.
Requirements can be documented by writing down the requirement name, an identifier, and a description. In addition, Van Velsen et al. (2013) documented the
requirement type, value, attribute, fit criteria, priority, and possible conflicts, where Ambler (2004) states it is also optional to include an example for each requirement, or the source to verify, related requirements, or revision history. One can also use scenarios and use cases that provide detailed and realistic examples to aid the understanding of requirements (Maguire & Bevan, 2002; Spath et al., 2012).
1.4.3 Verifying and Validating Requirements
A distinction can be made between verification and validation, where verification is about proving the requirements have been satisfied (Maalem & Zarour, 2016). Validation concerns the evaluation at the end of the development cycle (Boehm, 1984). Criteria for the
verification and validating of requirements are about checking the consistency, completeness, feasibility, and testability of the elicited requirements (Boehm, 1984; Lee, In, & Kazman, 2014). Verifying outcomes with users offers a high degree of certainty of credibility
13 1.5 Company Background
Elitac is a company engaged in product development, making vibration electronics in various wearable textiles. In order to realize the development of these products, they work with a multidisciplinary team of ten employees, including a project manager, scientists, software and electronics developers, designers, and professionals engaged in commercial aspects. This makes that knowledge is distributed among different persons. The product development process is therefore characterized by a demand for intensive exchange of knowledge between the professionals working in the different domains. This entails for example information about the progress, or knowledge for the engineering process, like design specifications, user and system requirements, etc. Their development entails hardware development like printed circuit board design (PCB) and textile wearable’s, concurrent with software programming, using the agile-scrum methodology. Compared to the results from the study of Besner and Hobbs (2012), Elitac could be placed in the ‘engineering and construction’ project combined with ‘software development’. Though, software development may be different from what participants reported in Besner and Hobbs’ study, for software engineers engaged in hardware development spend a lot of time interacting with the hardware, e.g. loading and running the software, configuring hardware, debugging, etc. (Singer, Lethbridge, Vinson, & Anquetil, 1997).
In most cases, the projects Elitac works on embody a larger period of time (months to years), starting with an idea and investigation concerning the possibilities. When a more concord plan is developed, many iteration sessions for both software and hardware follow. Currently, professionals at Elitac mainly rely on face-to-face communication and
14 1.6 Goal of this study
The main goal of this study is to evaluate the PM platforms Jira and Taiga, by deriving requirements concerning the design of such systems, and review if these are represented in the systems. The question guiding this goal is formulated as follows: “How should a Project Management System be designed for Elitac to achieve an efficient workflow?”
In keeping with the UXD, the first phase seeks to expand the understanding of the user needs. This is done by uncovering what goals the users have for interacting with the system, and what characteristics the users desire concerning the experience, leading to the question:
1. What are the goals and objectives users have for using a PM system?
The second step focuses on the functional and informational aspects of the system. Translating this into questions resulted into the following sub questions:
2. What functions (set of operations to enable the user to perform) do users want to see in a PM system?
3. What information do the users want to be available in the system?
To uncover the information architecture, a more structure related question concerns: 4. What mental model does the average user have of the content in the PM system?
And lastly, looking at the PM platforms ‘Jira’ and ‘Taiga’, the question remains: 5. How do the user requirements relate to the currently used system ‘Jira’, and the
alternative chosen system ‘Taiga’?
1.7 Structure
15
2.
Method
2.1 Research Design
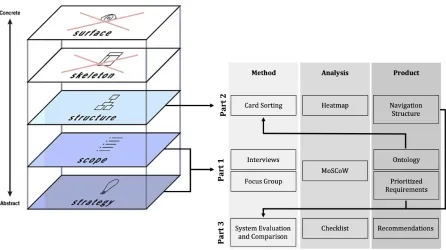
[image:15.595.75.521.250.500.2]For the current research, a qualitative approach was conducted, for qualitative research contributes to new knowledge and can give new perspectives (Tong et al., 2007). The research design for this study is shown in figure 2.
Figure 2. Tailor made model for current study, showing the three parts of this study, what methods are used to elicit information for the first three planes of the UXD model, and the chosen methods for the analysis, and the resulting products.
Part one seeks to answer the first three sub questions: ‘what are the goals and objectives users have for using a PM system?’, ‘what functions (set of operations to enable the user to
perform) do users want to see in a PM system?’, and ‘what information do the users want to be available in the system?’. Information is elicited by conducting semi-structured interviews. Even though all nine professionals working at the company Elitac were partaking in this study, it could be that important information was missed due to the small number of
16 2016; Seale, 1999). Findings were transcribed, coded, translated to requirements, and
prioritized using the MoSCoW method. The resulting prioritized requirement list and the ontology were used in other stages of the study.
Card sorting was a means in part two of the study. Looking at the information architecture, this technique was to answer the last sub question ‘what mental model does the average user have of the content in the PM system?’. Using a heatmapto analyze the results, this gave rise to mental models.
The third part was to answer the fifth sub question: ‘how do the user requirements relate to the currently used system ‘Jira’, and the alternative chosen system ‘Taiga’?’. The products from the prior parts (prioritized requirements and mental model) provided for evaluating and making a comparison of how the outcomes related with the two PM systems.
2.2 Participants
All nine employees working at Elitac took part in this study, of whom seven males and two women, their age ranging from 21 to 38 years of age (M = 29.33; SD = 4.80). As mentioned before, the employees at Elitac work with a multidisciplinary team including a project manager, scientists, software and electronics developers, designers, and professionals
engaged in commercial aspects. Prior to the study, participants received an informed consent, which had to be signed in order to participate. This informed consent can be found in
appendix A. The methodology was approved by the BMS ethics committee of University Twente.
2.3 Part 1 Interviews and Focus Group
The first part entailed interviews and after analysis, a focus group to verify the results with all participants. The methodology is explained in more detail in the following part.
2.3.1 Interviews. Nine semi-structured interviews were conducted (face-to-face) with the participants separately.
Materials. In preparation, an interview protocol was composed, providing some
demographic questions, and pre-made probe questions relating to the first three sub questions of the study. Themes that the protocol was divided in followed these questions, resulting in the following themes: ‘goals and objectives’, ‘functional requirements’, and ‘content
17 timing of the session, activities, wording of questions, and to make the protocol and
procedure better. The participant for the pilot did not work at Elitac. Afterwards alterations were made, resulting in a second version protocol used for the main study. However, after each interview also alterations were made so new information could be discussed in following interviews, improving the completeness. The last version of the protocol is included in appendix B. The interviews were voice-recorded, using a laptop, and a phone as backup.
Procedure. The researcher approached all participants individually at the office
during working hours. After giving a short introduction of what the research was about and giving an indication of the duration or the interview (60 minutes), the researcher asked if the professional wanted to participate. If said yes, an appointment was scheduled for the first interview. The interviews were held in a conference room provided by Elitac. Each interview started with a little introduction to the research topic and goal. The participant received the informed consent on which the research topic and goal again were explained, as were the duration of the interview, and that participating was voluntary and that if the participant reconsidered, he or she was free to withdraw at any minute. Only when signed, the interview could continue, and the recordings could start.
Following the themes of the interview protocol, the interview started with a few demographic questions like age, function at Elitac, and years working at Elitac, the three themes, and an ending of the interview. The first theme was about the goals and objectives of participants for using a PM system, and thus sought for answers concerning the first sub question. Examples of questions that were asked are ‘how is a project currently managed?’ and ‘what do you think could a PM system provide for you?’. The second theme consisted of questions regarding functional requirements, asking what would make the system more or less useful. Next, the third theme entailed questions about content information. Giving rise to questions like ‘what information do you need from others’, ‘what information do others need from you’, etc. As stated earlier, the interviews were semi-structured, meaning that during the interviews there was a defined line of objects and questions to discuss, but also the
18
Data analysis. The audio files of the conducted interviews were transcribed to written
text for further analysis. This was done using the program F5 to play back the audio files in a lower speed. To aid the translation process from interview to requirements, quotes that captured something important in relation to the overall goal(s) were identified and coded, converting raw data from the interviews into usable data by identifying themes, concepts, or ideas and their connections (Austin & Sutton, 2014). This was done with an inductive approach, for codes emerged from the data. Assisting this process, the data managing
program ATLAS.ti was used. Another researcher also coded two randomly chosen interviews in order to test the coding protocol and if needed revise it to ensure the coding scheme would be applied consistently. To later translate the raw data into requirements, part of the steps explained by Van Velsen et al. (2013) were used. As important quotes in the interviews were coded and grouped in the taxonomy, these represented attributes on which requirements could be formulated. To help analyze wishes regarding functionality of the system and look for relations etc., the program MindMaple Lite was used and made the results visual.
2.3.2 Focus Group. To check for redundancy and completeness regarding user needs, a focus group was carried out with all participants together.
Materials. As for the interviews, a protocol was made, providing some pre-made
probe questions. The five themes discussed were based on the major functionality that became clear after analyzing the results of the interviews and creating the mindmap. The major functionality-themes in which the user needs could be divided were formulated as follows: ‘backlog’, ‘task level’, ‘sprint level’, ‘long term planning’, and ‘others. The protocol is included in appendix C. To further guide this focus group, a PowerPoint presentation was created. For this presentation, each PowerPoint slide showed one branch of the mindmap at a time, after which the whole mindmap was presented. Each branch represented a major functionality-theme. A TV screen was used to present the PowerPoint on, and a laptop and phone were available to record the focus group for later analysis.
Procedure. The focus group was conducted in a conference room at Elitac. A short
19 about item number X?’, ‘do you miss functionality that should have been at display here?’. This was done for all the branches of the mindmap. The researcher guided the discussions that arose, asking the opinion of multiple professionals. When consensus arrived about the items that should be available for the major functionality, i.e. regarding the backlog, the researcher summarized what was discussed, asked if this was correct, and if so moved on to the next major functionality branch. After all themes were discussed, the whole mindmap was presented. Lastly, the researcher asked the participant if there was something they would like to add or discuss regarding the functionality. The recording was stopped and saved, and participants were thanked for participating.
Data analysis. The focus group was transcribed using the program F5. As for the
analysis of the interviews, the focus group was coded with an inductive approach using ATLAS.ti. This was done because the focus group was meant to verify the results, but also uncover new and thus missed data. The same steps explained by Van Velsen et al. (2013) were used, coding the important quotes and clustering them in a taxonomy. For the new codes, new requirements were formulated and added to the already existing list. Also, the mindmap was altered, resulting in a second version, which is included in appendix D.
2.3.3 User requirements. Using the taxonomy and mind map, requirements were
formulated. This was done following the guideline from Cooper et al. (2007), stating that a requirement consists of an action, object, and context, e.g. ‘see (action) an overview of the deadlines (object) for each project (context)’. An independent analyst checked the taxonomy, mind map, and the formulated requirements, after which disagreements and suggestions were discussed. In the end, this made that on a small scale the taxonomy was altered incorporating the feedback from the other analyst. For each requirement the following information was written down: the requirement identifier (No.), and name. In order for the system evaluation and comparison, acceptance criteria were formulated for each requirement.
2.3.4 MoSCoW method. The user requirements were prioritized using the MoSCoW
20 PowerPoint. For each presented requirement, all participants had to place one card on the table (placed upside down; the must/should/ could/won’t facing the table). When all participants had a card on the table, the cards were turned and discussed until there was consensus about the priority of that requirement. When consensus arrived, the researcher wrote down the result, and the process started anew with another requirement. The results were later on written down in the fourth column in the requirement tables.
2.3.5 Ontology. The labels concerning content information were summarized in an ontology, providing a list of vocabulary that could be used throughout the system, accompanied with an explanation for each label. They can serve as a basis for technology’s data structure, useful because consensus about this vocabulary can avoid miscommunication, misunderstanding, and inconsistencies (TNO & TUD, 2012). Therefore, the ontology was communicated with all professionals. This provided for checking if the information labels were correct, if there was content missing, and gave rise to universal label names that were understood by all participants. Checking the ontology was initially done face to face. However, after three participants it became clear that this was a very time consuming process. Therefor, the other six professionals received the list via mail and were asked to respond within a week. Based on the feedback, alterations were made.
2.4 Part 2 Card Sorting
Part two of the study sought to uncover the mental models participants had for the
information in the PMS. This was done using the card sorting technique. For each participant separately, his or her mental model was explored. Using the labels summarized in the
ontology, the card sorting task was done with an open, hierarchical sort.
Materials. Paper cards were made, on which content information was visible. The
ontology constructed earlier was placed next to the participant on the table, presenting all the labels with a description for each item.
Microsoft Excel was used for making the matrixes and conducting the average of all data. Python was later on used to create the heatmap and cluster the items.
Procedure. The card sorting task took place in a room provided by Elitac, with all
21 All cards were shuffled and the stack of cards was given to the participant. Next, the participant was asked to sort the items, with the possibility to sort them in different levels. This was done because the labels provided all content for different project phases, where some information relates more to each other. For in the PM system, it is interesting to see in what proximity certain information could be placed. For each pile, the participant was asked to name it. If they couldn’t think of an applicable name, the pile remained unnamed.
Data analysis. After all the card sorting tasks were conducted with the professionals,
the results were analyzed by making a similarity matrix. First, as done by Schmettow and Sommer (2016), a similarity measure for hierarchical card sorts was used; the Jaccard coefficient.
For two items (A and B) the Jaccard coefficient is constructed by counting the number of groups both items are members of, which is divided by the number of groups at least one item is a member of. When this was done for all nine card sorts, the average for each item in the matrix was calculated. This was done in Microsoft Excel.
Next, the resulting average similarity matrix was loaded into Python. A similarity matrix consists of number ranging from 0 to 1, 1 meaning the items are very similar or equal, where 0 indicates the items never occurred in the same set, and thus no similarity. To
visualize the average mental model, a heatmap was created. This is a graphical representation where the warmer or darker colors represent a stronger similarity. It was chosen to create a heatmap, because compared to dendograms these convey more information about the similarity. To cluster the items, it was chosen to compute the correlation distance between them in Python. The code used can be found in appendix F.
2.5 Part 3 System Evaluation and Comparison
The third part of the study entailed an evaluation of both the PM systems Jira and Taiga.
Materials. As mentioned earlier, acceptance criteria were created for all requirements,
22 requirement name and assigned priority. The checklist provided a fifth column that was added to state if the requirement was met (‘OK’) or failed (‘-‘).
Both programs were needed to test them. To check Jira without disturbing the workflow at Elitac, a free 7-days account was created. For Taiga there already was an account made which could be used.
Procedure. First the PM system Jira was tested. Each task related to a requirement
was tested starting with the first requirement down. For each requirement that the researcher tried to perform in the system, the acceptance criteria had to be met in order to set the requirement to ‘OK’ or failed. This was the same for the PM system Taiga. Whenever the researcher wanted to double check or because it wasn’t sure if the requirement exactly did what it should do, the Jira/Taiga website was consulted.
Also for the content information the system was checked, by looking into the
possibility to add multiple fields for information, if these could be giving different headings and if a description could be added to these fields. Also the order in which the fields could be added is checked. If the information could be arranged in the clusters and order the average mental model presented, this requirement was met.
Data analysis. When both systems were checked, the overall percentages of accepted
23
3.
Results
In this study, the main question was formulated as follows: “How should a Project
Management System be designed for Elitac to achieve an efficient workflow?” To answer this question, the research was divided into three parts. The first part entailed nine interviews and a focus group. The goal was to get more insight into the goal and objectives of the
professionals for using a PM system. Also, the researcher asked about the users’ wishes regarding the system. Based on this information, requirements were formulated and
prioritized using the MoSCoW method. Lastly, the interviews provided for eliciting content information that would be used throughout the PM system. This was summarized in an ontology and later on used during the card sorting test. The second part sought to uncover mental models by conducting nine card sorting tests. The content labels summarized in the ontology were sorted, providing a navigation structure. This knowledge can be used by Elitac to customize the chosen PM system. And lastly, the third part of this study was to evaluate both PM systems Jira and Taiga, and comparing the results between the two.
3.1 Part 1 Interviews and Focus Group
Outcomes of the interviews and focus group are described in this section. Using the three sub-questions presented in the introduction, this section concerns the goals and objectives of professionals for using a PM system, their wishes regarding functionality, and what content information has to be available throughout the system.
3.1.1 Goals and objectives
24 The executing professionals explained this means there is no overview of what tasks will come next, where for others this refers to the difficulty of managing the process. In general, one person manages and oversees the projects, keeping the overview of the progress, tasks for the (near) future, deadlines, and more. This is experienced as pleasant by most professionals, for one can work on a few tasks, and when finished ask what can be done next. However, the lack of knowledge of what tasks the future will bring has some consequences; “van de ene kant is mijn workload nu heel goed gemanaged door haar, maar van de andere kant kan ik niet altijd goed bedenken wat er handig zou zijn om nu te doen” (r4).
Professionals cannot plan ahead, and cannot prepare or think about an upcoming task. Moreover, one professional mentions the risk of losing the overall goal of what they are doing. “Als je daar zelf ook geen overzicht over hebt dan weet je ook niet zo goed waar je het voor doet” (r6).
The lack of insight in the process is not only towards tasks that have to be executed, for seeing what other professionals are doing and working on is also preferred. Professionals want to know what other colleagues are working on, making professionals feel more
involved. In addition, professionals knows with whom and when to communicate about tasks. Relating this insight to the long term planning, several professionals talked about an overview of the overall project, upcoming deadlines, and the availability of professionals during the projects. Also, wanting to see in what phase one is working, i.e. the exploring phase, developing phase, evaluation, etc.
Next to insight and managing the development process, the goal of using a PM system is to document the process. In addition, almost all professionals thought and hoped the
system could provide more structure to projects.
3.1.2 Functionality
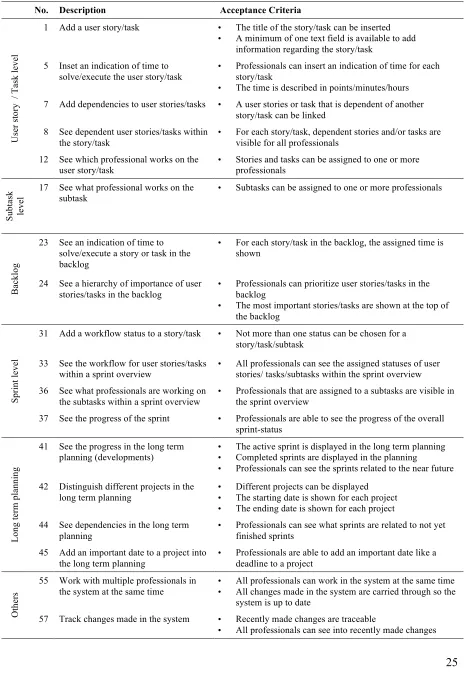
Translating the information into requirements resulted in 62 requirements, which were prioritized using the MoSCoW technique. Of these requirements, 18 were deemed ‘must haves’, 31 ‘should haves’, and the remaining 13 were labeled ‘could haves’. None of the requirements was deemed a ‘won’t have’. Table 3 shows a summary of the most important requirements that came out of this study, the ‘must haves’. The complete list with 62 requirements can be found in the appendix.
25 Table 3.
The most important requirements (‘must haves’) in this study for each category.
No. Description Acceptance Criteria
Us er s to ry / T as k le ve l
1 Add a user story/task • The title of the story/task can be inserted • A minimum of one text field is available to add
information regarding the story/task 5 Inset an indication of time to
solve/execute the user story/task
• Professionals can insert an indication of time for each story/task
• The time is described in points/minutes/hours 7 Add dependencies to user stories/tasks • A user stories or task that is dependent of another
story/task can be linked 8 See dependent user stories/tasks within
the story/task
• For each story/task, dependent stories and/or tasks are visible for all professionals
12 See which professional works on the
user story/task • Stories and tasks can be assigned to one or more professionals
Su bt as k le ve
l 17 See what professional works on the subtask • Subtasks can be assigned to one or more professionals
Ba
ck
lo
g
23 See an indication of time to solve/execute a story or task in the backlog
• For each story/task in the backlog, the assigned time is shown
24 See a hierarchy of importance of user
stories/tasks in the backlog • Professionals can prioritize user stories/tasks in the backlog • The most important stories/tasks are shown at the top of
the backlog Sp ri nt le ve l
31 Add a workflow status to a story/task • Not more than one status can be chosen for a story/task/subtask
33 See the workflow for user stories/tasks
within a sprint overview • All professionals can see the assigned statuses of user stories/ tasks/subtasks within the sprint overview 36 See what professionals are working on
the subtasks within a sprint overview • Professionals that are assigned to a subtasks are visible in the sprint overview 37 See the progress of the sprint • Professionals are able to see the progress of the overall
sprint-status Lo ng te rm p la nn in g
41 See the progress in the long term
planning (developments) •• The active sprint is displayed in the long term planning Completed sprints are displayed in the planning • Professionals can see the sprints related to the near future
42 Distinguish different projects in the long term planning
• Different projects can be displayed • The starting date is shown for each project • The ending date is shown for each project 44 See dependencies in the long term
planning • Professionals can see what sprints are related to not yet finished sprints 45 Add an important date to a project into
the long term planning
• Professionals are able to add an important date like a deadline to a project
Ot
he
rs
55 Work with multiple professionals in the system at the same time •
All professionals can work in the system at the same time • All changes made in the system are carried through so the
system is up to date
57 Track changes made in the system • Recently made changes are traceable
26 mentioned by the participants could be divided into different groups. For example, a
distinction could be made between requirements concerning a user story/tasks and
requirements regarding the long term planning. Consequently, the requirements were divided into six topics; ‘user story and task level’, ‘subtask level’, ‘backlog’, ‘sprint level’, ‘long term planning’, and lastly the topic called ‘others’ referring to more general information that could not be placed into the former five topics.
User story and task level. On user story and task level, certain functionality is required, like adding additional information, giving indication of time, and seeing dependencies. All professionals mention that while adding a user story or task to the PM system, it has to be possible to give a title to the story/task. Starting a project, the
professionals formulate user stories and tasks that have to be executed to realize a finished product. Additional information should be able to be inserted to give some context to the item:“het zou wel mooi zijn als er in ieder geval een basis idee neer zou kunnen zetten” (r2). Two management related professionals expressed that adding information should be done by following mandatory steps, providing more structure. However, another professional
mentioned this could be too demanding, i.e. forcing one to add multiple fields of information. In the end, most of the professionals thought this to be a ‘should have’.
Another feature six of the professionals mentioned they would like to see is giving the item an indication of time for solving or executing it. This provides insight in how long or how difficult a task is expected to be.Also seeing what professional is working on the item, and what dependencies there exist between tasks are must have-features.“Ik denk dat het aller belangrijkste is om de afhankelijkheden tussen en binnen personen goed inzichtelijk te hebben” (r5).
Two requirements expressed to be less important are asking another person via the system to review a task, and adding feedback by the reviewer. Still, four of the professionals considered these must have-requirements.
Subtask level.For the subtask level, the functionality is similar to the features described above concerning user story and task level. However, functionality used on user storytask level is deemed more important, where most requirements on subtask level are said to be ‘should haves’. Only one requirement regarding seeing what professional is working on a subtask presented to be a must-have requirement for the PM system.
27 are prioritized, stating what items are most important at a certain time. Making this priority visible in the backlog makes it easier to state what will be done in the coming sprint: “dat je gelijk weet; oh die dingen moeten heel snel af zijn. En misschien ook wel een soort
hiërarchie, dus wat bovenaan staat sneller af moet zijn” (r1). Also the time estimation is of importance here, for the upcoming sprint should contain not more items or a combined difficulty level than the professionals expect they can execute in the sprint.
One professional mentioned a ticket system could be useful, for newly added items are checked before being added to the backlog. Even though this requirement was mentioned by only one professional, and acquired only one vote to be a must have, the professional mentioning this requirement was the only one representing the discipline.
“Dus nu is het zo dat … maakt 80 taken aan waarvan ik er misschien 30 helemaal niet zo belangrijk vind. Dus die schuif ik dan naar onder, maar eigenlijk wil ik die niet in de backlog want daar gaan we nooit aan toekomen want er komen altijd belangrijkere dingen tussendoor” (r5).
As a side note, the professional mentioned that declined items in this ticket system should not be deleted, but stored in the system with a reasoning for why it is declined for the moment.
Other ‘should have’ requirements relate to organizing the backlog by clustering the items, i.e. on subject or project. Initially, two professionals said it could be a nice feature to see the backlog visually instead of a list. In addition, seeing the dependencies between the items in the backlog could make it easier to plan a sprint. The team now prevents that dependent items are planned together in the same sprint, because this can result in a lot of delay.
Sprint level. Every two weeks a planning is made of what is to be done for the two-weekly period; called a ‘sprint’. Being able to see the overall progress of the sprint as a more detailed sprint overview was initially mentioned by six professionals, and later on deemed a must have for seven of the professionals.
28 As the professional explains in the quote, the sprint overview is an important screen. In this overview, two of the professionals mentioned they wanted to see workflow stages. These give information about the status of each separate task. Examples of workflow stages are ‘to do’, ‘in progress’, ‘to review’, ‘blocked’, ‘done’. Being a ‘must have’ for the one, and a ‘should have’ for the other, this accounts for user stories and tasks as well as the subtasks. Another must have-requirement is to see what professionals are engaged in what tasks. Two professionals initially mentioned this during the interviews.
For the ‘should haves’, the visibility of the indicated time for each task is said to be useful. Also, the last feature professionals pointed out, was to see the consequences when the planning changes. So when an additional task is added to a sprint, what does this mean for the feasibility of the sprint, and what does this do to the next sprint.
Long term planning. Next to the short term planning also a long term planning separate for the different projects would be useful according to all nine professionals. Except for one, all professionals mentioned during the interviews they want to see the duration of a project, and important dates and deadlines accompanied by information about this date. In addition, six of them said to want to see the progress and dependencies within the long term planning.
“Als je alle afhankelijke taken achter elkaar zet, dan kan je een pad tekenen, het afhankelijke pad…”, explained one professional, “…dat wil je eigenlijk inzichtelijk maken, wat dat is dat pad. Welke taken mogen absoluut niet gaan uitlopen want dan gaan we het einde van het project niet op tijd halen” (r3).
Two requirements regarding the long term planning that were deemed less important (‘could haves’) were about displaying what professionals is working on a project, and absences, i.e. vacation. The option to see this long term planning visually is mush preferred.
Others. Two requirements referring to more general functionality were thought to be ‘must haves’: the possibility for multiple professionals to work at the same time in the system, and being able to track all changes made in the system. “Het is heel belangrijk dat iedereen gewoon gelijker tijd aan die website kan rommelen” (r9).
29 could be useful. The professionals at Elitac active in selling the products pointed out that a progress of system versions should be available. They want to see what system version is worked on at the moment and when the deadline for this version is so they know when they can promote and sell it.
Less important functionality was in regards to other programs that are used next to the PM system. There is ‘OneNote’, ‘SharePoint’, ‘Git’, and ‘WeWorked’. For all these
programs almost all professionals communicated the same question, namely; could it be possible to integrate this in the PM system? “Zo’n systeem voor alle documenten zou ook mooi zijn, dus niet alleen voor code maar voor alle documenten” (r2). Still, this requirement was considered a ‘could have’ during prioritizing. Lastly, a phone application of the system was mentioned to be useful. However, only two of the professionals have the application for the current PM system, of which only one uses it frequently.
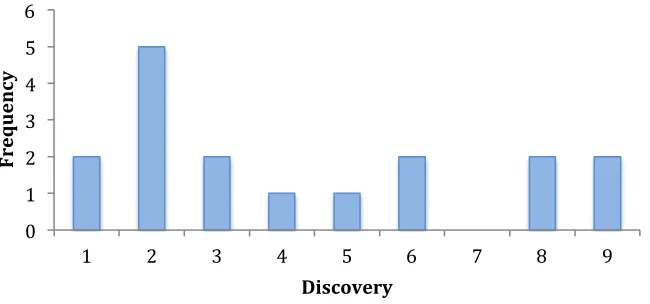
[image:29.595.140.465.485.637.2]For the eighteen must have-requirements a discovery graph was created, stating on the x- axis how often a requirement was discovered over all the interviews and focus group, and the y-axis showing how frequent that was the case in the current study. For example, there were five requirements that were discovered two times over all the interviews and or focus group. The graph is shown in figure 3.
Figure 3. Graph presenting how frequent a requirement was discovered over all the interviews and focus group.
During the interviews, two of the eighteen must have-requirements were voiced by all of the professionals. In contrast two of the requirements were only mentioned by a single
professional, i.e. number 55, “work with multiple professionals in the system at the same 0
1 2 3 4 5 6
1 2 3 4 5 6 7 8 9
Fre
que
n
cy
30 time’. This was later on said to be an absolute must have, however, maybe so obvious to most that it was not thought of by more professionals.
During the interviews, it became salient that certain professionals mentioned the same requirements, seeming to divide the professionals in two groups. For example, requirements #31, #32, #33, and #34 were often named together by participants r2, r3, r4, r6 and r9. Other professionals (r5, r7, r8) mentioned requirements like #23, #48, #51 This difference could indicate there are different groups (roles). We’ll get back to this in the discussion.
3.1.3 System content
When working with a PM system, one can add information to the system by adding text in fields or uploading documents. The professionals were asked what content they would want to use in the PM system. The results are described in this section, and later on the content was translated into 30 labels. These are summarized and alphabetically ordered in an ontology, accompanied by a description for each item separately (included in appendix G).
All professionals said that an added user story or task would be incomplete with only a title available. Adding some context, for example the goal and/or acceptance criteria could help in making a user story or task better understandable. Moreover, because the time between adding a user story or task and picking it up to execute varies a quit deal. As a professionals describes, some of the user stories/tasks without context will not be executed because no one remembers what the story/task was about: “dan vraag ik nog eens een keer van; joh waar gaat het eigenlijk over? En een deel weet al niemand meer waar het over gaat” (r9). Information is needed about why the item is added. So the reason/goal of the items is preferred. “Een background moet ik wel terug kunnen vinden of in ieder geval een link ernaartoe. Wat er precies moet gebeuren, waarom” (r3).
Additional information expressed by four professionals during the interviews was information concerning the client and target group, personas and/or user journeys. Two other professionals talked about some indication of what makes that a story or task is completed, like acceptance criteria, to be available at a story or task.
For some user stories and tasks research has to be conducted by the professionals, meaning they have to look into literature or test at what temperature the hardware is
31 professionals, all want to know in short what methodology was used and what the concluding results were.“Ik wil helemaal niet de hele achtergrond weten, ik wil weten wat daar uit komt” (r8).Two professionals suggest that when one wants to look into the research in more detail, i.e. the whole methodology, he or she can go to the document in OneNote.
Next to this content, the development professionals talked about needing information in the PM system about the software, hardware, casing, and textile to be available in the PM system. For each of the disciplines, the constraints are required to be added to a user story or task. “Ik moet hun randvoorwaarden weten en zij moeten mijn randvoorwaarden weten, zodat we weten wat wel kan en wat niet kan” (r4).Measurements/size of the hardware is
documented here also. For the software development, two professionals mentioned they wanted to know the Git flow ID accompanying the story/task. Like said earlier, Git is a version control system that helps a software team manage changes to source code over time. Because different versions and branches are created, the ID is useful to know in which file one worked. Other content for in the PM system is related to log data, bug reports, and looking from the graphical interface designer point of view, there are logos, icons, and images needed for making concepts.
It can be concluded that professionals need certain information to help in
comprehending and making executing a user story or task more effective and efficient. Like said before, the time between adding a story or a tasks and executing it can vary. In the current situation, incomplete information sometimes results in a lack of understanding what was meant, and deleting the item altogether.
3.2 Part 2 Card Sorting
The content information elicited during the interviews and focus group gave rise to 30 content labels. These were summarized in the ontology and used during nine card sorting sessions. Uncovering the average mental model of the professionals provided for making a navigation structure. This could be used for structuring the content in the chosen PM system. The average mental model of the system content is presented in this section.
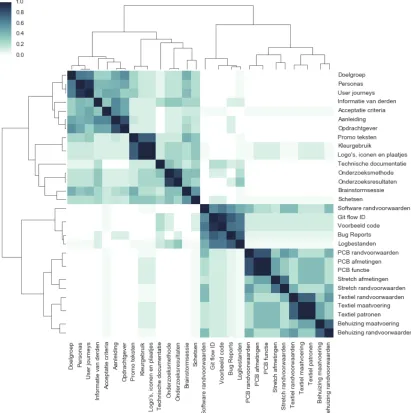
Figure 4 shows the resulting mental model similarity matrix as a heatmap. As
32 Figure 4. Mental model heatmap of the 30 content labels that will be used throughout the PM system.
the correlation distance between the items. Several groups become visible in the diagonal of the model. Two halves are visible, dividing the content into items concerning the information that is needed before developing the product, and more product developing related items. For the top half, the item ‘promo teksten’ was commonly grouped together with items such as ‘kleurgebruik’ and ‘logo’s iconen en plaatjes’. As were the items ‘doelgroep’, ‘personas’ and ‘user journeys’. According to the mental model, ‘doelgroep’, ‘personas’ and ‘user journeys’ should be put into a group with ‘informatie van derden’, ‘acceptatie criteria’, ‘aanleiding’ and ‘opdrachtgever’. In the lower half of the model for example, one can see five groups
regarding ‘behuizing’, ‘textiel’, ‘stretch’, ‘PCB’, and ‘software. However, the prior four could be placed in a higher-level-group stating ‘hardware’ related items.
33 software related subjects like ‘GIT flow ID’, but also with ‘PCB randvoorwaarden’ and ‘textiel randvoorwaarden’. As for the interviews, this difference in grouping during the card sorting, seemed to divide the participants into two groups, in particular in the lower half of the model. Participants r1, r2, r3, r4, r6, and r9 all grouped the cards together addressing the same discipline; ‘textiel randvoorwaarden’, ‘textiel maatvoering’, and ‘textiel patronen’. The same for all the ‘PCB’-labels, ‘behuizing’-labels, and software-related labels. However, participants r5, r7, and r8 grouped the ‘randvoorwaarden’ together, separate from the other content; ‘software randvoorwaarden’, ‘PCB randvoorwaarden’, ‘textiel randvoorwaarden’, and ‘behuizing randvoorwaarden’. This difference will be addressed in the discussion.
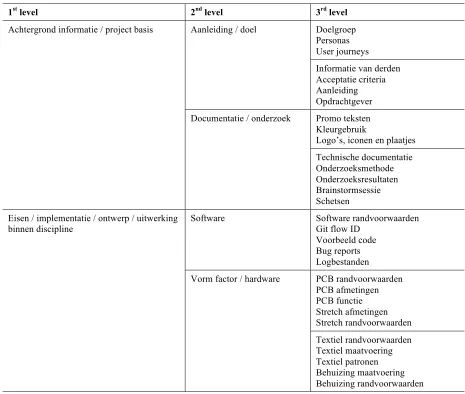
[image:33.595.64.529.346.740.2]Roughly, the content can be clustered in three levels, resulting in a navigation structure presented in table 4. While performing the card sorting, professionals could group
Table 4. Navigation structure based on the heatmap
1st level 2nd level 3rd level
Achtergrond informatie / project basis Aanleiding / doel Doelgroep Personas User journeys Informatie van derden Acceptatie criteria Aanleiding Opdrachtgever Documentatie / onderzoek Promo teksten
Kleurgebruik
Logo’s, iconen en plaatjes Technische documentatie Onderzoeksmethode Onderzoeksresultaten Brainstormsessie Schetsen Eisen / implementatie / ontwerp / uitwerking
binnen discipline Software Software randvoorwaarden Git flow ID Voorbeeld code
Bug reports Logbestanden
34 the cards hierarchically. This resulted in clustered groups, which they were asked to give a name to. Labels mentioned by the professionals to describe the different clusters ranged from very specific, detailed labels to labels for higher-level, clustered groups. For the above half in the heatmap, items were clustered using label names like ‘aanleiding’, ‘doel’, ‘achtergrond informatie’, ‘documentatie’, ‘onderzoek’, and ‘project basis’. For the lower half of the model, professionals gave more higher-level related clusters names like i.e. ‘eisen’, ‘implementatie’, ‘ontwerp’ and ‘uitwerking binnen discipline’. More detailed labels level entailed ‘software’, and ‘vorm factor’ or ‘hardware’. This information gave rise to the labels for the three levels in the navigation structure. Based on the average mental model, table 4 above proposes a navigation structure that could be used in a PM system.
3.3 Part 3 System Evaluation and Comparison
The 62 requirements together with the formulated acceptance criteria made a checklist that was used to evaluate both PM systems Jira and Taiga. Both checklists can be found in appendix H and I. This section presents the results of the evaluation.
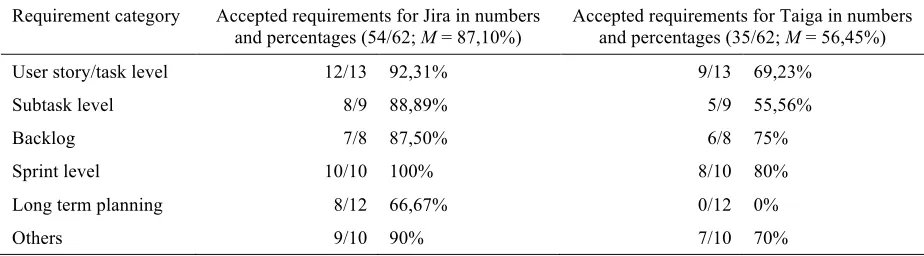
[image:34.595.66.528.510.638.2]Table 5 shows the difference in the number of requirements that could meet the acceptance criteria for both PM systems Jira and Taiga. Overall, Jira fulfills 87,10% of all the 62 professionals’ wishes regarding a PM system, where Taiga could fulfill 56,45%.
Table 5.
The numbers and percentages of accepted requirements for both PM systems Jira and Taiga.
Requirement category Accepted requirements for Jira in numbers
and percentages (54/62; M = 87,10%) Accepted requirements for Taiga in numbers and percentages (35/62; M = 56,45%) User story/task level 12/13 92,31% 9/13 69,23%
Subtask level 8/9 88,89% 5/9 55,56%
Backlog 7/8 87,50% 6/8 75%
Sprint level 10/10 100% 8/10 80%
Long term planning 8/12 66,67% 0/12 0%
Others 9/10 90% 7/10 70%
Jira scored higher on all categories. For both Jira and Taiga, the highest percentages of requirements that were met by the PM system was at sprint level. The lowest scores were with 66,67% on the long term planning in Jira, and 0% in Taiga.
35 Figure 5. Graph illustrating the numbers and percentages of accepted requirements divided for ‘must’, ‘should’, and ‘could haves’ for both PM systems Jira and Taiga.
Looking at how many of the more important requirements could be fulfilled by the system, Jira could execute 17 out of the 18 ‘must haves’, where Taiga could fulfill 11 of them. As for the must have-requirements, also more of the ‘should’ and ‘could haves’ could be met by the PM system Jira compared to Taiga.
Regarding the content, the system was checked by looking into the possibility to add multiple fields of information, giving different headings, providing a description to these fields, and changing the order of these fields. For both systems, multiple fields could be added,
36
4.
Discussion
This research was conducted to evaluate the PM systems Jira and Taiga for the company Elitac, by deriving the users’ wishes regarding a PM system. This gave rise to the research question: “How should a Project Management System be designed for Elitac to achieve an efficient workflow?” During the first part of the study, conducting nine interviews and a focus group, 62 user needs were found. The requirements were prioritized using the MoSCoW technique. Card sorting tests were conducted to uncover what navigation structure Elitac would want to use throughout the PM system. Both PM systems Jira and Taiga were reflected on using all requirements to evaluate the systems, taking into account that the must have-requirements were more important than the ‘should’ and ‘could haves’. The results pointed out that the PM system Jira could execute more user requirements in comparison to Taiga, indicating that Jira would be a better fit for Elitac. The results are reflected below. After, possible recommendations are presented concerning the PM systems. And lastly, limitations are discussed, and recommendations for future research are presented.
4.1 Reflection results
In concordance with the definition given by Castillo (2016a), Collyer et al. (2010), and Hoda and Murugesan (2016), Elitac works with the most popular agile method, the scrum method. They start with a high-level framework plan, while details become more explicit during the development process. As professionals during the current study expressed, the team wants to add new user stories/tasks to the PM systems’ backlog and prioritize these. Based on that information, a sprint is created, freezing the design features for the coming two weeks. Therefor Elitac needs a PM system in which the agile approach, moreover the scrum method, is supported. Both of the PM systems could support this, however, some differences in functionality remained.
37 user story and task level, on subtask level and in the backlog, but in all those cases, this wish was claimed to be a must or should have. Looking at the Kano model, which captures the relationship between product performance and customer satisfaction, the must-be attribute similar to the must-have requirement has to be fulfilled (Matzler & Hinterhuber, 1998). According to this model, if the must-be attributes are not fulfilled, the customer will be extremely dissatisfied. So this is a mayor drawback for Taiga. And as a consequence, the wish to see what happens to related tasks on sprint level when the planning changes can also not be met. This could be a big issue for Elitac, because they would like to start using a PM system with different disciplines, and this could result in a lot of dependencies between tasks. Not only are hardware and software dependent of each other, but there are also dependencies between the different hardware components. As said before, this could not be supported by Taiga, but the developers of Taiga claim this is an issue they are going to tackle in the future (GitHub, 2017). If this changes in the (near) future, and thus meet these requirements, this could make Taiga a more attractive option than it is now when looking at the amount and importance of requirements the system could fulfill.
38 provides. Moreover, also professionals engaged in developing mentioned they would like to have an overview of the long term planning, which would contradict that this is a feature only the management and sales related professionals would want this feature. So the fact that Taiga does not support this, while Jira does, is a big disadvantage.
As described, the results in this study showed that Jira could support more
requirements concerning the PM system for Elitac than Taiga could. However, what has to be taken into account is that five of the professionals are already working with Jira and thus used to this system. For Elitac to choose this system, an issue could be that this experience can blind users, preventing them from recognizing possibilities for new functions (Carroll & Rosson, 1987). However, if Elitac would go for another PM system, this could result in loss aversion. This explains that the perceived loss is greater then the gain associated with receiving it (Tversky & Kahneman, 1991). And as Novemsky and Kahneman (2005)
mention, a choice is often made looking at the changes relative to a reference point. So if the other PM system misses functionality that Jira provides, this could displease the professionals acquainted with Jira. Still, this would be the case for the five professionals already using a PM system, where the other four professionals have never worked with such system.
Next to the discovered needs and wishes regarding the PM system, there is a requirement that was not taken into account while comparing the systems; the pricing of a PM system. Where Taiga is for free, Jira brings costs to the table. Depending on how important this requirement is this could be a game-changer for Elitac. Especially because even though Jira fulfills more of the users’ wishes, there are other ways to incorporate more user requirements. For example, the long term planning could be covered using a separate program to manage this planning. However, as said before, the downside is that these two programs will not be integrated, thus making changes in the PM system that affects the planning requires alterations in both programs. So it could be that choosing for Taigamakes it harder to manage projects because certain requirements could not be met, and it could be more time consuming for having to do double work. Thus, a balance will have to be struck between the ease of use that having one integrated program brings, against a cheaper solution that would require an additional program.
39 developers and the other more management and sales related professionals.While evaluating both PM systems, this difference was not taken into account. This could result in a list with wishes that entails functionality often not used in a PM system.Still, Jira could support a lot of requirements, maybe because it has a lot of plugins available (meaning extra features that can be installed to the basic program, such as a calendar). Making that it is possible to integrate functionality into the systems is an advantage, for it could be that there are also plugins for features the professionals want to have in the future, or are currently not aware of they want or need. Because the needs and wishes of users are inclined to change over time, it would be a big advantage to have plugins available that can adept to these new needs. These features are according to the Kano model the most important in influencing how satisfied the user will be (Matzler & Hinterhuber, 1998).
4.2 Implications for practice
After reflecting on the results for the PM systems Jira and Taiga, three possible recommendations regarding the choice of PM system are explained in this section.
Staying with Jira
One of the recommendations could be to stay with the currently used PM system Jira. As said before, the results showed that of the 62 requirements, 54 could be executed in Jira. In
addition, except for one, Jira could meet all of the most important requirements. The only one that could not be met is for the professionals to see dependencies within the long term
planning. This makes information in the long term planning less complete. However, one can see which user stories/tasks are blocked in the backlog. And when for example a blocked requirement is dragged into the new two-week planning, the system will show that it is blocked. Nonetheless, the lack of this feature makes it harder to keep an overview of the long term planning.
Something else to take into account for Elitac if they chose to stay with Jira, is that still four of the professionals have to learn how to use the PM system. And because the system has a big variety in features and settings, and is less intuitive, this can overwhelm professionals that have never worked with a PM system before.