A Thesis Submitted for the Degree of PhD at the University of Warwick
http://go.warwick.ac.uk/wrap/3779
This thesis is made available online and is protected by original copyright. Please scroll down to view the document itself.
Functionalisation of Surfaces and Interfaces:
Molecules, Particles and Crystals
By
Massimo Peruffo
A Thesis submitted for the degree of
Doctor of Philosophy
Department of Chemistry
University of Warwick
Contents
Contents iii
List of Figures ix
List of Tables xvii
Acknowledgements xix
Declaration xx
Abstract xxi
Abbreviations xxiii
Glossary of Symbols xxiv
CHAPTER 1 INTRODUCTION 1
1.1 A BROAD OVERVIEW OF SURFACE SCIENCE 1
1.2 SELF-ASSEMBLED MONOLAYERS 3
1.2.1 SAM FORMATION AND CHARACTERISTICS 4
1.2.1.1 Adsorption Process 5
1.2.1.2 Monolayer Organisation 7
1.2.1.3 Defects 9
1.2.1.4 Solvent 10
1.2.2 ELECTROCHEMISTRY OF A CONFINED REDOX SPECIES ON A SURFACE 10
1.3 METAL NANOPARTICLES 16
1.3.1 SYNTHESIS 17
1.3.1.1 Colloidal Synthesis 17
1.3.1.2 Surface Synthesis 19
1.4 CRYSTALS 20
1.4.1 CRYSTAL NUCLEATION AND GROWTH 21
1.4.1.1 Nucleation Phase 23
1.4.1.2 Growth Phase 26
1.4.2 POLYMORPHISM 28
1.4.3 ADDITIVES 29
1.5 AIMS OF THIS THESIS 30
1.6 BIBLIOGRAPHY 32
CHAPTER 2 EXPERIMENTAL 44
2.1 CHEMICALS 44
2.2 GENERAL MATERIALS 46
2.3 GENERAL INSTRUMENTATION 46
2.4 ELECTROCHEMICAL INSTRUMENTATION 48
2.4.1 CLEANING PROCEDURE FOR PLATINUM MICRO AND MACRO ELECTRODES 48 2.5 FLOW SYSTEM FOR INVESTIGATION OF CALCIUM CARBONATE DEPOSITION 49
2.5.1 DELIVERY AND MIXING SYSTEM 50
2.5.2 FLOW CELLS 52
2.5.3 DEPOSITION PROCEDURE 53
2.5.4 TECHNICAL DRAWINGS 54
2.5.5 SPECIATION MODEL 58
2.6 BIBLIOGRAPHY 63
CHAPTER 3 ELECTRODE FUNCTIONALISATION VIA REDOX-ACTIVE SELF-
ASSEMBLED MONOLAYERS 64
3.1 INTRODUCTION 64
3.1.1.2 Droplet Setup 69
3.2 RESULTS AND DISCUSSION 70
3.2.1 SELF-‐ASSEMBLED MONOLAYER ASSESSMENT 70 3.3 METAL COMPLEXES: CHARACTERIZATION IN SOLUTION 73
3.3.1 OSMIUM METAL COMPLEX 74
3.3.1.1 Reversibility 74
3.3.1.2 Diffusion Coefficient Measurement 75
3.3.2 RUTHENIUM METAL COMPLEX 76
3.3.2.1 Reversibility 76
3.3.2.2 Diffusion Coefficient Measurement 77
3.3.3 POTENTIAL ASSISTED DEPOSITION 78 3.3.3.1 SAM Deposition Procedure 78
3.3.3.2 Photophysical Properties of Solutions and Monolayers. 78
3.3.3.3 Electrochemical Characterisation of Self-‐assembled Monolayers 80 3.4 CHARACTERISATION OF SAMS IN IONIC LIQUID MEDIUM 83
3.5 CONCLUSIONS 86
3.6 BIBLIOGRAPHY 87
CHAPTER 4 DECORATION OF CONDUCTIVE SUBSTRATE WITH
ELECTROACTIVE METAL NANOPARTICLES A: PALLADIUM NANOPARTICLES
ULTRA-THIN NAFION FILM 89
4.1 INTRODUCTION 90
4.2 EXPERIMENTAL 90
4.2.1 NAFION ULTRA-‐THIN FILM DEPOSITION 91 4.2.2 PALLADIUM NANOPARTICLES INCORPORATION 94
4.2.3 MORPHOLOGY IMAGING 94
4.2.5 SCANNING ELECTROCHEMICAL MICROSCOPY (SECM) SETUP 96
4.3 RESULTS AND DISCUSSION 98
4.3.1 NAFION FILM THICKNESS EFFECT 98 4.3.2 CYCLIC VOLTAMMETRY INVESTIGATIONS 100 4.3.3 SCANNING ELECTROCHEMICAL MICROSCOPY STUDIES 102
4.3.4 IMPROVEMENT OF ELECTROACTIVITY BY POTENTIAL PRECONDITIONING 104
4.4 CONCLUSIONS 105
4.5 BIBLIOGRAPHY 106
CHAPTER 5 DECORATION OF CONDUCTIVE SUBSTRATE WITH ELECTROACTIVE METAL NANOPARTICLES B: ELECTRODE
FUNCTIONALISATION BY POTENTIAL-ASSISTED ASSEMBLY OF PLATINUM
NANOPARTICLES 109
5.1 INTRODUCTION 110
5.2 EXPERIMENTAL 111
5.2.1 SYNTHESIS OF PERTHIOLATED Β-‐CD-‐CAPPED PLATINUM NANOPARTICLES 111
5.2.2 POTENTIAL-‐ASSISTED DEPOSITION 113
5.3 RESULTS AND DISCUSSION 114
5.3.1 PLATINUM NANOPARTICLES DEPOSITION 114
5.3.2 OXYGEN REDUCTION EVALUATION 119 5.3.3 HYDROGEN REDUCTION AND EVOLUTION ACTIVITY 122
5.4 CONCLUSIONS 122
5.5 BIBLIOGRAPHY 124
CHAPTER 6 NUCLEATION AND GROWTH OF CALCIUM CARBONATE ON FOREIGN SUBSTRATES AT HIGH-SUPERSATURATION 127
6.2.1 SOLUTION PREPARATION 132 6.2.2 TIME-‐LAPSE IN–SITU GROWTH EXPERIMENTS 134
6.2.2.1 ACC-‐Calcite Transformation Process 141
6.2.2.2 Micro-‐Raman Characterisation of Surface Deposits 143
6.2.3 QCM-‐FLOW CELL EXPERIMENTS 144
6.2.4 SIMULATION MODEL 146
6.3 CONCLUSIONS 150
6.4 BIBLIOGRAPHY 151
CHAPTER 7 INFLUENCE OF CITRATE ON THE DEPOSITION OF CALCIUM
CARBONATE ON FOREIGN SURFACES 154
7.1 INTRODUCTION 155
7.2 EXPERIMENTAL 157
7.2.1 SOLUTION PREPARATION 157
7.3 RESULTS AND DISCUSSION 159
7.3.1 QCM INVESTIGATIONS 159
7.3.2 IN–SITU MICROSCOPY 162 7.3.3 MICRO-‐RAMAN SPECTROSCOPY 164
7.4 CONCLUSIONS 166
7.5 BIBLIOGRAPHY 167
CHAPTER 8 EFFECT OF COMMERCIALLY RELEVANT INHIBITORS ON THE DEPOSITION OF CALCIUM CARBONATE ON GOLD SURFACES 170
8.1 INTRODUCTION 171
8.1.1 NUCLEATION AND GROWTH IN THE PRESENCE OF INHIBITORS 172
8.1.1.1 Molecular Additives 172
8.1.1.2 Polymeric Additives 173
8.2 EXPERIMENTAL 176
8.2.1 ADDITIVES 176
8.3 RESULTS AND DISCUSSION 178
8.3.1 POLYMERIC ADDITIVES 180
8.3.2 MOLECULAR ADDITIVES 182
8.3.2.1 Dissolvine GL-‐38 183
8.3.2.2 Trilon M Powder 185
8.3.2.3 Purac 88-‐T 187
8.3.3 SYNERGISTIC EFFECTS 188
8.4 CONCLUSION 191
8.5 BIBLIOGRAPHY 192
CHAPTER 9 CONCLUSIONS 195
List of Figures
Figure 1-‐1. Interfacial science time line [1].______________________________________________________ 2
Figure 1-‐2. SAM molecule description____________________________________________________________ 5
Figure 1-‐3. SAM adsorption process steps _______________________________________________________ 6
Figure 1-‐4. Molecule orientation on a SAM. ______________________________________________________ 8
Figure 1-‐5. SAM defects description. _____________________________________________________________ 9
Figure 1-‐6. Helmholtz double layers (a), Potential gradient without (a) and with (c) the
presence of an organic film._________________________________________________________ 11
Figure 1-‐7. Simulation of CVs using Butler–Volmer formalism, (solid line) different scan rate
with constant rate constant, (dashed line) same scan rate but smaller rate
constant k0. ___________________________________________________________________________ 14
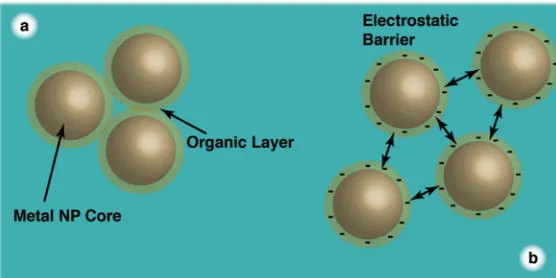
Figure 1-‐8. Steric (a) and electrostatic (b) stabilisation against aggregation.________________ 18
Figure 1-‐9. Electro deposition of nanoparticles and diffusion field. __________________________ 19
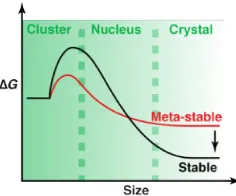
Figure 1-‐10. (a) Gibbs free energy variation with radius; total (∆G), along with surface (∆GS)
and bulk (∆GC) contribution. (b) Variation of free energy at different
supersaturation values. _____________________________________________________________ 23
Figure 1-‐11. Description of CNT nucleation process (black arrows) and two-‐step process
(red arrows). _________________________________________________________________________ 25
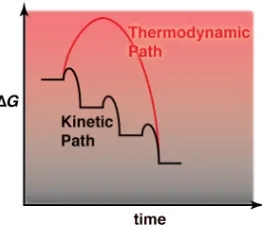
Figure 1-‐12. Free energy path for two polymorphs.____________________________________________ 26
Figure 1-‐13. Growth process. ____________________________________________________________________ 26
Figure 1-‐14. Spiral growth description, (reproduced from reference[137]). ________________ 27
Figure 1-‐15. Two dimensional nucleation. ______________________________________________________ 28
Figure 1-‐16. Thermodynamic vs kinetic path during crystallisation. _________________________ 29
Figure 2-‐1. Electrocleaning CVs of Pt-‐UME, 25 µm diameter, in H2SO4 (0.1 M) solution.____ 49
Figure 2-‐2. Schematic of the delivery system built in house. __________________________________ 50
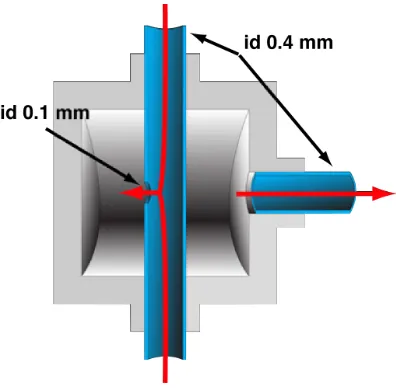
Figure 2-‐3. T-‐mixer schematic.___________________________________________________________________ 51
Figure 2-‐5. T-‐mixer lid, measures in mm. _______________________________________________________ 54
Figure 2-‐6. T-‐mixer body, measures in mm. ____________________________________________________ 54
Figure 2-‐7. QCM-‐flow cell lid, measures in mm. ________________________________________________ 55
Figure 2-‐8. QCM-‐flow cell body, measures in mm.______________________________________________ 55
Figure 2-‐9. QCM-‐flow cell bottom, measures in mm. ___________________________________________ 56
Figure 2-‐10. Microscope flow cell lid, measures in mm. _______________________________________ 56
Figure 2-‐11. Microscope flow cell body, measures in mm._____________________________________ 57
Figure 2-‐12. Microscope flow cell bottom, measures in mm. __________________________________ 57
Figure 3-‐1. Non-‐covalent molecular wire._______________________________________________________ 66
Figure 3-‐2. Cyclodextrin-‐Phenyl Host-‐Guest system.___________________________________________ 66
Figure 3-‐3. Droplet set up.________________________________________________________________________ 69
Figure 3-‐4. a) Cyclic-‐voltammograms at different scan rates (top to bottom 50, 20, 10, 5 and
1 V s-‐1) of [(biph-‐tpy)Ru(tpy-‐thioctic)](PF6)2, 0.5 mM, in CH3CN and 0.1 M
tBAPF6. b) shows the dependence of current peaks (after background
subtraction) on scan rate. ___________________________________________________________ 71
Figure 3-‐5. a) Cyclic-‐voltammograms at different scan rates (top to bottom 50, 30, 25, 20,
15, 10, 5 and 1 V s-‐1) of [(biph-‐tpy)Os(tpy-‐SAc)](NO3)2, 1 mM, in CH3CN and
0.1 M tBAPF6. b) shows the dependence of current peaks (after background
subtraction) on scan rate. ___________________________________________________________ 72
Figure 3-‐6. a) Cyclic-‐voltammograms at different scan rates (top to bottom 50, 25, 20, 10, 5
and 1 V s-‐1) of [(CD-‐tpy)Os(tpy-‐SAc)](PF6)3, 2 mM, in CH3CN:H2O / 90:10 and
0.1 M tBAPF6. ________________________________________________________________________ 72
Figure 3-‐7. Cyclic-‐voltammograms at different scan rates of [(biph-‐tpy)Os(tpy-‐SAc)](NO3)2],
0.5 mM, in MeCN (90%v/v) H2O (10%v/v) and 0.1 M tBAPF6. __________________ 74
Figure 3-‐8. Cyclic-‐voltammogram at 5 mV s-‐1 of [O(biph-‐tpy)Os(tpy-‐SAc)](NO3)2] 0.5 mM
and 0.1 M tBAPF6 in MeCN (90%v/v) H2O (10%v/v). _______________________________ 75
Figure 3-‐9. Cyclic-‐voltammograms at different scan rates of [(biph-‐tpy)Ru(tpy-‐
thioctic)](PF6)2, 1.3 mM, in MeCN and 0.1 M tBAPF6. ____________________________ 76
Figure 3-‐11. Luminescence spectra of [(biph-‐tpy)Ru(tpy-‐thioctic)](PF6)2 acetonitrile
solution, powder and monolayers on Pt, λexc =480 nm.___________________________ 79
Figure 3-‐12. Time dependence of surface coverage of [(biph-‐tpy)Ru(tpy-‐thioctic)](PF6)2
adsorbed on platinum microelectrode: (☐) potential-‐assisted deposition
(0.5 mM in CH3CN (0.1 M tBAPF6), (○) 1.2 mM in CH3CN (0.1 tBAPF6)
conventional deposition. Solid line fits for kinetic Langmuir equation. _________ 80
Figure 3-‐13. a) Cyclic voltammograms of [(biph-‐tpy)Ru(tpy-‐thioctic)](PF6)2 self-‐assembled
monolayer in acetonitrile (0.1 M tBAPF6 electrolyte), prepared using the
sweeping potential procedure. From top to _______________________________________ 81
Figure 3-‐14. Cyclic voltammograms (200 V s-‐1) of [(biph-‐tpy)Ru(tpy-‐thioctic)](PF6)2 self-‐
assembled monolayer in acetonitrile (0.1 M tBAPF6 electrolyte), prepared using
the sweeping potential procedure at different deposition time. Top 1240 s;
bottom 680 s._________________________________________________________________________ 82
Figure 3-‐15 a) Cyclic voltammograms for an adsorbed monolayer of [(biph-‐tpy)Ru(tpy-‐
thioctic)](PF6)2 in BMI. Scan rates from 1 V s-‐1 to 100 V s-‐1. b) Current peaks
(anodic and cathodic) c) peak separation vs scan rate.___________________________ 84
Figure 3-‐16 a) Cyclic voltammograms for an adsorbed monolayer of [(biph-‐tpy)Os(tpy-‐
SAc)](PF6)2 in BMI. Scan rates from 1 V s-‐1 to 175 V s-‐1. b) Current peaks (anodic
and cathodic) c) peak separation vs scan rate. ____________________________________ 85
Figure 4-‐1. Nafion molecular structure. _________________________________________________________ 91
Figure 4-‐2. Langmuir trough._____________________________________________________________________ 92
Figure 4-‐3. Isotherm of a Nafion monolayer on NaNO3 0.1 M water solution subphase. ____ 92
Figure 4-‐4. LS technique schematic. _____________________________________________________________ 93
Figure 4-‐5. Thickness layer. ______________________________________________________________________ 93
Figure 4-‐6. Schematic of the fabrication of palladium nanoparticles within a Nafion LS films.
________________________________________________________________________________________ 94
Figure 4-‐7. TEM image of palladium nanoparticles in a 20 layer Nafion LS film. ____________ 95
Figure 4-‐8. TM-‐AFM topography images of a 10 layer Nafion LS film before (a) and after (b)
formation of Pd nanoparticles. The lateral scale of the images is 1 μm x 1 μm._ 95
Figure 4-‐10. SECM setup. _________________________________________________________________________ 97
Figure 4-‐11. Au/Hg UME. _________________________________________________________________________ 98
Figure 4-‐12. (a) CVs of a 10, 20, 30, 40, 60 layer Pd/Nafion LS film in 0.1 M KNO3, pH 3
(HNO3), scan rate 50 mV s-‐1. (b) Pd oxide reduction charge vs numbers of Nafion
layers deposited. _____________________________________________________________________ 99
Figure 4-‐13. CVs of a 40 layer Pd/Nafion LS film before (red line) and after saturation with
H2 (blue line) in 0.1 M KNO3 supporting electrolyte, scan rate 20 mV s-‐1. The
black line shows a CV of a 40 layer Nafion LS film on ITO after saturation of the
solution with H2. ___________________________________________________________________ 101
Figure 4-‐14. SCEM schematic for hydrogen evolution promoted by Pd nanoparticles. ___ 103
Figure 4-‐15. Normalized experimental approach curves for the reduction of MV2+ at of a
Au/Hg UME at different pH approaching an ultra-‐thin Nafion LS film
incorporated Pd NPs. ______________________________________________________________ 103
Figure 4-‐16. (a) LSV of a 40-‐layer Pd/Nafion LS film, supporting electrolyte 0.1 M KNO3,
scan rate 100 mV s-‐1, after saturation with H2: without preconditioning (red
line) and with preconditioning at 0.5, 0.7, 0.8, 0.9, 1.1 and 1.2 V for 30 s (solid
line). (b) LSV peak current magnitude, Ip, vs preconditioning potential.______ 105
Figure 5-‐1. Perthiolated-‐b-‐cyclodextrins structure.__________________________________________ 112
Figure 5-‐2. (a) HR-‐TEM images of PtCD NPs, (b) IR spectra of Perthiolated-‐β-‐cyclodextrin
(black line) and PtCD NPs (red line). _____________________________________________ 113
Figure 5-‐3. Teflon sheath cell electrochemical set up. _______________________________________ 114
Figure 5-‐4. CVs (100 cycles) of β-‐CD-‐capped Pt nanoparticles on an ITO electrode substrate
from 0.1 M KCl supporting electrolyte (scan from +1 V to -‐0.8 V); scan rate 0.1 V
s-‐1. ___________________________________________________________________________________ 115
Figure 5-‐5. Pt nanoparticle number vs time (lower x-‐axis) and vs number of voltammetric
scans (upper x-‐axis)._______________________________________________________________ 116
Figure 5-‐6. AFM topography images (1 x 1 μm) Pt nanoparticles deposited on HOPG by
potential-‐assistance (a) and without (b). The profiles correspond to the black
Figure 5-‐7. CVs of PtCD NPs deposited on an ITO electrode for 60 minutes by the potential-‐
assisted method (black line). For 100 cycles, and without (red line); 0.1 M KNO3
solution scan rate 0.5 V s-‐1. (a) degassing with N2 and (b) without degassing the
electrolyte solution. _______________________________________________________________ 118
Figure 5-‐8. Overlapping hemispherical diffusion. ____________________________________________ 120
Figure 5-‐9. (a) CA voltammogram of Pt NPs functionalized ITO in buffered solution (pH 7,
Table 2-‐2) and (b) Cottrell plot. __________________________________________________ 121
Figure 5-‐10. CV (0.1 V s-‐1) of PtCD NPs functionalised ITO electrode in 0.1 M KNO3 solution
acidified to pH 3 with HNO3. ______________________________________________________ 122
Figure 6-‐1. Crystallographic unit cell of (a) calcite, (b) aragonite and (c) vaterite. ________ 129
Figure 6-‐2. SEM images of calcium carbonate: (a) vaterite on bronze; (b) vaterite on
stainless steel; (c) vaterite, calcite and aragonite on gold; (d) calcite and vaterite
on vitreous carbon; (e) vaterite, calcite and aragonite on gold. Aragonite crystals
are specified indicated with arrows (reproduced from reference [17]).______ 130
Figure 6-‐3. Time-‐lapse picture recorded with the in–situ microscopy set up at 50 s. ‘a’ initial
heterogeneous nucleation of calcite. _____________________________________________ 134
Figure 6-‐4. Time-‐lapse picture recorded with the in–situ microscopy set up at 225 s. ‘a’
calcite growth, ‘x’ highlights a region where some ACC subsequently lands (see
Figure 6-‐5). _________________________________________________________________________ 135
Figure 6-‐5. Time-‐lapse picture recorded with the in–situ microscopy set up at 500 s. ‘b’
phase change nucleation, ‘x’ landing of a ACC flock. ____________________________ 136
Figure 6-‐6. Time-‐lapse picture recorded with the in–situ microscopy set up at 600 s. ‘a, c’
ACC depletion, ‘b’ phase change nucleation. _____________________________________ 137
Figure 6-‐7. Time-‐lapse picture recorded with the in–situ microscopy set up at 990 s. ‘a, c’
ACC depletion, ‘b’ phase change nucleation. _____________________________________ 138
Figure 6-‐8. Representation of a unit cell of a calcite crystal with an isotropic growth along
the {104} planes. In the unit cell only the calcium atoms are reported. _______ 139
Figure 6-‐9. Mole intake per crystal with time. ________________________________________________ 141
Figure 6-‐10. Time-‐lapse pictures recorded with the in–situ microscopy set up. ACC
Figure 6-‐11. Time-‐lapse pictures recorded with the in–situ microscopy set up, ACC
dissolution process in presence of overlap of diffusion field for two closely
spaced growing calcite crystals. __________________________________________________ 142
Figure 6-‐12. Feed process representation. ____________________________________________________ 143
Figure 6-‐13. Micro-‐Raman spectrum with the laser beam focused on a calcite crystal on
glass substrate after deposition within the optical cell. ________________________ 143
Figure 6-‐14. Deposition of calcium carbonate, using the QCM flow cell set up, as function of
time. The red dashed line shows the behaviour for a constant flux. ___________ 144
Figure 6-‐15. FE-‐SEM images of the QCM crystal after deposition. The images were taken
underneath the nozzle outlet (a) and at the edge of the gold coated surface (b).
(c) Vaterite crystal. ________________________________________________________________ 145
Figure 6-‐16. (a) Cell geometry and (b) velocity profile related to area within the black solid
line.__________________________________________________________________________________ 147
Figure 6-‐17. (a) Concentration distribution (in the region highlighted in Figure 6-‐16a) and
(b) flux profile of the limiting species at the surface of the QCM probe._______ 148
Figure 7-‐1. Chronogravimetric curves of delivered solution containing 0.5 ‘a’, 1, ‘b’ 1.75 ‘c’,
2.5 ‘d’ and 3.5 mM ‘e’ of CIT; ‘f’ control experiment without CIT. ______________ 160
Figure 7-‐2: FE-‐SEM images (scale bar 200 µm) of QCM crystals after deposition for 800 s
with different concentration of CIT. ______________________________________________ 161
Figure 7-‐3. FE-‐SEM images of QCM crystals after deposition for 800 s with different
concentration of CIT. ______________________________________________________________ 162
Figure 7-‐4. FE-‐SEM image of a glass substrate after deposition of calcium carbonate for
990 s with 0.5 mM CIT. ____________________________________________________________ 163
Figure 7-‐5. Images from in–situ microscopy after 990 s (699x525 µm) of deposition from
solutions at different concentration of CIT (images captured from movies
attached to the thesis). ____________________________________________________________ 164
Figure 7-‐6. Raman spectra of calcium carbonate deposited on glass in the presence of
different concentration of CIT: red solid line without; black solid line 0.5 mM
Figure-‐8-‐2. Adsorption of n-‐dicarboxylates in order of stability [11]. ______________________ 173
Figure 8-‐3. Main component molecular structures of additives investigated. _____________ 176
Figure 8-‐4. FE-‐SEM images of QCM crystals surfaces after deposition of calcium carbonate in
the presence of: (a) Baypure, (b) Sokalan and (c) Acusol. ______________________ 181
Figure 8-‐5. Gravimetric curves showing the deposition of calcium carbonate as function of
time in the presence of polymeric additives. Note the scale in y axis. _________ 182
Figure 8-‐6. Gravimetric curves showing the deposition of calcium carbonate as function of
time in the presence of molecular additives. Note the scale in y axis. _________ 183
Figure 8-‐7. FE-‐SEM images of calcium carbonate grown in the presence of Dissolvine GL-‐38.
______________________________________________________________________________________ 184
Figure 8-‐8. Schematic illustration of the formation of novel peanut-‐like CaCO3 aggregates:
(1) the growth of fractal structure through the nucleation and growth on the
side-‐surface of the rods; (2 and 3) the evolution of peanut-‐like aggregates
(based on reference [32]). ________________________________________________________ 184
Figure 8-‐9. FE-‐SEM images of calcium carbonate grown in the presence of Trilon M Powder,
(c) highlighted the (001) direction. ______________________________________________ 186
Figure 8-‐10. Optical images (at high magnification with small optical focus, only the planes
perpendicular to the lens were on focus) of calcium carbonate grown in the
presence of Trilon M Powder. Highlighted the angle of 102° of the (104) plane,
the 78° angle was absent. _________________________________________________________ 186
Figure 8-‐11. Representation of a rhombohedral calcite crystal, with the (001) direction
ighlighted. __________________________________________________________________________ 187
Figure 8-‐12. FE-‐SEM images of calcium carbonate grown in the presence of Purac (a)
underneath the nozzle (b) at the edge of the probe surface. ___________________ 188
Figure 8-‐13. Schematic representation of the Purac molecule interacting with the surface of
a calcium carbonate crystal. ______________________________________________________ 188
Figure 8-‐14. Gravimetric curves for Polyacrylic acid and sodium citrate, (*) the additive was
Figure 8-‐15. FE-‐SEM images of calcium carbonate grown in the presence of pure sodium
citrate and polyacrylic acid. The additives were incorporated into the (a, b)
List of Tables
Table 1-‐1. Instrumental techniques for surface investigations. ________________________________ 3
Table 2-‐1. List of chemical employed. ___________________________________________________________ 44
Table 2-‐2. Buffers employed._____________________________________________________________________ 45
Table 2-‐3. Reference and working electrodes employed. ______________________________________ 48
Table 2-‐4. Flow rate reliability test. Volume collected for channel A, B and after the T-‐mixer.
________________________________________________________________________________________ 51
Table 2-‐5. Solubility product constants [2]._____________________________________________________ 59
Table 2-‐6. Speciations of the solution after mixing. ____________________________________________ 60
Table 3-‐1. Metal complexes investigated. _______________________________________________________ 68
Table 3-‐2. Molecules and deposition conditions for the formation of SAMs macro platinum
electrode. _____________________________________________________________________________ 71
Table 3-‐3. Peak separation of [(biph-‐tpy)Os(tpy-‐SAc)](NO3)2] at different scan rate. ______ 74
Table 3-‐4. Peak separation of [(biph-‐tpy)Ru(tpy-‐thioctic)](PF6)2 at different scan rates. __ 77
Table 3-‐5. Deposition condition and surface coverage for different SAMs assembled at pt
macro electrodes. ____________________________________________________________________ 83
Table 4-‐1. Surface area and number of Pd particles. _________________________________________ 100
Table 6-‐1. Comparison of experimental and calculated pH and NaOH (1 M) added for 100 ml
of carbonate solution. _____________________________________________________________ 133
Table 6-‐2. Thermodynamic constants [24, 32] and activities of predominant solution
species after mixing. _______________________________________________________________ 133
Table 6-‐3. Experimental and tabulated [17, 35] Raman peaks for a calcite crystal. _______ 144
Table 6-‐4. Experimental and simulated flux and amount of calcite deposited. ____________ 149
Table 7-‐1. Experimental and simulated pH and NaOH (1 M) added for the various solutions
and the value of NaOH added to 100 ml of solution. ____________________________ 158
Table 7-‐2. Activity of the relevant species in solution after mixing. ________________________ 159
Table 8-‐2. Additives used and concentrations, (*) added to carbonate solution. __________ 178
Table 8-‐3. Total mass of CaCO3 deposited after 900 s for each additives in descending order
Acknowledgements
First and foremost I would like to thank Prof. Patrick Unwin for all his
help and patience thorough my PhD. His encouragement and sometimes the
animated discussions enable me to obtain this degree. I am grateful to Paolo
Bertoncello that helped and advised me from the beginning of my PhD. An
important mention to Pablo Contrera and Evans Kefalas for their help,
collaboration and exchange of ideas. I am also grateful to my industrial
collaborator at Reckitt-Benkiser, Liliana. Thanks to Tahani and Michelle for
helping me on the crystal growth experiments, Martin Edwards and Hayley
Morley for the COMSOL simulations. Thanks to Steve York helping me with the
FE-SEM images. I also would like to acknowledge Marcus Grant and Lee
Butcher in mechanical workshop for all their help. Their work has been
absolutely crucial in the developing the flow cells.
I would like to thanks the electrochemistry and interfaces group,
especially the people in C113. A particular thanks to Carrie-Anne, Michael,
Laura and Hollie for the coffee breaks and many other things… Mathias for
sharing for so long the house and for the interesting scientific discussions.
Agnieszka for the electrochemistry evening chats.
Raffaello and Paola that have made available their support in a number of
ways, for being always available and kind for anything I needed.
Finally, I would like to thank my family for their support and
Declaration
The work contained within this thesis is entirely original and my own
work, except where acknowledged in the text. I confirm that this thesis has not
been submitted for a degree at another university.
Part of this thesis has been published as detailed below:
Bertoncello, P.; Peruffo, M.; Unwin, P. R. Chemical Communications 2007, 1597-1599
Bertoncello, P.; Peruffo, M.; Li, F.; Unwin, P. R. Colloids and Surfaces A: Physicochemical and Engineering Aspects 2008,222-6
Abstract
This thesis is concerned with understanding and directing the
functionalisation of solid surfaces with materials: molecules, nanoparticles and
crystals. Both conducting (electrode) and insulating surfaces are of interest. For
molecular functionalisation, a sweep potential procedure has been developed to
assist the formation of self assembled monolayers (SAMs) of a ruthenium
thiolated complex. Electrochemical investigations were employed to
characterised the SAM formed on a platinum electrode.
Nanoparticles formation explored two distinct routes. First Pd
nanoparticles were successfully formed within ultra-thin Nafion films via
impregnation and a chemical reduction method. Morphological investigations
utilised atomic force microscopy. The electrocatalytic properties of the
nanocomposite material were elucidated for the hydrogen oxidation reaction. The
methodology used for the preparation of this nanocomposite material shows
promise for applications in sensors and fuel cells. Second, the potential-assisted
deposition of pre–formed perthiolated-ß-cyclodextrin-capped Pt nanoparticles
method is described. Pt nanoparticles (5 nm diameter) were deposited in a
controlled fashion on indium tin oxide and highly oriented pyrolytic graphite
electrodes. The Pt nanoparticles formed in this way were electrocatalytically
active towards hydrogen generation and oxidation. This new approach for the
deposition of metal nanoparticles with controlled surface density provides a new
A major focus of the second part of the thesis has been the development
of methods to study crystal deposition at extreme supersaturation. For this
purpose a delivery system for calcium carbonate at high-supersaturation ion has
been coupled with a quartz crystal microbalance and in–situ optical microscopy.
The dynamics and quantitative evaluation of calcium carbonate deposition onto
foreign solid substrates, and the effect of various additives, are described. Ex–
situ studies, scanning electron microscopy and microRaman spectroscopy,
allowed the morphological characterisation of the phases deposited. The
transformation of ACC to calcite has been explored in details. In the study of
additives, a significant finding was that citrate concentration shows a
non-monotonic behaviour on the amount of scale deposited. Fast screening of
different additives (polymeric and molecular) and a quantitative ranking of their
inhibitory properties on calcium carbonate deposition on a gold surface is
described. Molecular and polymeric additives showed different inhibitory
mechanisms on the scaling process and the technique employed gave a better
Abbreviations
ACC amorphous calcium carbonate AFM atomic force microscopy B–V Butler Volmer theory CA chronoamperometry
CD cyclodextrin
CIT citrate
CNT classical nucleation theory CV cyclic voltammetry ET electron transfer
FE-SEM field emission scanning electron microscopy HER hydrogen evolution reation
HOPG highly orientated pyrolytic graphite ITO indium tin oxide
KSV Kossel, Stranski and Volmer theory LS Langmuir-Schaefer
LSV linear sweep voltammetry NP nanoparticle
QCM quartz crystal microbalance SAM self-assembled monolayer
Glossary of Symbols
∆G Gibbs energy
∆µ chemical potential
A area
a radius
C capacitance
D diffusion coefficient d1 Helmholtz inner layer d2 Helmholtz outer layer d3 diffuse layer
E electrical potential F Faraday constant
f frequency h height
i current
I ionic strength
j current density
k0 standard rate constant
kads adsorption rate constant
kB Boltzmann constant
ksp solubility product
m mass
q charge
r radius
S saturation ratio
t time
T temperature V volume
Γ surface coverage
γ activity coefficient
εr dielectric constant
ν scan rate
Chapter 1
I
NTRODUCTION
Surface science is a discipline that investigates phenomena that occur at
interfaces, where an interface is defined as the boundary between two dissimilar
phases. Common interfaces investigated by this branch of science are solid/gas,
solid/liquid and solid/solid and the phenomena that occur can be distinguished as
chemical and physical processes or physicochemical. This thesis is concerned
with the functionalisation of solid/liquid interfaces either deliberately or
advantageously from the molecular, to the crystal, scale. Consequently, this
chapter gives an overview of adsorption, nucleation and growth processes at
liquid/solid interface. Particularly relevant to the thesis is the formation of
functionalised self-assembled monolayers, metal nanoparticles decoration of
electrodes and the deposition of amorphous and crystalline CaCO3. These topics
are covered in this chapter.
1 . 1
A B r o a d O v e r v i e w o f S u r f a c e
S c i e n c e
Benjamin Franklin can be considered as a major pioneer of interfacial
century). From this first step, knowledge on surface interactions, reactions and
characterisation have progressed enormously with time (Figure 1-1) and the area
has attracted the attention of many scientists from many different fields.
Figure 1-1. Interfacial science time line [1].
Interfacial science has been profoundly involved in the understanding of
prenucleation, nucleation and growth mechanisms of crystals. In the early 18th
century scientists have extensively investigated these processes. Ostwald [2]
gave a major contribution theorising the preferential growth of large crystals
compared to smaller ones. Larger crystals are energetically more stable, as a
consequence of the superficial atoms having a higher energy with respect to the
inner (bulk) atoms, so that a large crystal has lower surface to volume ratio with
respect to a small crystal. Similar behaviour is encountered during the synthesis
of metal nanoparticles in solution; their enhanced catalytic properties for some
reactions [3-5‘is related to the high surface to volume ratio [6], but small
particles (higher free energy) also tend to aggregate in solution to minimise the
free energy. The most widespread strategy to avoid this issue and obtain small
stable nanoparticles has been to exploit the affinity of alkanethiols for metals.
This category of organic molecules is adsorbed on the surface of the
The process of adsorption of molecules on a surface is itself an
interesting process to investigate. The formation of self-assembled monolayers
on a surface involves the interactions between the molecules constituting the
monolayer and the substrate, and inter–molecule interactions within the
monolayer [8]. Langmuir with his thermodynamic studies of chemisorption and
physisorption of monolayers provided a fundamental starting point for the
development of this field of science.
Surface science development has been strictly correlated with the
progress of new instrumentation that has allowed characterisation of surface
structure at molecular and atomic levels, as illustrated in Table 1-1 which
provides a summary of some of the key techniques.
Table 1-1. Instrumental techniques for surface investigations.
Technique Surface information
Atomic force microscopy Surface structure
Scanning tunnelling microscopy Surface structure
Angle-resolved photoemission spectroscopy Electronic Structure, surface structure
Scanning electron microscopy Surface topology, element analysis
Ellipsometry Layer thickness
Secondary ion mass spectroscopy Surface composition
X-ray photoemission spectroscopy Composition, oxidation state
Transmission electron microscopy Surface structure
1 . 2
S e l f - A s s e m b l e d M o n o l a y e r s
Self-assembled monolayers (SAMs) are a convenient and practical
material on metal and other surfaces with tuneable chemical physics properties.
Using targeted organic synthesis, it is possible to obtain atomic control of the
structure of the molecules employed to form SAMs; positioning organic and
organometallic functional groups along a molecular chain, this functionality can
be transferred to the vertical structure of a SAM [9-11]. Furthermore, scanning
probe techniques, and electron or atomic beam µ-printing can be used to obtain
horizontal patterning with 1–100 nm domain size [12-18] obtaining multi
constituent SAMs over a surface [19, 20].
SAMs have attracted attention for potential technological applications in
areas such as catalysis, chemical sensing, adhesion and biocompatible materials
[22-23]. With recent development in molecular electronic devices, SAMs have
also started attracting attention inthis field as well broadening their applications
[24-26]. They have been extensively used as tuneable insulating media to
investigate electron transfer from the supporting metal electrode to a terminal
redox group [9]or to explore the influence of conjugated bonds on the
conductance of organic molecules [27, 28].
1 . 2 . 1
S A M F o r m a t i o n a n d
C h a r a c t e r i s t i c s
The process of the formation of SAMs consists of the chemisorption of
organic molecules from a gas or liquid phase to a solid surface (metal
semiconducture or insulator) [29]. Specifically synthesised organic molecules
(Figure 1-2) constituted by: i) a head group for high affinity with the metal
and the metal surface; iii) a functional group, are usually employed in order to
obtain a SAM on a metal surface.
Figure 1-2. SAM molecule description
One of the most common procedures to prepare SAMs is to immerse a
clean and flat surface (vide infra) in a dilute solution (1–10 mM) containing the
constituent of the monolayer for 12–20 h (room temperature) allowing the
adsorption of the molecules at the metal surface [30]. The process leading to the
SAMs formation is subdivided into two main steps with different time scales and
thermodynamical properties, namely adsorption on the surface and
rearrangement of the molecules at the surface [31].
1.2.1.1 Adsorption Process
Adsorption is defined as the accumulation of species on a surface from a
neighbouring phase, with the type of interaction between the surface and the
adsorbate subdivided into two categories: physisorption and chemisorption.
Weak interactions are characteristic of physisorption governed by induced dipole
interaction (van der Waals interactions), while chemisorption is characterised by
strong interactions, ionic or covalent bonds, which are typical of those in the
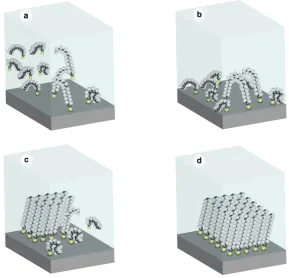
Figure 1-3. SAM adsorption process steps
The first step in adsorption is the transfer of adsorbates from bulk to the
surface by mass transport, followed by the actual adsorption on the surface that
involves chemisorption (Figure 1-3a). The overall process could be controlled by
mass transport, adsorption rate or be in a mixed regime. The formation of a
densely packed monolayer on a surface from dilute solution is a quick process
(Figure 1-3b), after a few minutes of deposition a rather high surface coverage
could be reached [32]. An increase in the concentration in solution shortens the
deposition time, but the SAM formed during this fast process is poorly ordered.
Despite the first phase being fast there is a second phase in which the molecules
on the surface rearrange to form a well-ordered monolayer (Figure 1-3c), that
requires a period from a few hours to days and is mainly regulated by the
interactions between the molecules (vide infra). Finally, a compact and
Exploiting the affinity of sulphur with different metals (Ag, Hg, Pd, Pt)
and particularly with gold; organosulphur (thiols, disulfides, sulphides) are
widely used to prepare SAMs on metal surfaces [34-38]. The energy of
metal-thiol bonds is of the order of 100 kJ mol-1 [39]. The reaction on gold has been
extensively investigated and no S–H stretching vibration is seen via Raman or
infrared spectroscopy after the formation of the SAM [40, 41]. Furthermore,
laser desorption mass spectrometry shows molecular thiols as negative ions
desorbing from the surface [42]. While the actual reaction involved in the
binding of thiols to metal (M) surfaces is not yet completely established, the
accepted mechanism is an oxidative addition of the S–H to the metal with release
of H2 in the gas phase (1) or formation of water in presence of O2 in solution (2)
[29].
(1)
(2)
1.2.1.2 Monolayer Organisation
After the initial adsorption phase, the molecular environment induces a
non–covalent interaction between neighbours and a molecular rearrangement
takes place [43]. This second stage needs much longer time, and the kinetics is in
the range of 2 orders of magnitude slower compared to the adsorption process
[32, 44]. This rearrangement provides a more compact monolayer and further
molecules are thus adsorbed on the surface increasing the overall surface
coverage. This phase is mainly regulated by the mobility of molecules on the
RS!H+M"RS!M+ 12H2
RS!H+M"RS!M+Hads
surface and the interactions between them, although the chain (spacer) structure
and composition play a key role. Van der Waals interactions between adsorbates
are the driving force for the reorganisation giving an important contribution to
the stabilisation of the monolayer. The characteristic and reproducible vertical
orientation of the molecules on the surface suggest a strong inter–chain
interaction to minimise the energy of the system [45].
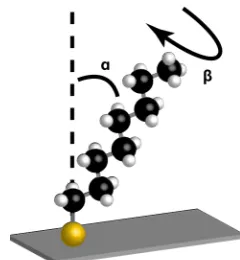
The orientation of molecules on the surface is controlled by two
competitive factors: the stability of the metal-sulphur bond; and the
maximisation of van der Waals interactions, with both dependants on the
direction of the molecules. The orientation is defined by the angle between the
main directrix of the molecules and the surface (Cant angle, α) and the rotation
of the C–C chain (β) (Figure 1-4). Alkanethiols have been studied extensively
and these parameters have been measured for different substrates, i.e. on gold,
silver, platinum the values are 28° (α) / 53° (β), 11° – 14° (α) / 45° (β), <15° (α),
[image:33.595.247.367.485.615.2]respectively [46, 47].
Figure 1-4. Molecule orientation on a SAM.
With the introduction of a specific functional group along the spacer
chain, it is possible to obtain relative control on the structure of SAMs. In
groups between neighbouring molecules [48-50]. Nevertheless, the presence of
bulky groups could also slow down the chemisorption kinetics and the adsorption
process may couple with the rearrangement mechanism and decrease the chain
interaction, so that a less stable and ordered SAM is obtained [49].
1.2.1.3 Defects
Figure 1-5 depicts the most common defects that could encountered on
SAMs and can be caused by several factors; the cleanliness of the substrate and
the presence of impurities in solution. The presence of foreign particles on the
surface, which are not displaced (energetically unfavourable process), interrupt
the continuity of the ordered monolayer. Furthermore, particles dissolved in
solution can be trapped within the monolayer, as adsorbate impurities can be
physisorbed on the surface driving to discontinuity on SAM organization.
Another important factor is the topography of the substrate: polycrystalline or not
atomically flat surfaces present discontinuities [51, 52]. The non–uniformity and
purity of the metal surface is reflected in the non–uniformity of the SAM and
these types of defects are strongly evident in electrochemistry experiments, i.e.
the pinhole effect [53] is defined as tiny exposure of the underling metal to the
solution, by incomplete SAM coverage. This is a serious problem when SAMs
are employed as a blocking barrier.
Adsorption is a dynamic process that is regulated by the equilibrium of
the adsorbate in solution and at the surface. It is important to note that a weak S–
M bond could lead to a high surface coverage of the monolayer when the solute
is present in solution, but a quick desorption process in a fresh solution which
does not contain the adsorbate.
1.2.1.4 Solvent
The solvent is of extreme importance, since deposition is affected by
solvent/adsorbate and solvent/substrate interactions, but the effect of these
interactions is not yet well understood. Several different solvents have been
employed to search for the optimal experimental conditions to form a close
packed monolayer and only general information has been acquired. Non–polar
solvents increase the ratio of adsorption, but solvents with long carbon chains
can interfere with the organisation of monolayers [54-57]. Nowadays, the most
common solvents used are ethanol, tetrahydrofuran, acetonitrile and toluene, and
there are no substantial differences upon the deposition of thiols [32].
1 . 2 . 2
E l e c t r o c h e m i s t r y o f a C o n f i n e d
R e d o x S p e c i e s o n a S u r f a c e
SAMs formed from thiols, disulfides and sulfides on gold have a
relatively strong resistance against reductive desorption (3) [58, 59], but on other
metals the stability is reduced [60]
(3)
Typical cyclic voltammograms (CVs) show a sharp cathodic peak for the
desorption proceeds via a nucleation centre is homogeneous across the metal
surface [61], and the desorbed thiols tends to stay close to the surface and are
readily readsorbed during the oxidative wave [62].
An electrode immersed in a solution generates a charge on the surface,
resulting in the formation of a non–zero potential at the electrode/solution
interface; the ions in solution migrate toward the surface to form a layer that
counterbalances the surface charge (Figure 1-6a), resulting in the formation of a
Helmholtz double layer (d1 inner layer, d2 outer layer). The high concentration of
ions near to the surface creates a gradient of electrolyte concentration with the
bulk solution, and a diffuse layer (d3) is formed from the surface to the bulk.
Figure 1-6. Helmholtz double layers (a), Potential gradient without (a) and with (c) the presence of an organic film.
In a relatively high electrolyte concentration, the Helmholtz double layer
determines an interfacial capacitance (10–100 µF cm-2) that depends on the
potential applied to the electrode. Organic molecules (Figure 1-6c) have a low
dielectric constant compared to an electrolyte solution hence an organic
monolayer at the surface of the electrode dramatically decreases the Helmholtz
capacitance, and it is virtually independent of potential [63, 64]. The capacitance
(4)
where q (C) is the charge, E (V) is the potential applied at the electrode, ν
(V sec-1) is the scan rate (dq/dt = i and dE/dt = ν), i (A) is the current and C
(Farad) is the capacitance which is proportional to the dielectric constant of the
media (SAM) and inversely proportional to its thickness
(5)
where εr (C V-1 cm-1) is the dielectric constant of the organic SAM, A
(cm2) is the area of the electrode and d (cm) is the thickness. It is also possible to
monitor the change of the capacitance during the deposition, to obtain in–situ
information about the self-assembly process and the quality of the SAM that is
produced.
The deposition of an organic non–conductive SAM on the surface of an
electrode forms an insulating barrier that suppresses faradic processes [65];
electroactive solutes are denied access to the electrode surface. However,
attaching a redox centre at the termination of the adsorbate SAM, provides a tool
to investigate either: the electron transfer across a spacer of fixed length
(thickness of the SAM) between the metal surface and the redox centre itself; or
the effect of different types of spacer [66-69], for example, conjugated bonding
along the chain, or aromatic moieties that increase the conductivity of the spacer
that could act as a conductive medium between the electrode and the redox
centre. The distance is easily tuneable using spacers with different lengths [70,
71]. The surface coverage of the redox centre is easily measured by integration
of the peak current during the redox process after background subtraction ((6), C= dq
dE = i !
(6)
(7)
where Γ (mol cm-2) is the surface coverage of the redox centre, n is the
number of electrons involved in the reaction, F (96.485 C mol-1) is the Faraday
constant and A (cm-2) is the area of the functionalised electrode.
These types of investigations are less affected by the presence of
pinholes, but surface coverage, lateral interaction and conformational distortions
can influence the CV shape from ideality. In a reversible oxidation reaction of a
SAM in which all the redox centres are initially in their reduced state
RedZRed kf
kb
⎯ →⎯
← ⎯⎯ OxZOx +ne− (8)
j (A cm-2), which is the current density associated by the reaction (8), and
is expressed by
j=nF
(
kfΓRed −kbΓOx)
(9)where kf and kb are the forward and backward half reaction rates constant
and ΓRed and ΓOx denote the surface concentrations (surface coverage) of the
reduced and oxidised species. In a system of strongly adsorbed molecules,
without adsorption and desorption, ΓT is the sum of ΓRed and ΓOx and is constant.
The rate constants expressed using Butler–Volmer (B–V) formalism are
kf =k0exp nF 1
( )
−αRT E−E
0
(
)
⎡ ⎣ ⎢ ⎢ ⎤ ⎦ ⎥ ⎥kb=k0exp nFα
RT E−E
0
(
)
⎡ ⎣ ⎢ ⎤ ⎦ ⎥ (10)where α defines the transfer coefficient, that corresponds to the symmetry
of the energy barrier [72] and k0 is the standard rate constant.
q= idE
!
Ei
Ef
"
The current density can also be defined as
j=nFdΓOx
dt =nF dΓOx
dE dE
dt =nFν dΓOx
dE (11)
and from ((9), (11)) is possible to obtain a differential equation which,
upon solving, gives the CV shape of the redox reaction
dΓRed dE =
1
ν ΓRedk
0exp nF 1
( )
−αRT E−E
0
(
)
⎡ ⎣ ⎢ ⎢ ⎤ ⎦ ⎥ ⎥−ΓOxk0exp nFα
RT E−E 0
(
)
⎡ ⎣ ⎢ ⎤ ⎦ ⎥ ⎧ ⎨ ⎪ ⎩⎪ ⎫ ⎬ ⎪ ⎭⎪ (12)Figure 1-7. Simulation of CVs using Butler–Volmer formalism, (solid line) different scan rate with constant rate constant, (dashed line) same scan
rate but smaller rate constant k0.
In Figure 1-7 are shown the theoretical CVs at constant k0 (105 s-1) and
increasing ν (100, 1000 and 5000 V s-1) (solid line), and waves at the same ν
(5000 V s-1) and smaller k0 (104 s-1) (dashed line), considering a surface coverage
of 10-10 mol cm-2. It can be seen that on the forward and reverse CVs the peak to
peak separation is related to the rate constant and increases for sluggish reaction
rates and at faster scan rates. The possibility of modelling an experimental CV is
useful in the calculation of the rate constant of the electron transfer.
A more rigorous treatment is obtained by including Marcus relations for
the rate constant, in which the electronic coupling, the reorganisation energy and
are considered [73, 74]. Several causes induce a deviation from the ideal
theoretical shape of a CV and that seen in practice. Thus to obtain a more
accurate evaluation of the constant rate, different models have been developed;
in the following paragraphs brief overviews of some of these are reported.
Lateral interactions. Two neighbouring molecules exert a different
interaction on each other depending on the oxidation state; Ox/Red, Ox/Ox and
Red/Red and can exert attraction or repulsion to different degrees, and during a
redox process the molecules change their oxidation states resulting in a
continuous variation of the overall interaction energy. Laviron formulated a
model based on B–V theory and when a Frumkin isotherm is followed [75]. It
showed deviation from the ideal CV shape for strong interactions with
consequent broadening of the peaks.
Effect of the interfacial potential. The redox centre is separated from the
metal surface by an organic medium with low dielectric constant that decreases
the potential sensed by the redox centre causing deviation from ideal behaviour.
This has been considered in the model developed by Smith and White [64].
Effect of ion pairing. Variation of the monolayer charge during a redox
process induces a flux of ions in and out the SAM region to compensate for
different oxidation states of the active centre. The stabilisation energy depends
on the number of ions constituting the solvation shell and this has been
considered by Rowe and Creager [76] to develop an expression that relates the
1 . 3
M e t a l N a n o p a r t i c l e s
In early 1990 Giersing and Mulvaney published a work [77] in which the
high affinity of alkanethiols for gold was exploited to stabilise gold nanoparticles
(NPs) in solution. The study of objects with at least one dimension in the rage of
1 – 100 nm showed the importance of size and shape on physical and chemical
properties of matter [78]; in the bulk metal electrons energy levels are a
continuum, but decreasing the size of the body in which the electrons are
confined, results in a quantisation of the energy levels [79-82], which drastically
changes the chemical and physical behaviour of matter at the nanoscale [83].
Another feature that makes NPs interesting is the high fraction of atoms at the
surface. Atoms at the surface have different properties compared to those in bulk;
in particular the atoms have a lower coordination number that changes their
reactivity [84, 85].
The assembly of metal nanoparticles on surfaces is currently of
considerable interest due to their extraordinary properties; the formation of
nanostructured interfaces on conductive substrates (electrodes) has led to the
exploitation of their properties in a variety of applications including sensing
[86-89] and nanoelectronics [90]. In electroanalysis NP decorated electrodes have a
number of advantages in comparison to macroelectrodes, including intrinsically
higher catalytic characteristic and an increase of the sensitivity. The small size
produces an increase in mass transport (for surface coverage < 1 %) and the high
surface area decreases the ratio of signal to noise [91].
Furthermore, NPs have an impact on the mass production of devices. The
![Figure 1-14. Spiral growth description, (reproduced from reference[137]).](https://thumb-us.123doks.com/thumbv2/123dok_us/9710555.472105/52.595.230.391.237.401/figure-spiral-growth-description-reproduced-reference.webp)