University of Warwick institutional repository: http://go.warwick.ac.uk/wrap
A Thesis Submitted for the Degree of PhD at the University of Warwick
http://go.warwick.ac.uk/wrap/34612
This thesis is made available online and is protected by original copyright.
Please scroll down to view the document itself.
Surface and Interface Structural Studies using
Medium Energy Ion Scattering
by
Daniel Crispin Sheppard
Thesis
Submitted to the University of Warwick
for the degree of
Doctor of Philosophy
Department of Physics
Contents
List of Figures iv
Acknowledgments x
Declarations xii
Abstract xiv
Abbreviations xv
Chapter 1 Introduction 1
Chapter 2 Theoretical principles & experimental methodology 4
2.1 Introduction to medium energy ion scattering . . . 4
2.2 Medium energy ion scattering - Background theory . . . 5
2.2.1 Collision kinematics . . . 5
2.2.2 Interaction potentials and the scattering cross-section . . . 6
2.2.3 Energy loss, straggling and neutralisation . . . 9
2.2.4 Shadowing and blocking . . . 12
2.3 Simulating MEIS blocking curves . . . 15
2.4 Instrumentation . . . 18
2.5 Surface structure determination . . . 21
2.5.1 Experiment-theory comparisons using reliability factors . . . 21
2.5.2 Optimising the structural model . . . 22
2.6 Supplementary experimental techniques . . . 23
2.6.1 Low Energy Electron Diffraction (LEED) . . . 23
2.6.2 Auger Electron Spectroscopy (AES) . . . 25
3.2 Experimental details . . . 31
3.3 Results and discussion . . . 33
3.4 Conclusions . . . 45
Chapter 4 Methylthiolate induced lateral distortion on the Cu(100) surface 47 4.1 Introduction . . . 47
4.2 Experimental details . . . 50
4.3 Results and discussion . . . 53
4.4 Conclusions . . . 63
Chapter 5 Methylthiolate induced modification of the Au(111) surface 65 5.1 Introduction . . . 65
5.2 Experimental details . . . 68
5.3 Results and discussion . . . 70
5.3.1 Initial evaluation and yield calibration . . . 70
5.3.2 Modelling the Au(111)(√3×√3)R30◦-CH 3Ssystem . . . 74
5.3.3 General discussion . . . 80
5.4 Conclusions . . . 81
Chapter 6 Evidence for adsorbate-induced reconstruction via backscattered ion yields 82 6.1 Introduction . . . 82
6.2 Alanine onCu(110) . . . 82
6.2.1 Introduction . . . 82
6.2.2 Experimental details . . . 85
6.2.3 Results and discussion . . . 87
6.2.4 Conclusions . . . 92
6.3 Methylthiolate induced reconstruction on thePd(111)surface . . . 92
6.3.1 Introduction . . . 92
6.3.2 Experimental details . . . 93
6.3.3 Results and discussion . . . 95
6.3.4 Conclusions . . . 97
List of Figures
2.1 Figure shows the binary collision of a moving particle of massm1 with a
stationary one of mass m2. This can be used to model the interaction of
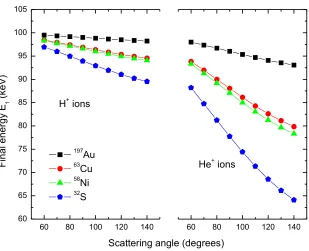
an incident ion with a target nucleus. . . 6 2.2 Graph shows the dependence of the final ion energy on the scattering
angle, for the scattering of 100keV H+ and He+ ions by a range of elemental targets. Noteworthy are the greater separation of the final energies of the heavierHe+ions for different targets, and a greater energy
separation at high scattering angles for both ion types. . . 7 2.3 Diagram shows the trajectory of an ion backscattered at depth d in a
target material. . . 10 2.4 The fraction of emergent projectiles positively ionised as a function of
emerging projectile energy for H+ and He+ ions incident on any target
material is shown in graphical form, based on the empirical formulae of Kido[18]. . . 11 2.5 Figure shows the trajectories of a beam of parallel ions incident on a
target atom nucleus, and the resulting shadow cone of radius RM as a
function of the distance d. . . 13
2.6 Figure shows the shadowing and blocking effects for a beam of parallel ions incident on a single crystal surface. Shaded areas within the crystal represent regions of ion flux, highlighting the unshaded regions below the scattering atoms which receive zero flux. Shown in red are the shadow cones cast as surface atoms block the backscattered ions exiting the crystal. 14 2.7 The incidence and exit directionse1 ande2for an ion backscattering from
2.8 The layout of the accelerator, beamline and ultra-high-vacuum (UHV) scattering and preparation chambers, which all together constitute the UK National MEIS facility at Daresbury Laboratory. . . 18 2.9 A 2D spectrum representative of those collected in MEIS, with a
char-acteristic high intensity surface peak. These data were obtained via the scattering of100keVH+ ions from a cleanAu(111) surface. Integrating the signal over a narrow angle range (shown in green), or over energy for merely the surface peak (shown in red) results in the production of an energy cut or blocking curve, respectively. . . 20 2.10 A schematic diagram of a standard LEED apparatus where the dotted
arrows show the path of the electrons and VEis electron source filament
potential. . . 25
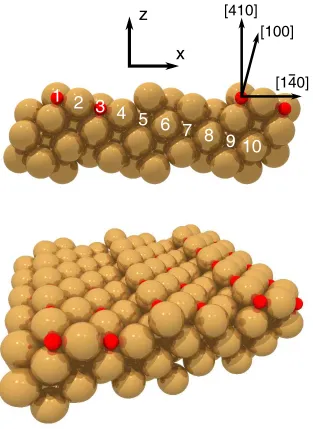
3.1 Model of theCu(410)surface shown in a perspective and a side-sectional view. The side-sectional view is annotated with the directions of the prin-cipal axes, major crystallographic directions and the atom row numbers as described in the text. The smaller red spheres represent O atoms, and the larger spheres the Cu atoms. . . 28 3.2 Side-sectional and perspective views of a Cu(100)(√2×2√2)R45◦-O
model, with the smaller red spheres representing O atoms and the larger spheres the Cu atoms. . . 30 3.3 The six ion scattering geometries used in the MEIS experiment. The
h110i,h110i andh310i incidence directions illuminate 1, 2 and 3 (100)-type surface layers respectively in a bulk continuation surface. . . 32 3.4 Experimental100keVH+ fixed-calibration blocking curves (grey squares)
obtained from the Cu(410)-O surface in the six different incidence ge-ometries shown in figure 3.3 with the results of a VEGAS simulation in which all Cu atoms are assumed to occupy ideal bulk-like sites. The O atoms are situated in 4-fold symmetric hollow sites at heights of 0.06Å and 0.65Å at the step and terrace sites respectively (see ‘Bulk’ column in table 3.1). . . 34 3.5 Experimental100keVH+ fixed-calibration blocking curves (grey squares)
3.6 Experimental100keVH+ fixed-calibration blocking curves (grey squares)
obtained from theCu(410)-Osurface in the six different incidence geome-tries shown in figure 3.3 with the results of a VEGAS simulation of the best-fit structure (see table 3.1 for the associated structural parameter values). . . 41
3.7 Experimental 100keV H+ blocking curves (grey squares) calibrated with freely optimised λscaling factors and an overall ‘skew’ so as to better fit the results of a VEGAS simulation of the best-fit structure (compare with figure 3.6). . . 43
4.1 Plan view of the Cu(100)(2×2)-CH3S surface, showing both the two
pertinent azimuths and a superimposed square representing the (2×2) unit mesh. The short arrows highlight the proposed lateral outward radial displacements (shown here with a value ∆xy =0.15Å) of the Cu surface
atoms surrounding the adsorbed methylthiolate species. . . 49
4.2 Side views of the [010] and [011] azimuthal scattering planes of the Cu(100)(2×2)-CH3S surface showing the ion incidence and major bulk
blocking exit directions utilised in this medium energy ion scattering study. 52
4.3 Comparison of the experimental blocking curves for both the cleanCu(100) andCu(100)(2×2)-CH3Ssurfaces in the[211]incidence geometry, with
the results of various simulated models exploring the effects of surface re-laxation, including both radial lateral movement (∆xy) and perpendicular
movement (∆z) of the surface Cu atoms. . . 54
4.4 Comparison of the experimental blocking curves for both the cleanCu(100) andCu(100)(2×2)-CH3Ssurfaces in the[100]incidence geometry, with
the results of various simulated models exploring the effects of surface re-laxation, including both radial lateral movement (∆xy) and perpendicular
movement (∆z) of the surface Cu atoms. . . 56
4.5 Comparison of the experimental blocking curves for both the cleanCu(100) andCu(100)(2×2)-CH3Ssurfaces in the[110]incidence geometry, with
the results of various simulated models exploring the effects of surface re-laxation, including both radial lateral movement (∆xy) and perpendicular
4.6 R-factor plots for the ∆xy lateral shift, ∆z perpendicular relaxation and
surface vibrational amplitude set of parameters which were optimised us-ing the IFFCO routine. The black squares represent the calculated R-factors as a function of different parameter values, and the red lines a 2nd order polynomial fit to these data, from which the error attached to each parameter can be estimated. The blue lines represent an asymmetric fit about the optimised parameter value. . . 62
5.1 Plan view of the surface and 2nd atomic layers of the (22×√3)rect. surface reconstruction of the cleanAu(111)surface, showing the smooth transition between ‘fcc’ and ‘hcp’ stacking along the long axis of the surface mesh. . . 67
5.2 Plan and side-section views of the ideal bulk-terminatedAu(111)surface. Shaded in green is one of the sheets of atoms that lie in a scattering plane used in this experiment. The figure shows the [110]and[112] ion incidence directions used in this experiment, which correspond to nominal illuminations of only the 1st and both the 1st and 2nd outermost atomic layers respectively. Also shown are the ion exit directions along which major blocking occurs. . . 69
5.3 Experimental MEIS blocking curves from both the clean and(√3×√3)R30◦ thiolated Au(111) surfaces recorded with ions incident in the [110] and [112] directions (see figure 5.2). Also shown are the VEGAS simu-lated blocking curves for the clean Au(111) surface, which include the (22×√3)rect. herringbone reconstruction, with the simulated results from the bulk-terminated(1×1) Au(111) surface added as a useful ref-erence. . . 71
5.4 Plan and side views of the models used in this study to represent the AAM (Au-adatom-monothiolate) and AAD (Au-adatom-dithiolate) reconstruc-tions suggested to occur in the Au(111)(√3×√3)R30◦-CH3S surface
5.5 A plan and side view of theAu(111)surface exploring the adsites consid-ered in this study. Au adatoms situated in the fcc hollow sites, hcp hollow sites and bridge sites are shown. The positions of the three inequivalent bridge sites are indicated, theasite being the only one that lies within the scattering planes of the substrate atoms (with adatoms in the scattering plane shaded in blue). . . 77
5.6 Experimental blocking curves for the clean and methylthiolate covered Au(111)surfaces, together with the results of VEGAS simulations of the (1×1)unreconstructed surface, the herringbone reconstructed clean sur-face and a number of simulations of the Au(111)(√3×√3)R30◦-CH3S
surface based on the AAM and AAD models shown in figure 5.4. . . 78
6.1 Schematic plan view of the Cu(110)(3×2)-alaninate surface structure found to give the lowest total energy in DFT calculations by Rankin and Sholl [131]. The black spheres represent C atoms, the red spheres O atoms and the blue spheres N atoms. Also shown in green is the outline of the (3×2)unit cell. . . 84
6.2 A side view of the Cu(110) crystal, showing the scattering plane used in the experiment together with the two distinct ion incidence directions, namely the[011]and[211]directions, which illuminate the uppermost 1 and 2 atomic layers respectively. Also shown are the directions which lead to major blocking of the backscattered ions. . . 86
6.3 MEIS experimental blocking curves for 100keV H+ ions backscattered
from the cleanCu(110)andCu(110)(3×2)-alaninate surfaces. Blocking curves are included for ions incident in both the[011]and[211]directions, corresponding to a nominal illumination of 1 and 2 surface layers, respec-tively. Simulations for the relaxed and unrelaxed clean Cu(110) surfaces are also shown. . . 88
6.5 Plan and side views of aPd(111)surface showing the incidence directions used in this investigation. Ions incident in the [110] direction will nom-inally illuminate only the surface layer, whilst those incident along the [112]direction nominally illuminate the top two layers. The main outgo-ing directions and associated scatteroutgo-ing angles along which backscattered ions experience atomic blocking are also shown. . . 94 6.6 The blocking curves resulting from the investigation of the clean and
methylthiolate covered Pd(111) surfaces using MEIS, with 100keV H+
Acknowledgments
Firstly, I must acknowledge and thank my supervisor Prof. Phil Woodruff, for giving me the opportunity to work with him and his group, here at the University of Warwick. His relaxed and calm style of supervision has made the last four years pass by in quite a stressless manner, and I feel truly privileged to have had such excellent scientific support and tutelage.
I am particularly indebted to the people involved with MEIS at Warwick who have aided me during this PhD: Dr Amanda Window, Dr Marc Walker, Dr Agenor Hentz da Silva Jr., Dr Gareth Parkinson and Rob Johnston. It was Gareth who ‘showed me the ropes’ during the first six months, and I thank him especially for being a good mate as well as a mentor. A special mention must also go to Agenor, who has been a great postdoc but has also become a cherished friend. Rob Johnston deserves special thanks for preparing all of the sources and samples (often at quite short notice!) needed for use at Daresbury. Without his tireless work for the group, I am certain nothing would ever have gotten done at all!
I must also acknowledge the support of the team at the UK National MEIS facility, Daresbury Laboratory: Dr Tim Noakes, Dr Paul Bailey and Paul Whitfield. They have had to deal with a somewhat demanding group, and I am grateful for their efforts to solve the countless experimental problems which have cropped up during the last four years, an unavoidable problem at a facility such as MEIS.
Eeyore, Louise, Dave, Matt Bradley, Chris Burrows, Sepehr, Wojciech, Matt Butchers, Priyanka, Liam, Ian, Nessa, Dan and Andrzej. I am especially grateful to my office mates Dave and Matt Bradley who kindly offered to proof read parts of this thesis.
Declarations
This thesis is submitted to the University of Warwick for admission to the degree of Doctor of Philosophy. This thesis contains an account of my research carried out in the Department of Physics at the University of Warwick and at the UK national MEIS facility, Daresbury Laboratory, during the period of October 2006 to September 2010, under the supervision of Prof. D. P. Woodruff FRS. No part of the material presented in this thesis has been used, either wholly or in part, in an application submitted to this or any other university.
The experimental data presented in this thesis were obtained over the period June 2005 to January 2010, with the people responsible for the data collection listed below. Unless specifically stated otherwise, all data were reduced by the author. All of the analysis and interpretation pertaining to these data was undertaken by the author.
The experimental data presented in Chapter 3 were taken by Dr. G. S. Parkinson, Dr. A. Hentz, Dr. P. D. Quinn and Dr. M. A. Muñoz-Márquez, and reduced by Dr. G. S. Parkinson. The experimental data presented in Chapter 4 were obtained by the author with the aid of Dr. M. Walker. The experimental data presented in Chapter 5 were taken in part by the author with the assistance of Dr. A. J. Window and Dr. A. Hentz, and in part by Dr. G. S. Parkinson and Dr. P. D. Quinn. The data comprising the latter part were reduced by Dr. G. S. Parkinson. The experimental data presented in Chapter 6 , section 6.2 were taken by the author with the assistance of Dr. A. J. Window. The experimental data presented in Chapter 6, section 6.3 were collected by Dr. G. S. Parkinson and Dr. A. J. Window.
Parts of this work have been published or are in preparation:
1. D. C. Sheppard, G. S. Parkinson, A. Hentz, P. D. Quinn, M. A. Muñoz-Márquez, D. P. Woodruff, P. Bailey, and T. C. Q. Noakes,“Surface relaxation in Cu(410)-O:
A medium energy ion scattering study”, Surface Science604,788−796(2010).
2. D. C. Sheppard, M. Walker, C. F. McConville, D. P. Woodruff, T. C. Q. Noakes, and P. Bailey,“Thiolate-induced lateral distortion of the Cu(100) surface”, Surface
Science604,1727−1732(2010).
3. D. C. Sheppard, G. S. Parkinson, A. Hentz, A. J. Window, P. D. Quinn, D. P. Woodruff, P. Bailey, and T. C. Q. Noakes, “Medium energy ion scattering investigation of
methylthiolate-induced modification of the Au(111) surface”,Submitted for publi-cation.
Additionally the author has contributed to the following publication during his PhD studies:
1. A. J. Window, A. Hentz, D. C. Sheppard, G. S. Parkinson, D. P. Woodruff, T. C. Q. Noakes, and P. Bailey, “Silver sulphide growth on Ag(111): A medium
Abstract
The technique of medium energy ion scattering (MEIS) can be used to elucidate the structural details of surfaces, both in general terms and in a more qualitative manner, in order to help solve a number of outstanding uncertainties relating to the structures of a number of surface systems. MEIS, involving the back-scattering of light ions from a material of interest, in this case100 keV H+ ions from adsorbate covered single crystal
metal surfaces, can potentially be a powerful tool for obtaining either depth-dependent compositional information or quantitative structural details.
MEIS has been used to study the surface relaxations at theCu(410)-O stepped surface. The results have been compared to a number of models favoured by previous studies, and an optimisation of the structural parameters associated with the outermost Cu atoms was undertaken so as to determine the positions of these atoms to a reasonable degree of precision.
In this thesis, MEIS has also been used to probe the surface reconstructions triggered by the adsorption of the methylthiolate species on theCu(100), Au(111) and Pd(111) surfaces. Methylthiolate is derived from the n-alkylthiol molecule methylth-iol, the simplest molecule of a species which ubiquitously form so called self-assembled monolayers (SAMs) on single crystal metal surfaces. In the case ofCu(100), our study confirms the existence of a radial lateral distortion of the outermost Cu layer, and we quantify this distortion. ForAu(111), two competing structural models for the methylth-iolate overlayer have been proposed, namely the Au-adatom-monothmethylth-iolate (AAM) and Au-adatom-dithiolate (AAD). MEIS has been used to compare these two models, and we find in favour of the AAD model. Additionally, evidence has been found for a significant reconstruction of thePd(111) surface triggered by adsorption of methylthiolate.
Abbreviations
AAM The Au-adatom-monothiolate model for thiolate induced reconstruction on the
Au(111) surface
AAD The Au-adatom-dithiolate model for thiolate induced reconstruction on theAu(111) surface
AES Auger electron spectroscopy
DFT Density functional theory
LEED Low energy electron diffraction
MEIS Medium energy ion scattering
ML Monolayer
NEXAFS Near-edge X-ray adsorption fine structure
NIXSW Normal incidence X-ray standing waves
RBS Rutherford backscattering
STM Scanning-tunneling microscopy
SXRD Surface X-ray diffraction
TEA Toroidal electostatic analyser
Chapter 1
Introduction
The structure of a crystalline material is of fundamental importance, as this structure plays a major role in determining the electronic and chemical properties of the material in question. At the surfaces of such crystals, however, the three dimensional periodicity of the bulk is lost, and as such the atomic structure in the surface region is in general different from that of the bulk. Many phenomena such as oxidation, heterogeneous catal-ysis, molecular self-assembly and corrosion take place at the surface, and these processes depend heavily on the structure of the surface region and the electronic and chemical properties that this structure influences. A major aim of surface science is to develop a predictive understanding of surface structure, and in turn develop an understanding of how this structure relates to surface properties. Surface science employs a wide armoury of experimental and theoretical techniques to probe surface structure, and the combined use of several such techniques to concentrate on a particular problem of interest has lead to insights being gained into ever more complex systems [1].
to that obtained from other surface techniques.
The surface studies presented in this thesis can be broadly summarised as adsorbate-induced modifications of clean single crystal metal surfaces. The majority of the work in this thesis concerns the formation of self-assembled monolayers (SAMs) of n-alkylthiolates on a variety of clean metal surfaces. SAMs of this kind have been a major subject of scientific interest for the past two decades. These thiolates tend to form highly dense and stable bio-compatible structures which have great potential for use in a wide range of applications; to name but a few: chemical sensing, molecular recognition, nano-scale electronics and non-linear optical devices. Despite the fact that such systems have been the focus of many studies, fundamental questions remain concerning the structures which these systems adopt, and MEIS is an ideal technique for gaining insight into these struc-tural details. In addition to the phenomenon of SAMs, other systems studied in this thesis include a stepped surface and the chiral molecule alanine adsorbed on Cu(110). The surface studies which comprise this thesis will be outlined subsequently.
In chapter 2 the background theory behind MEIS is laid out, which is then followed by a description of the general experimental methodology employed in the data gathering, reduction and analysis pertaining to the systems studied in this thesis. Also included are brief descriptions of the common surface science techniques of low energy electron diffraction (LEED) and Auger electron spectroscopy (AES) which have also been used in the work presented in the thesis.
Chapter 3 details a MEIS investigation of theCu(410)-Ostepped surface. There have been relatively few quantitative studies which have focused on the detailed atomic structure at the step sites, and some doubt remains regarding the structural details of this surface. The MEIS data have been initially compared to a range of existing surface structural models using a chi-square R-factor to objectively judge the quality of fit. Further analysis has been conducted in the form of a structural optimisation to uniquely determine the set of key structural parameters which best describe the data.
The structure of the interface formed between methylthiolate SAMs in the(2×2) phase andCu(100) is the subject of chapter 4. Methylthiolate adsorbed on theCu(111) surface triggers a pseudo-(100) reconstruction of the outermost layers, with this recon-struction characterised by a lattice spacing enlarged with respect to that of Cu(100). This has led to the suggestion of the presence of stresses in the outermost Cu layer of the Cu(100)(2×2)-CH3S phase, which might result in localised strain. MEIS
surface distortion.
The high coverage(√3×√3)R30◦ phase formed by methylthiolate onAu(111) has been the subject of numerous theoretical and experimental studies. It is widely be-lieved that the adsorbed thiolate induces a reconstruction of theAu(111)surface, but the exact nature of this reconstruction remains controversial. Two different models have been proposed, namely the Au-adatom-monothiolate (AAM) and the Au-adatom-dithiolate (AAD). However, as both models involve the same local adsorption site, diffraction tech-niques such as photoelectron diffraction and near-edge X-ray absorption fine structure (NEXAFS) have failed to distinguish these two models. A key difference between these two models, however, is the coverage of the Au adatoms which characterise the recon-struction. MEIS has been used as an ideal tool to probe the buried interface of this system, and distinguish between these two models, as related in chapter 5. The MEIS data clearly show the presence of an Au surface reconstruction, and despite a number of challenges in quantifying the information, this study finds in favour of the AAD model.
Chapter 2
Theoretical principles &
experimental methodology
2.1
Introduction to medium energy ion scattering
The MEIS technique, first developed by researchers at the FOM-AMOLF institute in Am-sterdam [2] in the 1980s, is a variant on the more well known Rutherford backscattering (RBS) method for probing material structure. The main difference between these tech-niques is the energies of the ions used to probe the material of interest, with∼100keV H+ or He+ ions used in MEIS as opposed to energies in the1MeV range for RBS.
In both techniques a beam of light ions is fired at a sample of interest with some of these ions being backscattered in the direction of an energy sensitive detector. The energies of the detected ions depend both on the mass of the atom from which they were scattered and the depth within the sample material at which this scattering event occurred, thus both techniques serve as depth-dependent compositional probes. The lower energies in MEIS, however, allow the use of a dispersive electrostatic analyser as opposed to the silicon barrier-detectors used in conventional RBS. This analyser has a much greater energy resolution, and the combined effect of this resolution enhancement and the greater electronic stopping of the medium energy ions results in a much greater depth resolution.
determination of the relative positions of the surface atoms.
Another related technique is LEIS (Low Energy Ion Scattering), although for ions in this energy range (typically a few keV), the interaction with the target material differs in a number of important ways. The large shadow cones cast at these energies give rise to an intrinsic surface specificity, but ion neutralisation effects, together with the fact that the ion/atom interaction potential is less well-understood, limit the accuracy of LEIS as a probe of surface structure. By contrast, the interaction potentials in MEIS are well known, enabling not only accurate determination of surface atomic positions but also allowing the scattering signal to be directly related to the number of atomic layers contributing to this scattering.
The remainder of this chapter will firstly be focused on the fundamental theory of medium energy ion scattering, after which the specific experimental details related to the work presented in this thesis will be given. At the end of the chapter a brief description is included of the standard surface science techniques of LEED (Low Energy Electron Diffraction) and AES (Auger Electron Spectroscopy). These have been used to aid in the characterisation of all of the surfaces which are investigated in this work.
2.2
Medium energy ion scattering - Background theory
2.2.1 Collision kinematics
One of the principal advantages of medium energy ion scattering (MEIS) is that the interaction between the ions and the nuclei of the target atoms is well known, and thus can be quantified. In fact, this interaction can be understood in terms of a binary collision between two free classical particles [3]. This is in part because of the large energies used in MEIS (ions with energies in the range 100−200keV), which means that both the momentum possessed by the incident ion, and the momentum transfer upon collision with the target nucleus is far greater than the quantum-mechanical uncertainty (due to Heisenberg) in the momentum. It is also the case that for light ions at these energies the associated De Broglie wavelength is far too short for the particles to manifest wave-like behaviour (such as diffraction) in their interactions with the target atoms. In addition, the time scale of the collision (in the order of10−15 seconds) is far less than the typical
thermal vibration period of the atoms (10−13), thus the target nucleus can be effectively
considered stationary. It is also the case that the local binding energy of the atom to the surrounding solid is so much smaller than the energy transfer associated with a scattering event that the target atom can be considered free.
m
ν
ν
ν
m
m
s
1 0 2 2 1 1 ϴ ϕFigure 2.1: Figure shows the binary collision of a moving particle of mass m1 with a
stationary one of massm2. This can be used to model the interaction of an incident ion
with a target nucleus.
describes the elastic energy loss suffered by the incident ion
E1
E0
=k2(θ) =
"
(m2 2−m
2 1sin
2
θ)1/2
+m1cosθ
m1+m2
#2
. (2.1)
Here m1 and m2 are the mass of the ion and target nucleus, respectively, andE0 and E1 the energies of the ion before and after the binary collision. The scattering angle
upon which the final ion energy depends is denotedθ (see figure 2.1). The ratioE1/E0
is most often referred to as the kinematic factor,k2.
Figure 2.2 evinces the dependence of the final scattered ion energy on both the scattering angle and the mass of the target nucleus, forH+ andHe+ ions initially at an
energy of100keV. Notice how scattering from a range of target species of differing mass results in different final ion energies. Given a well defined mono-energetic beam of ions and a detector at a known angular position capable of detecting both the ions and their energies, one can determine the species of the scattering atom. This gives the MEIS technique its elemental specificity. Targets of similar mass are often difficult to resolve energetically, but switching to a heavier ion, or to a geometry with a higher scattering angle could potentially solve this problem.
2.2.2 Interaction potentials and the scattering cross-section
Figure 2.2: Graph shows the dependence of the final ion energy on the scattering angle, for the scattering of100keVH+andHe+ ions by a range of elemental targets.
Notewor-thy are the greater separation of the final energies of the heavierHe+ ions for different targets, and a greater energy separation at high scattering angles for both ion types.
ion/atom interaction potential. The remainder of this subsection concerns the scattering cross-section used in MEIS and the interaction potentials upon which it is based.
The interaction between the ion and the target nucleus is Coulombic, and in the simplest case this can be described using the bare Coulomb potential,
V(r) =
1 4πǫ0
Z1Z2e2
r
, (2.2)
whereZ1 andZ2 are the atomic numbers of the incident ion and target atom respectively, ebeing the elementary charge andr representing the distance between the target nucleus
and the ion. Using such a potential, one can arrive at an analytical expression [4] for the scattering cross-section of a beam of particles of energyE, which in the case of the bare
Coulomb potential is given as
dσR
dΩ =
1 4πǫ0
2
Z1Z2e2
4E
2
1 sin4
(θ/2)
. (2.3)
on the scattering angleθis that famously found empirically by Rutherford [5]. Unfortu-nately, this expression is an unsuitable one for the ion energies used in MEIS, for which the screening of the bare nuclear charge by the surrounding electron cloud [6] must be taken into account. A more accurate interaction potential which incorporates Coulombic screening must therefore be used to correctly describe the scattering process. Several such potentials have been developed; these take the general form
V(r) =
1 4πǫ0
Z1Z2e2
r Φ
r
a
, (2.4)
whereΦ(r/a)is the screening function, this function in effect reducing the bare Coulomb potential so as to account for the electronic screening. The parametera is referred to as the Thomas-Fermi screening length, the value of which defines the range of the screening effects. Previous studies have assessed the applicability of several screening functions over a range of incident ion energies (e.g. [7]), with investigations which use ion energies and target materials typical to this thesis (100keV H+ ions incident on transition metal
surfaces) most often using the screened Coulomb potential due to Molière [8], for which
Φr a = 3 X i=1
αie−βir/a, (2.5)
with {αi}={0.10,0.55,0.35}, and {βi}={6.0,1.2,0.3}. Firsov [9] has demonstrated
that the Thomas-Fermi screening length in the case of a partially ionised projectile (see section 2.2.3) can be obtained thus
a= 0.88534a0
Z11/2Z 1/2 2
−2/3
. (2.6)
Herea0 is the Bohr radius (0.529Å). The ‘Rutherford’ differential cross-section expressed
in equation 2.3 can be corrected for the electronic screening of the Molière potential by the inclusion of a suitable prefactorF, with the correction factor proposed by L’Ecuyer
et al. [10] found to appropriately describe experimentally derived results in the medium energy ion regime [11]. This screening factor is expressed as follows
F = 1−0.042Z1Z
4/3 2
E[keV] . (2.7)
Thus the final equation for the differential cross-section is given below as
dσ dΩ =F
1 4πǫ0
2
Z1Z2e2
4Esin2
(θ/2)
2
with an additional angle dependent correction factor for the transformation from the centre-of-mass to the laboratory frame of reference,
g(θ, m1, m2)≈1−2(m1/m2)2sin4(θ/2) for m1<< m2, (2.9)
for whichm1 andm2 are the ion and target masses. It is noteworthy that the strength of
the scattered ion signal scales with the squares of the ion and target atomic numbers, thus we expect to see stronger scattering when usingHe+ions overH+ions. More significant,
however, is the strong dependence of the scattering cross-section on the atomic number (and hence mass) of the target atom. This has the practical effect of rendering ions in the medium energy regime (energies of ∼100keV) largely insensitive to the lighter atomic species, due to the low cross-sections of such targets and the resultant poor statistics in the backscattering signal. Another feature of equation 2.8 worth mention is the characteristically large ‘Rutherford’ dependence of the cross-section on the scattering angle, with much of the Coulombic scattering in the forward direction, and a far lower probability associated with an ion scattering through a large angle.
2.2.3 Energy loss, straggling and neutralisation
As discussed previously, ions incident on a target material have a low probability of a nuclear encounter which leads to scattering through a large solid angle, with most of the ions suffering only minor deflections and travelling deep into the material. The accumulation of successive weak nuclear encounters serves to slow the incident ions as they travel through the crystal, with this loss of energy being referred to as nuclear stopping. Ions will also interact with the electron clouds surrounding the target nuclei, as these electrons have comparable velocities to those of the ions, resulting in high probabilities associated with excitation and ionisation of the target atoms [12, 13]. These electronic processes will also serve to slow the ions, an effect known as electronic stopping. These cumulative effects are combined into a quantity known as the ‘stopping power’, which depends on the exact combination of target species, ion type and ion energy. For the ion energies used in MEIS the electronic processes dominate; this is because the cross-section for the ion/electron interactions is very strong for medium energy ions.
As the processes which contribute to the stopping power accumulate in a steady manner as the ion traverses the target material, the energy lost by the ion is a function of the total distance travelled within the crystal. This enables the determination of the depthd of a backscattering event, if the initial and final energies of the scattered ion are
E
inE
outFigure 2.3: Diagram shows the trajectory of an ion backscattered at depthd in a target material.
final energyEout of the emerging ion is given by
Eout =k2(Ein−Sp1)−Sp2, (2.10)
where S is the stopping power, and the total path length within the material p1+p2.
One can then easily find the depth to be
d= k
2E
in−Eout
S
cosθincos (π−θin−θout)
cosθin+k2cos (π−θin−θout)
. (2.11)
The SRIM database (Stopping and Ranges of Ions in Matter) and associated SRIM code of Ziegler, Biersack and Littmark [14] is most commonly used to obtain empirically derived values for the average stopping power per unit lengthS for particular ion/target
combinations.
The stopping power is expressed as an average due to the spread in the losses of individual ions, with considerable effort being directed at characterising this spread, de-scribed by a Gaussian distribution of widthΩ. This phenomenon is known as ‘straggling’, first treated theoretically by Bohr, in the case of fully ionised projectiles as
Ω2Bohr= 4πZ12Z2e 4
N L, (2.12)
whereN is the density of atoms per unit volume andL the target thickness. This early
wide range of experimental data
Ω2 Chu=
Ω2 Bohr
1 +A1EA2 +A3EA4
. (2.13)
Here the parametersA1 to A4 are target dependent, and are listed in [16].
Figure 2.4: The fraction of emergent projectiles positively ionised as a function of emerg-ing projectile energy for H+ and He+ ions incident on any target material is shown in
graphical form, based on the empirical formulae of Kido[18].
given below as
f+(Eout) = 0.17442 (Eout−10.2087)1/3 for 30→150keV H+ ions (2.14)
f+(Eout) = 0.02045 (Eout−12.3388)2/3 for 30→200keV He+ ions, (2.15)
where f+ represents the fraction of the total number of backscattered projectiles which
are positively ionised, andEoutis expressed in keV. Here the important point worth noting
is that this ionised fraction depends not on the target material but on the energy of the projectiles as they exit the material. This is because the projectile is constantly neutralised and re-ionised as it travels through the target, with the energy of the emerging projectile determining the final ionisation state. Equations 2.14 and 2.15 are shown graphically in figure 2.4, where it becomes clear that for the 100keV H+ ions used in the work
presented in this thesis the fraction of positive ions is ∼80%, with roughly 20%of the backscattered projectiles therefore going undetected.
2.2.4 Shadowing and blocking
The medium energy ion scattering technique is not intrinsically surface specific. The low probability of a nuclear encounter coupled with the energy of the incident ion ensures that most of the ions will travel deep into the target material, thus the vast majority of the ions emerging from the target will have been backscattered from atoms located within the bulk of this material. Surface sensitivity can be achieved, however, in the case of a single crystal target if one exploits the existence of ‘shadow cones’ to create a channelling effect, in which the backscattered yield from the bulk of the crystal is dramatically reduced.
s
R
d
M
Figure 2.5: Figure shows the trajectories of a beam of parallel ions incident on a target atom nucleus, and the resulting shadow cone of radiusRM as a function of the distance d.
with increasing penetration depth. If, however, any of these ions emerge from the crystal and are subsequently detected, they are at a much lower energy than those scattered from the surface region (due to increased electronic stopping) and thus can be differentiated from these surface ions with an energy sensitive detector.
In practice, the shadowing effect is not perfect, even in the case of an ideal crystal with an unreconstructed surface; this is due to the thermal vibrations of the target atoms. As the ion transit time through the surface region (∼10−15 seconds) is
much smaller than the period of the atomic vibrations (∼10−12–10−13 seconds) [2] the ions encounter an effectively static lattice with each atom randomly distributed around its lattice position. This inevitably leads to a reduction in the shadowing of the near subsurface layers, and the ions backscattering from these subsurface atoms will contribute significantly to the overall detected yield. For a typical beam/sample alignment geometry used in this thesis, the signal from all subsurface scattering is in the order of half the magnitude of that arising from scattering from the unshadowed surface atoms alone. Increased illumination of the subsurface atomic layers will also occur if the clean surface is reconstructed due to the presence of a foreign species. Given these displacements, be they random (due to vibrations) or static, it is often useful to accurately determine the radius of the characteristic shadow cones at the position of the first subsurface atom to be shadowed. The radius of a shadow cone cast by a bare Coulomb potential is easily calculated [2] as
RC = 2 √
whereRC andd are the Coulombic shadow cone radius and distance behind the scattering
atom respectively, as shown in figure 2.5, andb is given by
b=
1 4πǫ0
Z1Z2e2
E .
No such simple expression exists for the screened Coulomb potential due to Molière, but the ratio of RM/RC can be derived from empirical fits to experimental data obtained
from a wide variety of ion/target combinations [21], so that
RM =ξRC (2.17)
ξ=
1.0−0.12α+ 0.01α2 0
≤α≤4.5 0.924−0.182 lnα0.008α 4.5≤α≤100
, (2.18)
whereα is a dimensionless parameter given as
α= RC a .
Herea is the aforementioned Thomas-Fermi screening length.
Incident ions
To detector
In addition to the phenomenon of shadowing, which ensures surface specificity, a similar effect occurs for ions backscattered from the subsurface layers, in which these ions are blocked in the outgoing trajectories which intersect with surface atoms (See figure 2.6). This gives rise to characteristic dips in the intensity of scattering signal centred around scattering angles which correspond to major crystallographic directions, with the resulting plots of scattering intensity versus scattering angle referred to as ‘blocking curves’. The exact angular position of the dips relates to the positions of these surface blocking atoms, and so in principle the phenomenon of blocking allows one to determine the surface structure. However, many surface reconstructions are of a complex nature, possibly involving many nonequivalent movements of surface atoms both within the plane of the surface and perpendicular to the surface. Therefore, in practice, gaining insights into the exact nature of the structures adopted by surfaces involves the comparison of the experimental blocking curves with theoretical blocking curves which have been simulated for a given structural model.
2.3
Simulating MEIS blocking curves
The experimental blocking curves presented in this thesis, in which the measured scatter-ing intensity is plotted as a function of the scatterscatter-ing angle, are in general compared to the results of one or more computer simulations of particular surface structural models. These computations have been performed using the VEGAS code, a program developed specifically for use in MEIS by Frenken et al. of the FOM-AMOLF institute [2, 22–24]. This program uses a Monte-Carlo based algorithm and principles such as time-reversal to efficiently calculate the scattering probability for each atom of a structural model in a given incidence/exit geometry. In this section a brief insight into the details of this computation is given, but the interested reader is referred to reference [22], wherein a more detailed description of the principles behind the VEGAS code can be found.
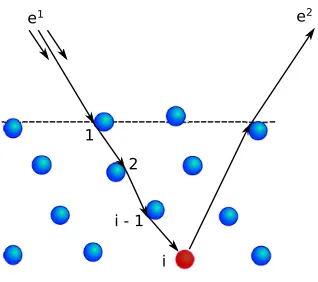
e1 e2
1 2
i - 1
[image:32.595.241.400.105.246.2]i
Figure 2.7: The incidence and exit directionse1 ande2 for an ion backscattering from
atomi, shown in red. This ion will suffer a series of small angle deviations in its incidence
and exit trajectories due to interactions with other atoms, taken into account by a Monte-Carlo algorithm in the VEGAS code used for simulating MEIS blocking curves[22].
associated with an ion scattered from this atom reaching the detector in the direction of interest. It is then easy to determine the scattering probability for this atom, and in turn the other atoms in the model surface unit cell. In this manner the overall scattering yield in particular incidence and exit directions can be calculated.
Let us consider backscattering from a particular atomi at the position xi in the
incidence and exit directionse1 ande2, respectively, as shown in figure 2.7. We can call
the scattering probabilityYi(e1,e2), and this can be expressed as
Yi e1, e2
=
Z
d3xiF1 e1, xi
Gi(xi)F2 e2, xi
. (2.19)
Here Gi represents the probability that atom i is located at the position xi; this is a
Gaussian distribution about the atom’s equilibrium position, and represents the effects of thermal vibrations. F1 represents the incident ion flux at positionx
i, in other words the
probability of an incident ion reaching positionxi. This term is normalised so that the
probability of an unshadowed atom receiving an ion is unity. SimilarlyF2is the probability
that the backscattered ion will reach the detector in the direction e2, normalised to
unity in the absence of any blocking effects. Of course, this scattering probability must strictly be integrated over all possible positionsxi. Whilst the functionGi is well known,
accurate determination of F1 and F2 is difficult as these quantities depend not only
on the collision parameters but also Gk for the atoms k 6=i along the incoming and
of any blocking (F2 =1), Yi is in fact the hitting probabilityHi of atom i:
Hi = Z
d3
xiF1 e1, xi
Gi(xi). (2.20)
Similarly the detection probability Di can be determined if the incidence is assumed to
be in a random direction, thus fully illuminating atomi (F1 =1):
Di = Z
d3xiF2 e2, xi
Gi(xi). (2.21)
Having calculated these probabilities the following approximation is then made (which is shown to be a good one in the vast majority of cases [23]),
Yi ≈HiDi. (2.22)
As the energy losses suffered by ions in the surface region are normally only a small fraction of the incident energy, the principle of time-reversibility can be used, in which
F2(e2,x) can be expressed as F1(−e2,x), in other words the probability of an ion
being detected in a particular exit direction is identical to the probability of such an ion incident in that direction hitting the scattering atom in question. Thus, only the hitting probabilities for each atom need be calculated, albeit separately for each exit angle considered, in addition to the incidence direction.
In order to speed up the calculation of the atom hitting probabilities, in which the string of atoms between the atom of interest and the ion incidence position must be considered, a standard Monte-Carlo integration is employed. In this Monte-Carlo approach a special sampling function is used, as opposed to random sampling, which matches the functionGi; this has the effect of greatly simplifying the calculations.
Scattering probabilities calculated in this manner are normalised to be unity in the case of an unshadowed (or blocked) surface atom. A final normalisation is then made of the total scattering probability for a whole atomic layer of the crystal in question, such that in the final simulated blocking curves a yield of unity corresponds to the signal from the surface layer. This leads to the consideration of total scattering yields in terms of the number ofvisible atomic layers, with subsurface layers contributing smaller and smaller fractions of a full layer visibility, due to the increased degree of shadowing from the layers of atoms above.
position just beyond the shadow cone radius of an atom in the layer above, for which the normalised incident fluxF1 is greater than1 due to the focusing of the trajectories of ions suffering small angle collisions with the shadowing atom.
2.4
Instrumentation
Experimental station Preparation chamber
Scattering chamber Collimator Electrostatic lens
Dipole magnet 500 kV power supply
Accelerator tube
[image:34.595.130.511.222.343.2]Ion source platform
Figure 2.8: The layout of the accelerator, beamline and ultra-high-vacuum (UHV) scat-tering and preparation chambers, which all together constitute the UK National MEIS facility at Daresbury Laboratory.
The data presented in this thesis were gathered at the UK national MEIS facility at Daresbury Laboratory. This facility (see figure 2.8) comprises an accelerator system for the production of the ions and several chambers under ultra-high-vacuum (UHV), these chambers being situated within an experimental end-station. The main scattering chamber in which the MEIS data are gathered, a preparation vessel and a fast-entry load lock are connected via interlocks to a storage chamber. In this way several samples may be loaded, prepared, characterised and stored in situ.
The ions (usually H+ or He+) are generated in a duoplasmatron source as an
fraction of the beam current, thus the current incident on the sample can be determined; it is found to be typically in the range15−100nA.
The beam finally encounters the sample which is mounted on a sample holder capable of interfacing with the multi-chamber sample transfer system, itself mounted whilst in the main chamber in a high-precision goniometer. This enables the sample to be rotated in three distinct axes to an accuracy of∼0.1◦. In this manner the sample can be precisely aligned with respect to the incident ion beam along a particular crystallographic direction of interest.
Housed within the main chamber is a toroidal electrostatic analyser (TEA), man-ufactured by High Voltage Engineering Europa [25]. This TEA is mounted on a rotation table, and is thus capable of rotating within the scattering plane. The TEA has a wide entrance slit which can accept ions scattered over an range of∼27◦. This slit is, how-ever, narrow in height (0.5mm), and in fact this slit defines the scattering plane; the sample is oriented so that the desired atomic scattering planes lie in the plane of the beam and the TEA entrance slit. Backscattered ions which enter the TEA are deflected via a pair of concentric toroidal electrostatic deflection plates through an angle of 90◦, with the symmetry of the analyser around the scattering centre ensuring that the true scattering angles of the detected ions are maintained. The combination of electrostatic deflection and conservation of scattering angle allow a position sensitive detector to si-multaneously record both the scattering angle and final energy of the detected ions. The energy window of the detector is 1.5% of the pass energy Epass, with the pass energy
being the central energy within the energy window. This pass energy is controlled by the voltages applied to the electrostatic plates. Data spanning a wide energy range can be collected by accumulating several identical doses of incident ion flux, with the pass energy being reduced by the required amount in a stepwise fashion. The individual 2 dimensional datasets can then be combined together using the data acquisition soft-ware MIDAS (Multi-Instance Data Acquisition System). In addition, the blocking curves shown in this thesis cover a wide range in scattering angle, this is because after data have been successfully collected at one position the analyser is typically moved so as to cover a neighbouring range of scattering angles, such that most experimental blocking curves comprise between2−4 such angular ranges.
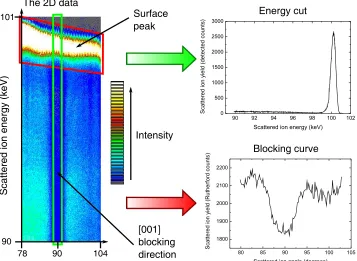
The 2D data
Scattered ion angle (degrees)
S
catt
e
red
i
on
e
ne
rgy (
k
eV
)
78 104
90 101
Intensity
Blocking curve Energy cut
90
[image:36.595.143.500.110.371.2][001] blocking direction Surface peak
Figure 2.9: A 2D spectrum representative of those collected in MEIS, with a characteristic high intensity surface peak. These data were obtained via the scattering of 100keVH+
ions from a clean Au(111) surface. Integrating the signal over a narrow angle range (shown in green), or over energy for merely the surface peak (shown in red) results in the production of an energy cut or blocking curve, respectively.
the use of a suitable scaling factorλ, a subject expanded upon in the next section.
2.5
Surface structure determination
2.5.1 Experiment-theory comparisons using reliability factors
Direct comparisons can be made between the blocking curves of experiment and theory via the use of a scaling factor λ. This term relates experimental yields in (Rutherford corrected) ion counts to the number of visible atomic layers, this being the way the yield is expressed in the VEGAS simulated blocking curves. Of course, even in the absence of any theoretical simulations it is still in general more informative to consider experimental yields in terms of visible layers. As such, the accurate determination ofλ is of key importance. This factor can be derived from the experimental yield obtained from a surface with a well-known structure, i.e. one for which layer visibility can be
predicted with good accuracy. For the work presented in this thesis, a scaling factor has most commonly been derived from the signal obtained from ions scattered from Cu atoms shallowly implanted to a known concentration within a Si(100) wafer. A detailed account of the methodology of this calibration process is included in the following chapter.
Although a suitable scaling factor provides a way to visually inspect the agreement between experiment and theory, a visual inspection alone, or a visual comparison of the merits of several theoretical fits to the same experiment is often inaccurate and always subjective. For this reason, reliability-factors have often been used in MEIS to objectively quantify the ‘goodness of fit’ between experiment and simulation. Woodruff et al. [27, 28] have previously assessed the suitability of a range of these ‘R-factors’ for use in MEIS, with the preferred one being a reduced chi-squared R-factorRχ, defined by
the following equation,
Rχ =
1 N
N
X
i
(Iexp−λItheo)2
Iexp
, (2.23)
where N is the total number of data points compared, and Iexp and Isim are the
exper-imental and theoretical ion intensities. The experexper-imental intensity is expressed in terms of raw counts, and there are a number of points worth mentioning regarding this fact. Firstly, the use of the raw counts renders equation 2.23 a true chi-square function used in statistics [29]; this means that a value of unity is expected in the case of a perfect fit, as theIexp denominator is subject to Poisson statistics and so is, on average, equal to
the square of the error on this quantity. Secondly, note how the value forRχ increases,
λdoubled accordingly). For this reason one cannot prescribe a general ‘goodness of fit’ criterion based on the absolute value of Rχ, and must instead rely on its usefulness as
a relative measure of the goodness of fit for the simulations of several structural models describing a particular set of experimental data. A final point relating to the use of raw ion counts concerns the ‘Rutherford correction’ of the experimental yields described in the previous section, where a factor of ∼sin4(θ/2) is applied to the data to remove the cross-sectional dependence on the scattering angle θ. The R-factor operates on the raw uncorrected counts, so seemingly small disagreements at low scattering angle between experiment and theory blocking curves have a large influence on the final R-factor. Thus the fits are generally biased towards minimising the low scattering angle yield discrepancies.
In MEIS experiments more than one incidence geometry is often exploited to increase the available structural information, this leads to multiple blocking curves, each with a corresponding R-factor when compared to theory. An overall combined R-factor can be obtained thus
ROverall=
N1R1+N2R2+· · ·NnRn
N1+N2+· · ·Nn
, (2.24)
with each individual R-factor weighted by the size of its respective dataset.
The choice of a chi-squared R-factor also makes the estimation of the uncertainty associated with a particular structural parameter rather straightforward, with the error being given as [29]
σ =
v u u t
2
d2Rχ
dZ2
R=Rmin
. (2.25)
Thus if one calculates the R-factor as a function of the parameter of interest around the best-fit value for that parameter, one can use the curvature of the R-factor to estimate the uncertainty.
2.5.2 Optimising the structural model
routine. A number of these routines, such as Genetic Algorithms and Simulated Anneal-ing attempt a global search of parameter-space, in order to avoid the problems associated with becoming trapped in a local (rather than global) minimum. Unfortunately, these methods often involve full simulations of many hundreds of structural models and are deemed unfeasible for application to MEIS. This being said, previous success has been had [30, 31] in MEIS with the use of line search methods which sample the R-factor gradient within a well defined region of parameter-space and attempt to converge on the R-factor minimum. The current version of this routine used by the group at Warwick University will now be described in brief; a fuller description of this method can be found elsewhere [32].
The routine is base on a Quasi-Newton (BFGS) algorithm [33, 34]. In such meth-ods a function, in this case the chi-square R-factor, is approximated with a quadratic model which is then used to determine the position of the function’s minimum. This quadratic model depends on both the gradient ∇hf(x) at the sample point x and the
estimated HessianB (a matrix of second derivatives). These quantities are used to
de-termine the search direction, and an iterative line search process is undertaken, with the gradients calculated at each step used to update the estimated Hessian. The newest ver-sion of the routine uses an improvement on this standard method which involves varying the line search step size h as the optimisation proceeds [35]. The step size is initially
given a large value to ensure that low amplitude noise inf(x)does not have the effect of mis-directing the search, with successive iterations adopting smaller values forh as the
search closes in on the minimum. This approach, called Implicit Filtering, is found to be more robust in dealing with statistical variations in the R-factor function associated with the use of Monte-Carlo methods in the VEGAS simulations. Hereafter this auto-mated optimisation routine is referred to by the acronym IFFCO (Implicit Filtering for Constrained Optimisation).
2.6
Supplementary experimental techniques
2.6.1 Low Energy Electron Diffraction (LEED)
in many texts, with the reader referred to the treatment given by Van Hove [38]. In LEED a collimated beam of electrons of energy in the range 20−300eV is generated by an electron gun, and this beam is incident upon a surface of interest, possessing a 2-dimensional periodicity defined by the primitive lattice vectors a and b. Electrons of these energies have characteristic wavelengths in the order of ∼1Å, this value being the same order of magnitude as the interatomic distances in the solid target. Thus the conditions for diffraction of the incident electrons by the surface atoms are met. The surface specificity implied in the previous sentence arises due to the high cross-section for both elastic and inelastic scattering of the incident electron, resulting in a strong attenuation of the electron beam within the few atomic layers closest to the solid/vacuum interface. If the wave-vector of an incident electron is kand that of the diffracted electronk′, then considering the conservation of energy we have
|k′|2 =|k|2, (2.26)
and considering the conservation of momentum we arrive at
k′k =kk+ghk, (2.27)
whereghkrepresents the reciprocal net vector. Notice how only the wave-vector compo-nents parallel to the surface are conserved. This is because the surface net only possesses a periodicity parallel to the surface plane. The reciprocal lattice vector is given below as
ghk=ha∗+kb∗, (2.28)
wherea∗ andb∗ are the translation vectors of the reciprocal lattice, found by
a∗= 2πb×n
A b
∗= 2πn×a
A A=a·b×n. (2.29)
Here n is a unit vector normal to the surface. Thus constructive interference and the associated diffraction beam occur when the change in the parallel component of the electron wave-vector is equal to a reciprocal lattice vector characterised by the integers handk, with the resulting beam spot identified by this pair of integer values.
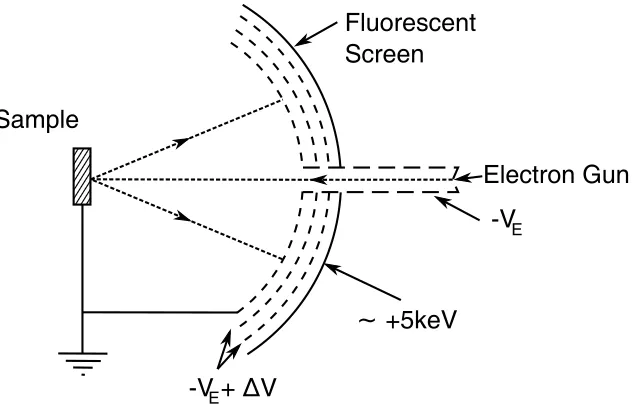
-V +
∆
V
∼
+5keV
Electron Gun
-V
Fluorescent
Screen
Sample
E
[image:41.595.165.481.107.315.2]E
Figure 2.10: A schematic diagram of a standard LEED apparatus where the dotted arrows show the path of the electrons andVE is electron source filament potential.
produce a visible beam spot. Thus the diffraction pattern produced can be considered a scaled representation of the reciprocal surface net, and a quick visual inspection is often enough to deduce the real-space surface net via an inversion of equations 2.29. LEED has been extensively used in this thesis as a way to judge the degree of order on clean transition metal single crystal surfaces, most often characterised by a set of diffracted beams consistent with a(1×1) periodicity of an unreconstructed surface. The sharp-ness of the diffracted beam spots gives an indication of the degree of order in the surface region. This technique has also served as a way to check the phase of adsorbate overlayer structures.
2.6.2 Auger Electron Spectroscopy (AES)
Auger electron spectroscopy is a technique which takes advantage of the characteristic ‘Auger’ electrons emitted from surface atoms previously ionised by an incident electron beam. Captured by a suitable energy analyser, these Auger electrons carry information about the surface chemical composition; for this reason the technique has been used as a judge of the cleanliness of the clean metal surfaces studied in this thesis. The interested reader is directed to [39] for a detailed description of this technique but a brief description is given below.
Chapter 3
The structure of the
Cu
(
410
)
-
O
surface
3.1
Introduction
Vicinal single crystal surfaces (surfaces made up of low-index crystal planes separated by atomic steps and kinks) have long been of interest due to the enhanced catalytic activity [40] and the adsorption and desorption behaviour [41] evident on these surfaces in contrast to simpler low-index single crystal surfaces. It is widely accepted that the steps themselves play a dominant role in the behaviour of these surfaces, and as such there have been many attempts to understand the atomic structure in these step regions. These step regions tend to be characterised by increased structural relaxation relative to the ideal bulk-like termination, due to the reduced coordination of the atoms at the step sites.
The Cu(410)-O stepped surface is a particularly suitable surface for study with medium energy ion scattering (MEIS) for a two main reasons:
1. A number of Cu surfaces vicinal to the(100) plane facet to form(410) regions as a consequence of oxygen adsorption [42–48]; clear evidence that the Cu(410)-O surface has a particularly low associated energy and is particularly stable.
2. Pronounced atomic roughening of the step edges [49, 50] in cleanCu(410)at room temperature, a general problem with clean metallic vicinal surfaces, is found to be alleviated by the adsorption of oxygen [49].
over the large surface area probed by the ions, a prerequisite for elucidating quantitative structural information.
1 2 3
4 5
6 7 8
9 10
x
z
[410]
[100]
[image:44.595.168.481.148.577.2][140]
Figure 3.1: Model of the Cu(410) surface shown in a perspective and a side-sectional view. The side-sectional view is annotated with the directions of the principal axes, major crystallographic directions and the atom row numbers as described in the text. The smaller red spheres represent O atoms, and the larger spheres the Cu atoms.
hollow sites, whereas the remaining oxygen atoms occupy reduced coordination hollow sites at the terrace edge. A number of previous investigations have been based on STM (scanning-tunneling microscopy) [43, 45, 51, 52], but several more quantitative studies exist. These include an early scanned-angle mode photoelectron diffraction investiga-tion [53], and more recently investigainvestiga-tions utilising ion scattering [54] and surface x-ray diffraction (SXRD) [55–57], with the results of some recent density functional theory (DFT) calculations also reported [55]. The previous studies have focused on a number of aspects of the structure, namely the adsorption site and layer spacing of the oxygen atoms, the relaxation of the Cu atoms relative to their ideal bulk positions and whether there is a missing Cu row on the(100) terraces. All of these questions are linked to the Cu(100)(√2×2√2)R45◦-Ostructure which forms on the singularCu(100) surface (fig. 3.2). It is now accepted that on this surface every fourth[001]row of Cu atoms in the outermost layer is removed, leading to local geometries identical to those of the step sites on the (410) surface [46, 58–61]. One key difference between these models shown in figs. 3.1 & 3.2 is the fact that in theCu(410)-O surface half of the O atoms occupy unreconstructed 4-fold coordinated hollow sites in the mid step as opposed to the less constrained O atoms at the step edge, whilst in theCu(100)(√2×2√2)R45◦-O model all O atoms occupy the step edge site. The fact that theCu(100)(√2×2√2)R45◦-O surface exhibits a missing Cu row at such O coverage had lead to the suggestion that such a fourth row would also be missing from theCu(410)-Osurface, but this has been shown to be inconsistent with the SXRD data [55]. Instead, it seems that the O atoms lie in almost coplanar sites at the step edge on the Cu(410)-O, as is the case with the Cu(100)(√2×2√2)R45◦-O, but at the mid step sites on the Cu(410)-O the O atoms sit above the surrounding Cu neighbour atoms, as has been found to be the case for low coverages of O onCu(100)[59].
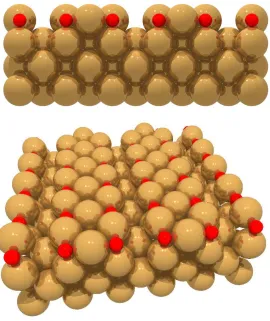
Figure 3.2: Side-sectional and perspective views of aCu(100)(√2×2√2)R45◦-Omodel, with the smaller red spheres representing O atoms and the larger spheres the Cu atoms.
row 10 are constrained in their bulk sites, this leads to 20 distinct structural parameters which describe the outermost Cu atom configuration and 4 parameters which describe the O atom positions. These 24 parameters can be reduced to only 16 if the smaller parallel (x-axis) displacements of the atoms in rows5-10 are assumed to be zero. It is these 16 parameters which the previous SXRD study attempted to identify. This study resulted in three distinct structural solutions being proposed, one based on the results of the DFT calculations, and two based on optimised fittings of the SXRD data using applied constraints based on Lennard-Jones potentials (hereafter referred to as LJ1 and LJ2). The structural parameter values corresponding to these three solutions are listed in table 3.1.


![Figure 3.5: Experimental 100figure 3.3 with the results of a series of VEGAS simulations based on the LJ1, LJ2 andDFT models proposed in the recent combined SXRD/DFT studyobtained from the keV H+ fixed-calibration blocking curves (grey squares) Cu(410)-O surface in the six different incidence geometries shown in [55] (see table 3.1 forthe structural parameters associated with these models).](https://thumb-us.123doks.com/thumbv2/123dok_us/9710945.472142/54.595.164.484.154.575/experimental-simulations-studyobtained-calibration-dierent-geometries-structural-parameters.webp)
