F.C. Smit
09-07-2015
Supervisors:
Medisch Spectrum Twente D. I.B.W. de Vries-Blanken T.J. Schopman
University of Twente
Integral planning of
operating rooms and wards
Colophon
Title: Integral planning of operating rooms and wards
Author: F.C. Smit
Project: Master Thesis
Period: November 2014 – June 2015
Educational Institution: University of Twente
Faculty: Behavioural, Management and Social sciences
Program: Industrial Engineering and Management
Specialty: Healthcare Technology and Management
Supervisor: prof. dr. ir. E.W. Hans Supervisor (2nd): ir. A.G. Leeftink
Organization: Medisch Spectrum Twente
Department: Capacity Management
Supervisor: D. I.B.W. de Vries-Blanken T.J. Schopman
Location: Enschede
Management samenvatting
Aanleiding en doel van het onderzoek
Medisch Spectrum Twente (MST) wil zorg bieden die efficiënt georganiseerd is en waarin de patiënt centraal staat. De afdeling capaciteitsmanagement heeft daarom zich als doel gesteld de efficiëntie van de zorg te verbeteren binnen het MST. MST is bezig met de nieuwbouw van een ziekenhuis. Daarom heeft de afdeling capaciteitsmanagement als taak een brug te slaan tussen het oude en nieuwe ziekenhuis. Een deel van deze brug bestaat uit het verbeteren van patiënten planning, want de huidige manier van patiënten planning past niet in het nieuwe ziekenhuis door een afname in het aantal bedden. Desondanks moet het nieuwe ziekenhuis hetzelfde aantal patiënten kunnen behandelen als dat ze nu doen.
De hoofdoorzaak van de hierboven genoemde problemen ligt in de electieve patiëntenstroom. De electieve patiëntenstroom zorgt voor fluctuaties in bedbezetting en in hollen en stilstaan van verpleegkundigen doordat de patiëntenplanning voor operaties van verschillende specialismen niet op elkaar is afgestemd. In dit onderzoek richten we ons daarom op de tactische capaciteitsplanning van electieve patiënten om afstemming tussen electieve patiëntenstromen van verschillende specialismen te realiseren en een constantere bezetting van verpleegafdelingen te creëren. Hiervoor gebruiken we de volgende doelstellingen:
“Het opzetten van een interventie die de variabiliteit in bedbezetting verlaagt en het creëren van een methode voor de implementatie van deze interventie binnen het MST.”
Methode
Als eerste is een context analyse uitgevoerd om patiëntstromen in kaart te brengen, om ervaringen van verpleegkundigen te verzamelen en om de huidige prestaties rondom operatiekamers (OKs) en verpleegafdelingen van het MST te analyseren. Vervolgens is een literatuur onderzoek gedaan naar de oorzaken van fluctuaties in bedbezetting, het creëren van OK roosters en methodes om bedbezetting efficiënt te kunnen organiseren. Door deze analyses naast elkaar te leggen is een interventie geselecteerd die voldoet aan de wensen van het MST. Deze interventie is uitgewerkt en uitgevoerd om de mogelijke verbeteringen in kaart te brengen. Vervolgens hebben we een simulatiemodel gemaakt om de invloed van veranderingen in parameters te analyseren. Voorgaande onderdelen hebben als doel het geven van richtlijnen voor het plannen van patiënten en een stappenplan voor de implementatie van de interventie binnen het MST.
Interventie
Resultaten en conclusie
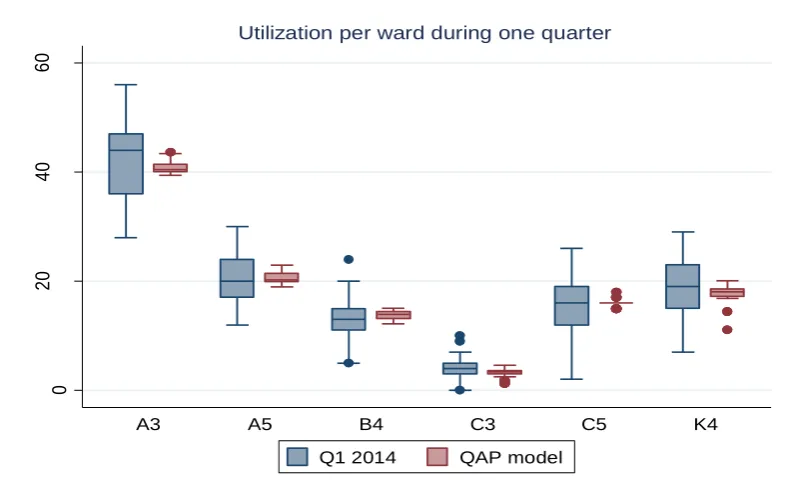
QAP-model: Het hoofddoel van het QAP model is het verminderen van de variabiliteit in
bedbezetting. De resultaten laten zien dat de fluctuaties sterk verminderd zijn en dat het maximum aantal benodigde bedden met 29,4% is afgenomen vergeleken met de gerealiseerde situatie van 2014. Het nadeel van het model is dat er meer variatie ontstaat in de OK bezetting.
Simulatiemodel: Het simulatiemodel verhoogt de variatie in bedbezetting vergeleken met het QAP
model, maar is wel lager dan de gerealiseerde situatie in 2014. Dit komt waarschijnlijk doordat de ligduur van patiënten in de simulatie meer dan het maximale aantal van 28 dagen uit het QAP model kan zijn. Ook is er meer variatie in de bezetting van OKs dan in 2014. Het maximaal aantal benodigde bedden is met 14,1% afgenomen.
Gevoeligheidsanalyse
Een gevoeligheidsanalyse is uitgevoerd om de invloed van veranderingen in parameters in kaart te kunnen brengen. De volgende veranderingen hebben wij geanalyseerd:
Invloed van seizoenen: We hebben de invloed van de grootte van de patiëntenpopulatie in de winter en zomer geanalyseerd. De populatie in de winter is groter, maar het verschil in resultaten van het QAP-model is klein. Door een kleinere populatie in de zomer is het nodig het OK rooster te herzien.
Invloed van veranderingen in de patiëntenpopulatie: Het MST verwacht de komende jaren meer dagbehandelingspatiënten. Dit zal resulteren in een verandering van het OK schema. Deze patiëntengroep is relatief goed te plannen door voorspelbaarheid in ligduur, maar daar is een goede afstemming tussen specialismen voor nodig.
Invloed van veranderingen in de patiënten mix: Het verplaatsen van langverblijvers (LV) naar de eerste helft van de week of verplaatsen van kortverblijvers (KV) naar de tweede helft van de week resulteert in toenemende fluctuaties in bedbezetting en heeft een negatieve invloed op OK bezetting.
Invloed van het sluiten van OKs: Het sluiten van OKs lijkt een kleine invloed te hebben op OKs en verpleegafdelingen, maar we hebben alleen de OKs gesloten waarin één of twee patiënten gepland stonden. Het sluiten van andere OKs kan betere resultaten opleveren.
Het verlagen van OK-capaciteit in QAP model: Het verlagen van de OK-capaciteit in het QAP model reduceert variatie in OK-bezetting en verhoogt OK-bezetting. Invloed op bedbezetting is klein.
Implementatie
We hebben per specialisme regels opgesteld voor het planen van patiënten. De algemene regels zijn:
Dagbehandelingspatiënten moeten worden verdeeld over de week (ongeveer 16 per dag)
KV (ligduur <= 1,5 dag) moeten in de eerste helft van de week worden gepland
LV (ligduur > 1,5 dag) moeten in de tweede helft van de week worden gepland
Vervolgens hebben we aan de hand van literatuur een zeven stappen plan opgesteld voor het implementeren van de interventie.
OK analyses laten vaak onderbezetting zien van OKs. We raden het MST aan om onderzoek te doen naar de OK roosters, omdat specialismen misschien te veel OK tijd toegewezen hebben gekregen dan daadwerkelijk nodig is.
Wij raden de opnameplanning aan de planningsregels te volgen. Dit is alleen mogelijk wanneer de wachtlijsten voldoende patiënten van het juiste type bevatten. Daarom raden wij aan onderzoek te doen naar de relatie tussen wachtlijsten en patiënten mixen.
Management summary
Background and scope
Medisch Spectrum Twente (MST) strives for the most efficiently organized care with a centralized position for the patient. Therefore, efficiency improvement is one of the main goals of the MST’s capacity department. Additionally, this department creates a bridge between the old and new building to make the reallocation successful. This implies the improvement of patient scheduling, because current processes do not fit in the new building due to a decreased number of beds. Nevertheless, the new building should accommodate at least as many patients as the old building. MST’s main challenge regards the elective patient flow. Elective patient flow causes fluctuations in bed utilization and in workload for nurses, because of insufficient alignment between specialties in surgery related patient scheduling. Therefore, this research focuses on the tactical capacity planning in operating rooms (OR) and wards. It aims to improve the alignment between elective patient flows of different specialties and to reduce fluctuations in bed utilization. Therefore, the research objective is:
“To propose an intervention that reduces variability in bed utilization and to determine the necessary steps for implementing this concept in the organization.”
Method
First, we perform a context analysis to describe patient flows, evaluate staff experiences in wards, and to analyze current OR and ward performances in MST. Then we perform a literature research into causes of fluctuations in ward utilization, organization of OR scheduling, and methods for leveling of bed utilization. We select the most appropriate method that fits the requirement of MST based on the context analysis and the literature research. Thereafter, we describe the intervention and do experiments to analyze the improvement potential of this intervention. We expand this intervention with a simulation study to vary experimental settings and to analyze the influence of changes in parameter settings. Finally, we give guidelines for patient scheduling and advise MST about the implementation of the intervention in the organization.
Intervention
Glerum (2014) proposed a Quadratic Assignment Problem (QAP) model for determining the optimal mix of patients for OR scheduling, based on Length-of-Stay (LoS), within an existing master surgery schedule (MSS). The model uses deterministic surgery duration and a stochastic LoS. We decide to use this model for MST as well, because it balances improvement potential and feasibility, and hospital conditions are similar. We prospectively asses this approach with a simulation model that uses the optimal patient mix as input to calculate possible outcomes for MST.
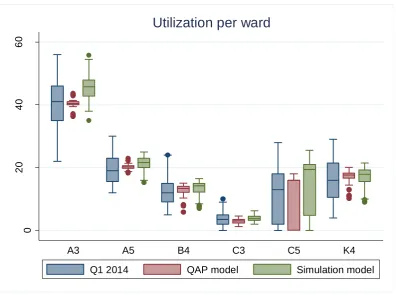
Results
QAP model: The main goal of the QAP model is to reduce variability in bed utilization. Results show a
reduction of fluctuations in ward utilization and a reduction in maximum bed requirements of 29.4% compared to 2014. The disadvantage of the model is an increase in variation of OR utilization.
OR utilization increases as well compared to 2014. However, the maximum bed requirement decreases with 14.1% compared to quarter one of 2014.
Sensitivity analysis
We do a sensitivity analysis to test the influence of changes in parameters. The following tests are executed:
Effect of seasonality: We analyze the influence of the patient population in winter and summer. The population in winter is larger, though differences in outcomes of the QAP model are relatively small. OR schedules need revision due to a decreasing patient population in summer.
Influence of changes in patient population: MST expects more day treatment (DT) patient in the upcoming years creating a need for revision of the OR schedule. Additionally, this patient group is relatively easy to schedule, although a good alignment between specialties is necessary.
Influence of changes in case mix: Reallocation of long-stay (LS) patients to the first half of the week or reallocation of short-stay (SS) patients to the second half of the week leads to fluctuations in ward utilization. OR utilization and its variation increase as well.
Influence of closing ORs: Closing ORs has a small influence on ORs and wards, but we only consider to close ORs in which one or two patients are scheduled. Closing other ORs will probably have more effect.
Reduction of OR capacity in QAP model: Reducing OR capacity in the QAP model decreases variation in OR utilization and increases OR utilization.
Implementation
We create planning decision rules per specialty for planning of elective patients. These rules will be guidelines for admissions planners. General rules are:
Spread DT patients over the week (about 16 a day)
Plan SS (LoS <= 1.5 days) patients in the first half of the week
Plan LS (LoS > 1.5 days) patients in the second half of the week
Additionally, we create a seven-step approach for the implementation of the intervention. This approach consists of communication, documentation, pilot, pilot evaluation, total rollout, rollout evaluation, and maintenance.
Further research
Recommendations to MST are:
OR analysis reveals frequent underutilization of ORs. We recommend revision of the OR schedule, because some specialties probably need less surgery time than scheduled.
Admission planners should follow the planning decision rules whenever there are enough patients available on the waiting lists. We advise MST to analyze waiting lists in relation to the case mix.
Table of contents
Management samenvatting ... I Management summary ... V
List of abbreviations and terminology ... 3
Preface ... 5
1 Introduction ... 7
1.1 Context ... 7
1.2 Problem description ... 8
1.3 Research objective and scope ... 9
1.4 Research questions... 10
2 Context analysis ... 13
2.1 Patient flow ... 13
2.2 Problem identification in wards ... 18
2.3 Performance indicators ... 20
2.4 Data analysis ... 21
2.5 Problem analysis ... 29
2.6 Conclusions ... 30
3 Literature research ... 31
3.1 Variability ... 31
3.2 Organization of OR planning to level bed utilization ... 32
3.3 Intervention selection ... 35
3.4 Conclusions ... 36
4 QAP model ... 37
4.1 Model description ... 37
4.2 Experiment settings ... 38
4.3 Experiment results... 39
4.4 Fixed quota vs. QAP model output ... 41
4.5 Conclusion QAP model ... 42
4.6 Limitations ... 42
5 Simulation model ... 43
5.1 Objective and scope ... 43
5.2 Conceptual model ... 43
5.5 Verification ... 46
5.6 Validation ... 46
5.7 Experiment design ... 47
5.8 Experiment results... 49
5.9 Conclusion simulation model ... 51
5.10 Limitations simulation study ... 52
6 Sensitivity analysis ... 53
6.1 Seasonality effect ... 53
6.2 Influence of changes in patient population... 55
6.3 Influence of changes in case mix ... 55
6.4 Influence of closing ORs ... 58
6.5 Reduction of OR capacity for elective admission planning ... 60
6.6 Conclusion sensitivity analysis... 61
7 Implementation ... 63
7.1 Patient scheduling decision rules ... 63
7.2 Implementation of intervention ... 64
7.3 Conclusion ... 66
8 Conclusions and recommendations ... 67
8.1 Conclusions ... 67
8.2 Limitations of this study ... 68
8.3 Recommendations... 69
Bibliography ... 71
Appendix A: Map of each ward floor in the new hospital... 73
Appendix B: Patient types per ward ... 75
Appendix C: Bed utilization per ward ... 79
Appendix D: QAP model description ... 81
Appendix E: Input for the QAP model ... 85
Appendix F: Output QAP model ... 89
Appendix G: Fixed quota vs. QAP model output ... 93
Appendix H: Distributions for LoS and surgery duration... 97
Appendix I: Flowcharts simulation model ... 99
Appendix J: Calculation experiment design ... 101
List of abbreviations and terminology
Abbreviations
BZH Special dental care (in Dutch: Bijzondere tandheelkunde)
CHI General surgery (in Dutch: Algemene chirurgie)
DES Discrete Event Simulation
DT/M10 Day treatment (in Dutch: Dagbehandeling)
GYN Gynecology (in Dutch: Gynaecologie)
KCH/OMS Oral and maxillofacial surgery (in Dutch: Kaakchirurgie)
KNO Ear-nose-throat (ENT) (in Dutch: Keel-neus-oor)
LoS Length-of-Stay (in Dutch: Ligduur)
LS Long-stay, LoS > 1.5 days (in Dutch: langverblijvers, ligduur > 1,5 dagen)
MSS Master surgical schedule
MST Medisch Spectrum Twente
NCH Neurosurgery (in Dutch: Neuro chirurgie)
OOG Ophthalmology (in Dutch: Oogheelkunde)
OR Operating room (in Dutch: Operatiekamer)
ORT Orthopedics (in Dutch: Orthopedie)
PCH Plastic surgery (in Dutch: Plastische chirurgie)
QAP Quadratic Assignment Problem
SS Short-stay, LoS <= 1.5 days (in Dutch: kortverblijvers, ligduur <= 1,5 dagen)
URO Urology (in Dutch: Urologie)
Terminology
BLOKplan OR planning tool for specialists/specialties
Boarding Assigning a patient to a bed on a different ward than the intended ward for this patient group
Leveling Smooth recourse occupancies without peaks ORsuite Surgery scheduling tool
Utilization The amount of time a resource is used against the amount of time a resource is available
Preface
In November 2014, I started my master thesis assignment at MST Enschede, and now, eight months later, this assignment marks the end of my eight years of study. During the first five years of the bachelor Biomedical Engineering I concluded that it was not the study what I was hoping for, although I liked the health care sector. Therefore, I switched to the master of Industrial Engineering & Management with specialization Health Care Technology & Management. In this way, I kept focus on the health care sector. It was quickly clear that I made the right decision. When it was time to search an internship for my master thesis, this research project in Enschede was proposed to me. I had the choice to focus on resource logistics or on patient flows in MST. This was an easy choice, because I have always been more interested in patient flows and I definitely made the right decision. I believe I am now ready for the next step. I hope my report will have a similar effect for MST, in that it will provide a guideline for the next step in planning for MST. I hope it provides insight in the current situation and the possibilities for tactical planning.
For the past eight months, I really enjoyed working on this research project. Therefore, I would like to thank the people of MST to give me the opportunity to do the thesis. Special thanks to Irma and Thijs, who have answered all my questions to them and have been great supervisors throughout this project. I hope you are pleased with the results. I also would like to thank Judith who gave me all the data.
I also would like to thank Erwin for all the feedback and support. I always came out of our meetings way happier than I went in. Additionally, I would like to thank Gréanne for being a “last minute” stand-in in my committee, rapid answers on emails, and useful feedback.
Not only within the project but also at home, I received support. Therefore, I like to thank Sophie, for motivating me and calming me down when needed. Moreover, I thank Jesper for being my English corrector. And last but definitely not least, I would like to thank my parents, for making it possible for me to study carefree and for supporting me all the way.
I hope you will enjoy reading this report and I am very curious for the achieved results.
Frank Smit
1
Introduction
Medisch Spectrum Twente (MST) wants to improve their care processes and financial results in 2014 (MST, 2013). For the capacity management department these improvements are related to increased efficiency and quality. In the past decade, the health care sector has had a strong focus on these aspects as well.
High efficiency is desired in operating rooms (OR), because they are the most expensive part of a hospital. However, not improving ward related processes leads to a decrease in efficiency and therefore a decrease in quality. For example, overutilized wards possibly lead to surgery cancellations. A more efficient patient flow and leveled workload can be obtained when ward utilization is included. This results in a higher quality of care. The focus in this research is on leveling of bed utilization and OR scheduling. It is consistent with the vision of the capacity management department: delivering of efficient organized care with focus on patient processes. Improvement of OR planning and bed leveling is a small part of the patient process.
This chapter gives a short introduction and motivation for this research. Section 1.1 provides the reader with an overview of developments in the health care sector that forces MST to improve their processes, as well as an introduction to MST. This is followed by the problem description with the core problem in Section 1.2. Section 1.3 describes the objective and scope of the research. Finally, Section 1.4 gives the underlying research questions.
1.1
Context
This section gives the context of the research. First, current developments in the health care sector are described followed by an introduction and characteristics of MST.
1.1.1 Developments in the health care sector
Nowadays, health care expenditures increase every year due to several factors. According to the national government of the Netherlands more care, higher quality, insufficient efficiency of health care, changing epidemiology, and ageing population are jointly responsible (Ministerie van Volksgezondheid, 2012). In 2012, the Netherlands spend 12.4% of the GDP on health care which is relative high compared to the world wide expenditures of 10.1% (WHO, 2012a, 2012b).
Efficiency and quality of care are closely related to each other and also the most common goals to change. A more efficient organized care leads to an improved quality of care. Hospitals should improve efficiency and quality related aspects. However, many improvements are already made in the past decade. Professor Bakker, of Academisch Medisch Centrum Amsterdam, has mentioned in 2009 that hospitals are function oriented whereas they should be more process oriented (Te Lindert, 2009). Additionally, the communication within a hospital is insufficient. A specialty in a hospital can be efficient at its own, whereas the hospital can be inefficient as a whole when a lack of communication between specialties occurs.
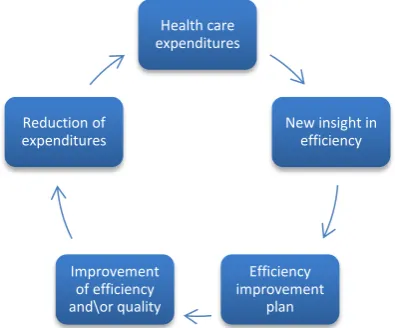
interests lead to an increased turnover. This creates a cycle, starting with high expenditures for health care and a possible reduction of these expenditures at the end (see Figure 1). DBC focus on efficiency which on its turn improves the quality of care.
Figure 1: Circle of expenditures reduction by improving efficiency/quality.
1.1.2 Medisch Spectrum Twente
MST will open their new hospital building in Enschede in 2016 and will then be one of the largest non-academic hospitals in the Netherlands. MST consists of four different locations, namely the hospital locations in Enschede and Oldenzaal and outpatient clinics in Haaksbergen and Losser. It has a service area of approximately 264.000 people. Location Enschede focuses not only on the basic facilities, but also on the top-clinical facilities. The organization consists of approximately 2.900 employees, among which 230 medical specialists. In addition, there are 468.000 outpatient visits, 33.000 day-care treatments and 31.000 admissions each year (MST, 2014). The new MST has 670 beds available against 702 in the old situation.
In 2012 MST started with a new project for continuous improvement in the quality of care called “3S” (Samen Slimmer Systeem). This project evaluates the process of employees through the eyes of the patient. In this way, quality is monitored and the patient is in a more centered position. In addition, MST pays extra attention to patient satisfaction by extending opening hours, shortening waiting lists, and providing better information and aftercare (MST, 2013). Over the next few years, MST will provide patients with more information about the quality of care in terms of quality indicators. Finally, the focus for the upcoming one/two years will be on the relocation to the new hospital building. Employees should be well prepared and some processes have to be improved, for example logistics, to increase the quality of care (MST, 2013). Therefore, the capacity management department plays an important role. The aim of the department is to match the demand and supply of care in the interest of mainly patients, as well as for MST itself and employees.
1.2
Problem description
In the current situation, about 60% of the patients visiting an outpatient clinic are referred to the OR. The planning of the particular patient starts when a patient is sent to the OR. A patient does not get a date for surgery immediately, because of waiting lists and unpredictability in health care. Nowadays, a lot of information is available, such as waiting times. Therefore, patients decide which hospital is most suitable for them. This results in a “shopping” culture.
Health care expenditures
New insight in efficiency
Efficiency improvement
plan Improvement
If the predictability of OR schedules improves, the quality of care increases and the chance of losing patients decreases. This sounds easy in theory, but a patient is very complex in terms of predictability. No patient is the same and this leads to differences in surgery duration and Length-of-Stay (LoS). Scheduling further in advance introduces other problems. The chance of disturbances increases when the period between the moment of scheduling and the actual time of surgery increases. This research intends to find a compromise between short-term and long-term scheduling. To cope with unpredictability, it is necessary to have knowledge about treatment pathways in terms of historical data. In the tactical planning phase, allocation of capacity over specialties takes place. Forecasting of OR schedules improves if all available knowledge is used in this phase, which might lead to a reduction of variability in bed utilization. In addition, managing utilization is easier when there is more flexibility in capacity allocation. This allocation can be successful if the communication between departments is sufficient and if the OR planners anticipate to a changed situation. The alignment between and control of OR and bed utilization is insufficient in MST. A nurse of pediatrics experiences situations as “all or nothing”.
In this research we focus on the tactical level of OR planning and especially on bed utilization at location Enschede. MST has to deal with variability in bed utilization. These fluctuations lead to differences in workload for employees. If the peak utilization is high, the possibility of an admission stop increases, as well as surgery cancellation rates. To match the aim of the hospital and the vision for the new hospital, it is necessary to level bed utilization. We describe the core problem as follows:
1.3
Research objective and scope
The OR is the most expensive department in a hospital. However, only considering OR planning without optimizing bed utilization leads to possible problems in the OR as well, because an admission stop can arise and thereby surgery cancellations might occur. Therefore, it is necessary to take in consideration the OR planning and ward planning to level variability in bed utilization. Especially since the new MST has a decreased number of hospital beds. The research objective is as follows:
This research focuses on elective patient flows from the admission department to the OR and finally to the ward of MST location Enschede. To achieve the objectives the tactical part of resource capacity planning in the framework for health care planning and control is used (see Table 1). Emergency patients are excluded, because they cannot be planned in advance. Non-surgical patients are excluded as well, since they are not part of the surgical process. The interventions are obtained by comparing the current situation with the literature. Section 1.4 provides an outline of the research.
The core problem of this research is:
The alignment between and the control of bed utilization is insufficient. Therefore, the elective patient flow increases variability in bed utilization.
The objective of this research is:
Table 1: Framework of health care planning and control (Hans, Van Houdenhoven, & Hulshof, 2012).
Medical planning Resource capacity
planning Materials planning Financial planning
Strategic Research,
development of medical protocols
Case mix planning, capacity dimensioning,
workforce planning
Supply chain and warehouse design Investments plans contracting with insurance companies H ie rarchi cal d ec o mp o siti o n Tactical Treatment selection Block planning, staffing, admission planning Supply selection, tendering
Budget and cost allocation
Offline operational
Diagnosis and planning of an individual
treatment Appointment scheduling, workforce scheduling Materials purchasing, determining order sizes
DRG billing, cash flow analysis Online operational Triage, diagnosing emergencies and complications Monitoring, emergency coordination Rush ordering, inventory replenishing Billing complications and chance
Managerial areas
1.4
Research questions
To achieve the research objective we formulate several research questions. Each question corresponds to a chapter. This part gives the outline of the report. Each chapter answers corresponding sub-questions. The main questions are answered in the final conclusion.
Chapter 2: Context analysis
Chapter 2 gives an overview of the current situation. The main question for this chapter is formulated as follows:
How can the current OR and ward planning be described and what is the current performance?
Necessary information regarding this question is obtained by meetings with employees. This leads to an up to date description about the current situation at MST. To find an answer on the main question, Section 2.1 describes the key-figures of the planning process and organization of OR/ward planning. Section 2.2 summarizes meetings with the heads of the wards. In Section 2.3, you will find performance indicators, which is followed by the performance analysis in Section 2.4. Section 2.5 describes the core problem. Chapter 2 answers the following sub-questions:
2.1 Which key-figures can be identified in the planning process and how is OR and ward planning currently organized?
2.2 How do wards experience current performances? 2.3 What performance indicators can be identified? 2.4 What is the current performance?
2.5 What is the core problem, what are the consequences, and what factors influence the problem?
Chapter 3: Literature Research
Chapter 3 describes the relevant literature. This literature is based on the following question: What concepts are mentioned in the literature to organize the core problem(s)?
3.1 What causes high fluctuations in bed utilization?
3.2 How can OR planning on a tactical level be organized to level bed utilization? 3.3 What improvement concept is applicable for the situation at MST?
Chapter 4: Intervention
Chapter 4 is used for the intervention. The following question supports the process behind the intervention:
How can the current organization be improved to anticipate and reduce variability in bed utilization?
Section 4.1 is about the modeling approach. To setup an experiment we need experimental settings that can be found in Section 4.2. Finally, Section 4.3 shows the modeling output and comparison with the current situation. The following questions are applied:
4.1 How can we model the intervention? 4.2 What experiment settings do we use? 4.3 How does the model operate?
Chapter 5: Simulation study
Chapter 5 describes the simulation mode. This model is used to test the outcome of the model in Chapter 4. The following question is used:
How does the output of the model in Chapter 4 perform according to a simulation?
Chapter 5 uses the methodology of Law (2007). Each section of this chapter corresponds with one of the steps of this methodology. The following questions are used the answer the main-question:
5.1 How can we simulate the process of MST by using the output of the intervention? 5.2 What experiment settings do we use?
5.3 How does the simulation operate?
Chapter 6: Sensitivity analysis
This chapter gives insight into the consequences of changes in parameters. We will test some changes that can occur in reality by using the following question:
What is the influence of changes in parameters on the performance of ORs and wards?
Chapter 7: Implementation
When a suitable intervention is found, the intervention has to be implemented. Chapter 7 provides MST with suggestions to organize the proposed interventions by using the following question:
How can the implementation phase be organized to implement the proposed interventions?
Chapter 8: Conclusion and recommendations
2
Context analysis
This part describes the current processes in and performances of MST. The analysis is obtained by analyzing OR and ward related processes. In this way, the problem(s) is (are) identified and input for an adequate model is created. Section 2.1 starts with the patient flow, because this determines the fluctuations in MST. The next section explains the ward related problems according to head of wards. Section 2.3 explains what performance indicators are used to evaluate the current process. Section 2.4 describes the current performance. Finally, Section 2.5 gives the core problem.
2.1
Patient flow
Different patient flows lead to difficulties in the planning process. Therefore, it is necessary to draw these flows and to describe the actors in this process. There are two main flows in the process, namely the elective and emergency flow. The elective flow enters the preoperative screening (POS) and is planned centrally or decentrally. The emergency flow directly enters a ward or OR. Figure 2 visualizes these patient flows. Each actor in process is explained in the remainder of this section.
Emergency Department Emergency Patients
Pre Operative Screening
Centralized Planning
Decentralized Planning
Ward
Operating Room Outpatient Clinic
Elective Patients
Recovery (or PACU/IC/MC) Discharge
Figure 2: OR related patient flow through MST.
2.1.1 Outpatient clinic
The outpatient clinic functions as consultation for the patient with any specialist. Therefore, the clinic is the starting point of the care path of elective patients. If the patient needs surgery, he/she will be placed on the waiting list and referred to the preoperative process. In case of a medicine patient, the patient will be planned on a bed for possible further research.
2.1.2 Emergency department
The emergency department functions as starting point for emergency patients (non-elective). Thereafter, the right specialist will be assigned to the patient and, if necessary, a surgery follows. This patient stream is difficult and actually impossible to schedule in advance, but a planner schedules capacity based on historical data.
2.1.3 Preoperative Screening
The POS collects relevant information about the patient by a questionnaire and informs the patient about the surgery. Depending on the outcome of that questionnaire, the patient may need an extra consult with an anesthesia assistant and anesthetist or physician assistant. The status is set as completed when the patient meets the required surgery condition.
2.1.4 Centralized planning
The admission planning (in Dutch: Bureau Opname) is part of preoperative process. This department schedules surgeries for surgical specialties and the department is centrally organized. The different specialties that are planned centrally are general surgery, gynecology, ear-nose-throat (ENT) surgery, ophthalmology, orthopedics, plastic surgery, and urology.
The program ORsuite is used for scheduling of patients. This program shows which specialist operates in which OR and at what time. All these aspects are imported out of BLOKplan. The medical secretaries put the availability of a specialist in BLOKplan. With this program, the admission planning plans ahead for six weeks. Moreover, the admission planning takes into account the rules for elective patient scheduling. Examples of these rules are the amount of permitted similar operations on one day, availability of resources, availability of beds and preferences of specialists. Another factor is related to time scheduling, namely the amount of time that should be scheduled in total and the amount of time that should be scheduled for emergency patients.
Each week there is a meeting about the surgeries in the week after with the aim to finalize the OR schedule. The day coordinator of the OR decides if the schedule fits, whether there are enough beds available and whether the required resources are present. Every specialty has their own characteristics according to the scheduling process. Therefore, each specialty will be described in the upcoming sections.
General surgery
General surgery consists of three subspecialties, namely traumatology, vascular surgery, and oncology. These patients are scheduled in a short time horizon or placed on a waiting list, but this depends on the urgency. Oncology patients are always planned within five weeks, because of a heavy emotional surgery. Additionally, if a patient has been scheduled in a certain block then the date of surgery will not be changed as well. These standard blocks are fixed for carotid surgery, liver surgery, thoracotomy, lobectomy, and whipple.
Gynecology
This specialty focuses on secondary obstetric care and gynecological care. The gynecology department has an outpatient OR in VKC (Vrouw Kind Centrum), but uses the general ORs as well. This specialty has a small amount of emergencies, but all of these should be incorporated in the scheduling process. In addition, oncology patients should be scheduled within five weeks. Caesarean patients have priority as well. However, in an emergency caesarean will be scheduled for one hour at the end of the elective schedule. Empty slots in the OR schedule are filled with patients from the waiting list. There is a possibility for patients that another specialist will perform the surgery such that the waiting list decreases in size.
ENT surgery
Ophthalmology
Ophthalmology surgeries focus on eye disorders. Most of the surgeries for ophthalmology are in outpatient clinics in Oldenzaal. Surgery is in Enschede if it cannot be performed by the use of drop anesthesia. Ophthalmology has an OR capacity of two days per month. Due to small OR capacity, there are long waiting lists for some surgery types. Specialists do not do each other’s surgeries within this specialty, because of possible difficulties. Therefore, the opportunity to decrease waiting lists is low.
Orthopedics
Orthopedic surgeries focus on the entire musculoskeletal system. Many fluctuations in the patient flow are present, for example emergencies and seasonality. Nowadays, waiting lists for orthopedics are short and there still is OR time left. However, departments are afraid to lose their OR time permanently thus the free time will not be given to other departments. Therefore, these other specialties are not able to decrease their waiting lists using the empty slots of orthopedics.
Plastic surgery
Plastic surgery focuses on cosmetic surgery, reconstructive surgery, hand surgery, and wrist surgery. Weekly the four specialists have one OR and each of them focuses on their own patients. They seldom have patients of other specialists, because each of the four has their own capabilities. Additionally, due to clinics at different locations it is difficult to schedule plastic surgeons at another moment in time. This specialty has to deal with emergencies as well. Frequently occurring emergencies are tendon injury and have priority over elective patients.
Urology
This specialty focuses on disorders in kidneys, ureters, bladder, prostate, urethra, and male genitalia and is located in VKC. The amount of emergencies is small and is caused mainly by oncology and urinary retention. There are reserved time slots for emergency surgeries in the upcoming two to three weeks. This specialty has a relative short waiting list, because its specialists are able to do each other’s surgeries. In addition, if there is OR time left, urologists can use this time to decrease their waiting list. Waiting lists for children’s surgeries are relatively long, because these surgeries are performed with a specialist from another hospital.
2.1.5 Decentralized planning
Specialists who are scheduled decentrally are part of special dental care, stomatology, and neurosurgery. The medical secretary of the corresponding department schedules these patients. The role of admission planning is only to communicate the final appointment with the patient. The following sections describe characteristics of each specialty that is schedule decentrally.
Special dental care
Oral and maxillofacial surgery
This specialty treated disorders in jaw and facial skeletal, and focuses on hard and soft tissues. Oncology patients need a treatment within five weeks. The amount of emergency patients for this specialty is low. Therefore, there is no OR time reserved for them. If an emergency patient arrives, an already scheduled elective patient will be cancelled. In addition, waiting lists for this specialty are long. The specialist notes whether another specialist will be allowed to operate the patient.
Neurosurgery
Neurosurgery is related to surgical treatment of disorders in the nervous system. MST treats patients out of the whole region Twente. Scheduling of these patients depends on the sequence on the waiting list and urgency, because emergency patients have higher priority. Due to a large amount of emergency patients, scheduling is done over a small time horizon. When patients are scheduled over a longer period, the number of cancellations increases and these cancellations are difficult to reschedule. Neurologists do not operate patients from other neurologists except for emergency patients. However, some specialists have a shared waiting list for corresponding patients. MST tries to reallocate the scheduling process of this specialty centrally.
2.1.6 Ward and OR
MST will start with reallocation to the new building in 2015/early 2016, which should be completely in use mid-2016. A revision of the OR schedule will be necessary in order to achieve this, because the current schedule leads to high fluctuations in bed utilization and thereby fluctuations in workload. Another option is to reallocate patients in another way without revision of OR schedule by scheduling patients based on their LoS in the current OR schedule. The current work process does not fit into the new situation due to a decreasing number of hospital beds. This section describes the structure of wards and the OR department in the old and the new situation.
Ward
Table 2 gives insight in the old and the new situation of wards. The ward of VKC is still the same in the new situation, but the general ward decreases with 80 beds. However, 11 more specific beds are available in 2016. We only focus on the surgical wards, because they are OR related.
Table 3 gives an overview of the surgical wards in the old situation.
Table 2: Number of beds in the old situation (2013), new situation (2016) and the difference between the situations.
Bed type 2013 2016 Difference
General 409 329 - 80
Specific 103 114 11
VKC 123 123 0
Day care 48 66 18
Outpatient clinic beds/chairs 19 38 19
Total 702 670 - 32
Table 3: Capacity of each ward in the old situation (2013).
Department Specialty(s) # of beds
General – A3 General surgery, oral and maxillofacial surgery 33
General – A5 Orthopedic surgery, trauma surgery 33
General – C5 Day care, short stay 33 VKC – K3 Pediatrics, ophthalmology, special dental care, urology 8
VKC – K4 Urology, ENT, gynecology 30
Total 220
The structure of wards in the new situation will change completely. There will be three floors with wards and the general intensive care (IC-A) and medium care (MC) will be located on the third floor near the ORs. Each floor will have single rooms which will be divided over different specialties. Therefore, each floor will have a spot division. Appendix A shows a map of each floor. Overlapping spots imply that a specialty is able to use capacity of another specialty, by which each department will have flexible capacity. The patient will obtain a centered position and the ward division is based on a horizontal collaboration between nurses and a vertical collaboration between specialties. Table 4 shows the location of each specialty. The available number of beds is not included, because the amount of beds is unclear yet and the capacity is flexible. VKC will continue with the same capacity at the same location.
Table 4: Location of wards in the new situation (2016).
Floor Specialty(s)
4 Oncology
4 Genecology oncology
Unknown Urology oncology
4 Vascular surgery
4 Orthopedics
4 Trauma surgery
5 Long oncology
6 Internal medicine
6 General surgery
6 Other surgery (eye, plastic)
6 Neurosurgery
VKC – K4 Genecology
VKC – K4 Urology, ENT
Total
OR
The structure of the new OR complex will be comparable with the old situation. The old situation contained four ORs for thoracic surgery, whereas in the new situation one OR of thoracic surgery will be replaced by a shared OR for general and thoracic surgery. However, the idea is that day treatment surgery will be in a separate location and will stay in the old building with its own ward and ORs. This is currently in the development phase.
Table 5: Number of ORs in the old situation (2013) and new situation (2016).
OR type # of ORs 2013 # of ORs 2016
General surgery 11 11
General surgery and thoracic surgery - 1
Specific thoracic surgery 4 3
Outpatient surgery 1 1
Currently, these ORs are scheduled according to a repetitive schedule of 4 weeks. This schedule is revised four times a year, but the changes in this schedule are minimal. As mentioned before, each week there is a meeting for the OR schedule of next week to complete the particular schedule. Nowadays, it is tried to schedule patients according to a fixed quota. This means that the number of scheduled patients should be within predefined boundaries.
2.1.7 Recovery
After surgery, the patient enters recovery. The patient is moved to the IC/MC if the patient needs intensive care. The recovery period is used to monitor the patient is able to control vital physical mechanisms. Afterwards the patient is relocated to the ward of corresponding specialty if his/her condition allows.
2.1.8 Discharge
If the physical condition is recovered to a specific level, the patient will be discharged. Depending on this condition, the patient goes home or to another location for extra medical care.
2.2
Problem identification in wards
It is necessary to identify ward related problems if we want to improve the current situation. A meeting with heads of wards was organized to identify these problems and they gave us possible solutions as well. The following sections describe the situation of each ward based on these meetings.
2.2.1 B4
Due to variety in the OR schedule (a double OR session on Monday and Thursday) the outflow of the OR is variable as well. This variability leads to fluctuations in ward utilization, but this can be dealt with by aligning the right amount of personnel. The ward planning is based on the elective patients and not on emergency patients. Moreover, the amount of pain patients leads to difficulties, because the length of stay is unclear and they need high-level care.
B4 uses 28 out of the 33 available beds. The remaining beds are used for emergency patients, because these should always be helped at B4. They can allocate patients at to the neurology department if there is lack of available resources at B4. The admission of patients is between 7:00 a.m. – 8:00 a.m. and is done by two nurses. However, all patients arrive in this period, so the waiting times often increase. Patients who are admitted on Monday will be discharged on Wednesday (if possible) and the patients who are admitted on Thursday will be discharged after the weekend. In this way, care paths of three, four or five days are created.
2.2.2 C3
C3 can handle three or four patient admissions a day, but there are about seven admissions on Thursday. An extra nurse is used to cope with this peak demand. Due to admissions, the workload in the morning is higher compared to the rest of the day.
2.2.3 C5/A3/A5
C5, A3 and A5 participated together in one meeting and discussed their wards with each other before our meeting. Difficulties arise in scheduling due to different flows from elective patients, IC, other hospitals, outpatient clinic, and acute admissions. If there is an extra OR available, the planners first consider the availability of a surgeon and second the length of a waiting list, but they do not consider the number of available beds. A fifth OR is preferred at the beginning of the week, but most of the time these wards have four ORs. Also the surgery throughput might vary over different specialists. Therefore, the outflow to wards will increase if specialists with a high throughput are scheduled at the same time.
The wards gave some preference related to scheduling of patients. First, diabetes patients should be divided over the week, because of their care level. Secondly, short stay patients of C5 have to be scheduled in the beginning of the week, since in C5 only short stay patients and day treatment patients need to bed scheduled. If the short stay patients are scheduled at the end of the week, the ward can probably not be closed on Saturday. This implies that more day treatment patients have to be scheduled at the end of the week. C5 is the day treatment ward and most of the patients have a relatively short LoS. This ward consists of 33 beds and they have about 20 new admissions a day. Additionally, A3 and A5 both have a capacity of 33 beds as well, but deal with only three or four new admissions a day.
2.2.4 K3
The main problem in K3 is the combination of different specialties (mainly pediatrics, but also ophthalmology, special dental care, and urology). It is possible that many different specialties have an OR in the beginning of the day, which increases the workload. In addition, the number of ORs differs throughout the week with peak moments on Wednesday and Thursday. A solution could be to plan less patients on Tuesday to be sure that there will be enough capacity on the next two days. However, this might lead to unoccupied beds. Additionally, the decentralized planning departments often are too late with their planning and many schedule changes are made during the week.
There are eight day treatment beds available, but the ward uses clinical beds up to a maximum of 13 beds when the demand is higher. In exceptional circumstances, C5 will be used for allocation of the older children (16/17 years).
2.2.5 K4
Gynecology and urology patients arrive at 7:00 a.m. and ENT patients arrive at 6:45 a.m. In K4 there are 30 beds available and 27/28 beds are used for elective patients. The other beds are reserved for emergencies. If there is a shortage of available resources, C5 is used as back up.
2.3
Performance indicators
Performance indicators are a useful measure to quantify the performance of ORs and wards. Cardoen et al. (2010) mentioned eight performance indicators: waiting time, throughput, utilization, leveling, makespan, patient deferrals, financial measures, and preferences. We defined indicators based on these eight indictors as well as the problem analysis above, the ORdashboard and already defined indicators of MST. We divided the indicators into two categories, namely OR and ward specific indicators.
2.3.1 OR
OR related indicators give insight in the performance of ORs. Due to a performance analysis, OR staff knows if adjustment should be made and if the current process functions according to their preferences. Performance indicators for the OR are:
Utilization is the amount of time a resource is used against the amount of time a resource is
available (Cardoen, Demeulemeester, & Beliën, 2010). ORs can be over or underutilized. Unnecessary costs are the consequence if an OR is underutilized. However, overtime and cancellations are the consequence of fully planned ORs without buffer. We describe this indicator as percentage utilization.
Throughput is the amount of treated patients per time unit (Cardoen et al., 2010). Hospitals
try to have a high throughput, but not to the expense of quality. High throughput in the ORs might have negative results in wards, because the workload of nurses increases if the throughput increases. However, increasing throughput indirectly leads to shorter waiting times. We defined number of surgeries as indicator for throughput.
Makespan is the time between the first entrance of a patient and exit of the last patient on
one day (Cardoen et al., 2010). However, an individual patient has a makespan as well, because it is the time between admission and discharge. Hospitals try to minimize the makespan. This leads to more patient satisfaction and possible higher throughput. Length of surgery time describes the makespan.
Leveling means smooth resource occupancies without peaks (Cardoen et al., 2010). This
indicator is useful in wards, because fluctuations in bed utilization probably lead to admission stops or boarding and thereby surgery cancellations. It is hard to react on fluctuations in terms of resources (i.e. employees), especially when utilization varies over a day. This results in a process of all or nothing. We describe leveling as variation in utilization.
2.3.2 Ward
Ward related performance indicators are necessary for our research as well, because the main goal is to level ward utilization. The following indicators describe the performance of wards:
Utilization, besides being performance indicator for ORs, describes the performance of wards
as well. Therefore, percentage utilization is used again.
The throughput for wards is defined as the number of admitted and discharged patients. Additionally, we use the moment of admission and discharge as performance indicator.
Leveling in wards is described as the variation in utilization.
2.4
Data analysis
Different factors influence the utilization of wards and ORs. First, we will describe the division of patients over different specialties and what type of patients needs surgery. OR related factors consist of the amount of time a specialty has available and how much of that it actually uses. For example, ward performance is described by the utilization and its corresponding variation.
We use the coefficient of variation (CV) to give insight in the variability. It is given by the following formula:
𝐶𝑉 =𝜎 𝜇
The CV is a dimensionless quantity since the standard deviation is scaled by the mean. Therefore it is independent of the unit corresponding to the quantity we are calculating the CV for. This makes CV very useful for comparing variability of different specialties and wards, each having their own different mean. Though the disadvantage is that the CV is large for means close to or equal to zero. Therefore, we draw conclusions carefully if the mean is close to zero.
2.4.1 Patient population
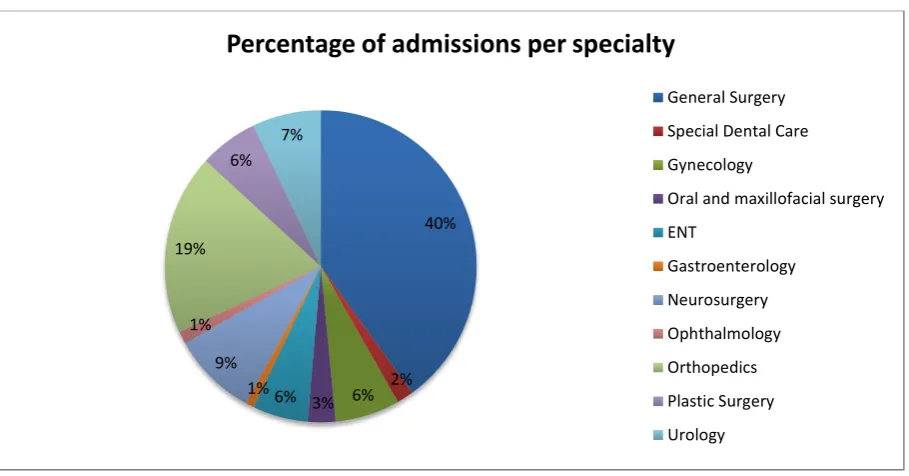
[image:31.595.72.527.479.717.2]12861 patients underwent surgery in the period from 01-05-2013 to 30-04-2014. The percentage of patients per specialty is given in Figure 3. General surgery has the highest amount of patients, namely 40%. However, this amount consists of a sub-division of three specialties: traumatology, vascular surgery, and oncology. Orthopedics obtains a high percentage as well (19%) and consists of orthopedic patients only.
Figure 3: Percentage of admissions per specialty during 01-05-2013 to 30-04-2014, n = 12861, source: ORSuite.
40%
2% 6% 3% 6% 1% 9% 1% 19%
6% 7%
Percentage of admissions per specialty
General Surgery
Special Dental Care
Gynecology
Oral and maxillofacial surgery
ENT
Gastroenterology
Neurosurgery
Ophthalmology
Orthopedics
Plastic Surgery
Each specialty treats different patient types. We divided each specialty into elective and emergency patients. Both types are sub-divided in clinical patients and day treatment patients (M10). Figure 4 shows the percentage of patient types within each specialty. In this figure each specialty sums up all patients of that particular specialty, giving a total of 100%. Combining this with Figure 3, 100% of general surgery in Figure 4 means 40% of the total patient population. According to Figure 4 the ratio of elective M10, elective clinical, and emergency patients differ per specialty. Therefore, the OR schedule should incorporate these differences to align different specialties to each other, especially when a ward consists of different specialties.
Figure 4: Percentages of patient types per specialty during 01-05-2013 to 30-04-2014, n = 12861, source: ORSuite.
From Figure 4, it can be concluded that the amount of emergency M10 patients is close to zero. Therefore, we grouped these patients together with emergency clinical into one group of emergency patients. Table 6 gives insight into the statistics for the number of emergency patients. The number of emergency patients increases during the week and the variability is the lowest at the end of the week.
Table 6: Number of emergency patients per weekday during 01-05-2013 to 30-04-2014, n = 2217, source: ORSuite.
Day Mean St. dev. CV
Ma 6,92 2,38 0,34
Di 6,65 2,27 0,34
Wo 7,74 2,78 0,36
Do 7,60 3,37 0,44
Vr 9,81 2,38 0,24
2.4.2 OR analysis
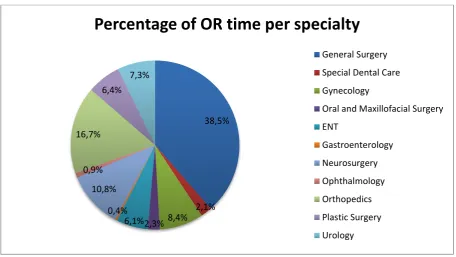
Each specialty gets their own amount of OR time based on their number of patients. Figure 5 shows the percentages of the total available OR time per specialty during one year. These percentages are comparable to the percentages of admissions in Figure 3. The differences originate for example in the surgery duration. A specialty with more complicated and longer surgeries needs more surgery time. Neurosurgery on average takes longer than surgeries of other specialties and therefore obtains
0% 10% 20% 30% 40% 50% 60% 70% 80% 90% 100%
Division of patient types per specialty
Emergency-Clinical
Emergency-M10
Elective-Clinical
Figure 5: The amount of OR time per specialty of a total 22535 hours during 01-05-2013 to 30-04-2014, source: BLOKplan.
[image:33.595.67.527.440.681.2]Specialties get their amount of OR time, but this does not mean that the total available time is used. Figure 6 shows the utilization of OR time. Utilization of many specialties is close to 90%. However, special dental care, OMS, ENT, and ophthalmology are close to 80%. A percentage of 20% of their OR time remains unused. It is remarkable that almost every specialty has about 10% or less unused OR time.
Figure 6: Average utilization of OR time during 01-05-2013 to 30-04-2014, source: ORSuite & BLOKplan.
There is variation in utilization of ORs, but the CV is low for almost all specialties. The highest variation occurs for the elective patient flow of plastic surgery. Gastroenterology has relatively high
38,5%
2,1% 8,4% 2,3% 6,1% 0,4% 10,8% 0,9% 16,7%
6,4% 7,3%
Percentage of OR time per specialty
General Surgery
Special Dental Care
Gynecology
Oral and Maxillofacial Surgery
ENT
Gastroenterology
Neurosurgery
Ophthalmology
Orthopedics
Plastic Surgery
Urology
0,00% 10,00% 20,00% 30,00% 40,00% 50,00% 60,00% 70,00% 80,00% 90,00% 100,00%
Uti
lization
OR utilization per specialty
Emergency patients
small. We can conclude that the emergency flow has a small influence in OR utilization. Therefore, we have to review the elective patient scheduling process if we want to change OR utilization.
Table 7: Coefficient of variation for utilization of ORs per specialty.
Specialty CV Elective CV Elective + Emergency
General Surgery 0,20 0,17
Special Dental Care 0,13 0,13
Gynecology 0,24 0,25
Oral and Maxillofacial Surgery 0,15 0,16
ENT 0,18 0,18
Gastroenterology 0,28 0,27
Neurosurgery 0,19 0,20
Ophthalmology 0,17 0,17
Orthopedics 0,13 0,13
Plastic Surgery 0,31 0,33
Urology 0,23 0,22
The OR utilization is mainly determined by the surgery duration. Figure 7, Figure 8 and Figure 9 give an overview of the surgery duration for all specialties. All patient types have a right-skewed graph like a lognormal distribution. Elective M10 patients have an average surgery duration of about 54 minutes and a standard deviation of 25 minutes.
Figure 7: Surgery duration for elective-M10 patients of all specialties during 01-05-2013 to 30-04-2014, n = 4251, source: ORSuite.
The frequency of elective clinical patients is more spread out. The average duration is about 108 minutes with a standard deviation of 68 minutes. These people have probably a higher care level due to longer surgery durations.
0 500 1000
10 20 30 40 50 60 70 80 90 100 110 120 130 140 015 160 170 180 190 020 210 220 230 240 250
Fr
e
q
u
e
n
cy
Surgery duration in minutes
Figure 8: Surgery duration for elective-clinical patients of all specialties during 01-05-2013 to 30-04-2014, n = 6393, source: ORSuite.
The distribution of Figure 9 is comparable with Figure 7, but the frequency is higher for longer surgery durations. Emergency patients have an average surgery duration of 79 minutes and a standard deviation of 48 minutes. M10 patients often have a lower care level than clinical or emergency patients. Therefore, it is plausible that the surgery duration is lower as well.
Figure 9: Surgery duration for emergency patients of all specialties during 01-05-2013 to 30-04-2014, n = 2217, source: ORSuite.
2.4.3 Ward analysis
Ward utilization starts with admission of patients and ends with discharge. We made these moments insightful by analyzing the data of elective patients over one year. Figure 10 shows a peak of admission at 8:00 p.m. and a peak of discharge at 12 p.m. and 15 p.m.
Figure 10: Frequency of admission and discharge at each hour of all elective patients during 01-05-2013 to 30-04-2014,
0 200 400 600 800 Fr e q u e n cy
Surgery duration in minutes
Surgery duration elective-clinical patients
0 100 200 300 Fr e q u e n cy
Surgery duration in minutes
Surgery duration emergency patients
0 1000 2000 3000 1: 00 2: 00 3: 00 4: 00 5: 00 6: 00 7: 00 8: 00 9: 00 10 :0 0 11 :0 0 12 :0 0 13 :0 0 14 :0 0 15 :0 0 16 :0 0 17 :0 0 18 :0 0 19 :0 0 20 :0 0 21 :0 0 22 :0 0 23 :0 0 0: 00 Fr e q u e n cy Time
Moment of admission and discharge of elective patients
Admission
The emergency flow is hard to regulate, because of its unpredictability. In Figure 11, you can see that the admission of emergency patients is leveled over the day. This flow does not fluctuate the workload of nurses that much, because of evenly distributed admissions.
Figure 11: Frequency of admission and discharge at each hour of all emergency patients during 01-05-2013 to 30-04-2014, n = 2219, source: Xcare.
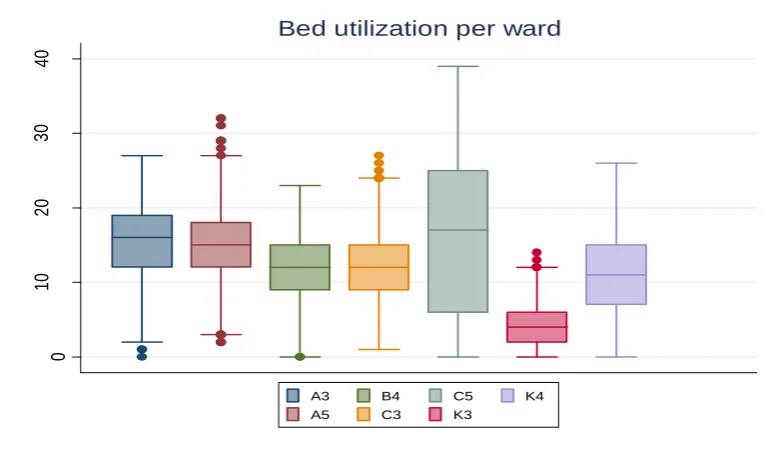
[image:36.595.74.464.419.645.2]We have to analyze the variation in wards in more detail to create an intervention that fits the requirements of MST. Figure 12 shows the utilization of wards. You can see that the variation of C5 (day treatments) is the highest. C5 and K3 are the only wards that exceed their maximum capacity of 33 and 8 beds. However, we did not consider the reuse of beds on the same day, which is probably the fact in C5. C5, K3, and K4 consist of different specialties and have a relatively large dispersion in utilization. Therefore, the alignment between specialties is probably insufficient.
Figure 12: Boxplot of the bed utilization in wards during 01-05-2013 to 30-04-2014, n = 12861, source: Xcare & ORSuite.
We will analyze ward utilization in more detail. Therefore, we created Table 8 with a statistical overview of the wards per patient type. The total CV for C5 and K3 is relatively high compared to the other wards. However, other wards obtain fluctuations as well. This is consistent with the boxplot of Figure 12. The variation for emergency patients is high as well, but the mean is small. Therefore, the impact of this flow is relative small. Elective clinical patients increase the fluctuations at the C5 and
0 200 400 600 1: 00 2: 00 3: 00 4: 00 5: 00 6: 00 7: 00 8: 00 9: 00 10 :0 0 11 :0 0 12 :00 13 :0 0 14 :0 0 15 :0 0 16 :0 0 17 :0 0 18 :0 0 19 :0 0 20 :0 0 21 :0 0 22 :0 0 23 :0 0 0: 00 Fr e q u e n cy Time
Moment of admission and discharge of emergency patients
Admission Discharge 0 10 20 30 40 # of b ed s
Bed utilization per ward
Table 8: Mean, standard deviation, and CV for utilization per ward per patient type during 01-05-2013 to 30-04-2014, n=12861, source: Xcare & ORSuite.
Ward Elective M10 Elective Clinical Emergency Total
Mean St. dev CV Mean St. dev CV Mean St. dev CV Mean St. dev CV A3 0,06 0,23 4,06 13,27 5,02 0,38 1,97 1,93 0,98 15,30 5,17 0,34 A5 0,11 0,41 3,83 13,15 4,40 0,33 1,68 2,13 1,27 14,93 5,30 0,36 B4 0,20 0,57 2,85 10,13 4,16 0,41 1,66 1,32 0,80 11,99 4,30 0,36 C3 0,04 0,25 6,03 8,88 3,41 0,38 3,45 2,77 0,80 12,37 4,70 0,38 C5 8,72 6,88 0,79 7,16 5,72 0,80 0,34 0,59 1,74 16,21 11,00 0,68 K3 1,84 2,09 1,14 1,43 1,45 1,01 1,13 1,15 1,02 4,40 2,94 0,67 K4 0,90 1,35 1,50 9,33 4,56 0,49 0,66 0,82 1,24 10,89 5,31 0,49
We mentioned earlier that the number of patients does not exceed the maximum capacity in most wards, but Appendix B shows that many wards treated patients of another specialty. This means that there are boarded patients and thereby probably overutilized wards or incorrectly marked treatment codes, though medical patients can cause boarding as well. Appendix C shows the utilization per ward during the first quarter of 2014. You can see that there are fluctuations in each ward during this period. These figures also show the number of admissions during this period. It seems like the curves of utilization and admissions match. The correlation coefficient between admission and utilization confirms this, especially for C5, K3, and K4 (see Table 9). We can tentatively conclude that, when we regulate admissions we can regulate the utilization of wards.
Table 9: Correlation between utilization and admissions in wards during 01-05-2013 to 30-04-2014, n = 10642, source: Xcare.
Ward Correlation coefficient
A3 0,38
A5 0,49
B4 0,56
C3 0,41
C5 0,94
K3 0,89
K4 0,76