University of Warwick institutional repository: http://go.warwick.ac.uk/wrap
This paper is made available online in accordance with publisher policies. Please scroll down to view the document itself. Please refer to the repository record for this item and our policy information available from the repository home page for further information.
To see the final version of this paper please visit the publisher’s website. Access to the published version may require a subscription.
Author(s): Paolo Martini
Article Title: System identification in Priming of Pop-Out Year of publication: 2010
Link to published article:
http://dx.doi.org/10.1016/j.visres.2010.07.024
SYSTEMIDENTIFICATIONINPRIMINGOFPOPOUT
Paolo Martini
Department of Psychology, University of Warwick
Corresponding Author: Paolo Martini, p.martini@warwick.ac.uk
ABSTRACT
Inter-trial repetitions of a target’s features in a visual search task reduce the time needed to find
the target. Here I examine these sequential dependencies in the Priming of Pop Out task (PoP) by
means of system identification techniques. The results are as follows. Response time facilitation
due to repetition of the target’s features increases linearly with difficulty in segmenting the target
from the distracters. However, z-scoring the reaction times normalizes responses by equating
facilitation across levels of difficulty. Memory kernels, representing the influence of the current
trial on any future trial, can then be calculated from data normalized and averaged across
conditions and observers. The average target-defining feature kernel and the target position
kernel are well fit by a sum-of-two-exponentials model, comprised of a high-gain, fast-decay
component and a low-gain, slow-decay component. In contrast, the average response-defining
feature kernel is well fit by a single exponential model with very low gain and decay similar to
the slow component of the target-defining feature kernel. Analysis of single participant’s data
reveals that a fast-decay component is often also present for the response-defining feature, but
can be either facilitatory or inhibitory and thus tends to cancel out in pooled data. Overall, the
results are similar to integration functions of reward history recently observed in primates during
frequency-matching experiments. I speculate that sequential dependencies in PoP result from
learning mechanisms that bias the attentional weighting of certain aspects of the stimulus in an
ACKNOWLEDGMENTS
Address for correspondence: Paolo Martini, Department of Psychology, The University of
Warwick, Gibbet Hill Road, Coventry, CV4 7AL, UK; e-mail: p.martini@warwick.ac.uk. I thank Vera Maljkovic and Liz Blagrove for agreeing to participate in this study as observers.
INTRODUCTION
Inter-trial repetitions of a target’s features in a visual search task reduce the time needed
to find the target relative to the series’ average, whereas alternations tend to increase it
(Maljkovic & Nakayama, 1994). By adopting a form of reverse correlation analysis of reaction
times and stimulus sequences, Maljkovic and Nakayama computed kernel functions for such
sequential effects in the Priming of Pop-out task (PoP), documenting the influence that a current
trial exerts on future trials. Subsequent studies (Kristjansson, 2008, Maljkovic & Martini, 2005,
Maljkovic & Nakayama, 1996, Maljkovic & Nakayama, 2000) have mapped a variety of
conditions that alter the characteristics of such kernels in varying degrees. However, a
quantitative modeling of such dependencies has yet to be attempted and there appears to be no
general consensus on the interpretation of the nature and the functional significance of the
sequential dependencies observed in PoP. Proceeding from these observations, the goal of the
present study is two-fold: firstly, to provide a quantitative characterization of PoP kernels and
secondly to propose a new theoretical account of their nature and functional significance. To
such effect, I chose to study the effect of stimulus contrast on PoP. Varying stimulus contrast is a
means to manipulate difficulty in segmenting the target from the distracters and here I show that
the magnitude of sequential dependencies depends on difficulty. As such, manipulations of
contrast provide a way of exploring the dynamic range of the sequential effects.
The plan of the paper is as follows. I start by demonstrating a way to normalize responses
across conditions and across observers, showing that z-scoring the reaction times removes the
effect of task difficulty on the magnitude of response facilitation. I then identify the system in
cross-correlation; secondly, I fit a parametric model to the recovered kernels averaged across
observers. I then conduct similar analyses on data from single observers and discuss individual
differences. Finally, I discuss functional implications of the modeling.
METHODS
Participants. 47 undergraduate students participated in the experiment for course credit. Three
additional experienced observers were also tested: observers PM (the Author) and VM have
several years of practice in the task and were aware of the purpose of the experiment, whereas
LB is an experienced psychophysical observer, but was unaware of the scope of the experiment
[image:6.612.205.406.353.471.2]she was running.
Figure 1. Example of stimuli used in the experiment. Participants responded by pressing a key with the
hand corresponding to the side of the cut in the odd-colored diamond.
Stimuli. Three diamonds (1.0˚ x 1.0˚), each with a cutoff (.14˚) on the left or right side, were
presented on an imaginary ellipse (10˚ x 8˚) and spaced equidistantly, such that they fell on three
of 12 possible clock positions (see figure 1). All spatial configurations were covered uniformly
across trials by random choice. The color of each diamond was either a grayscale increment or a
were used for naïve participants and two additional steps of 20 and 80% for the experienced
observers. The target diamond was a different color than the two remaining distracters. Each
display always had a left and a right side cut distracter, while the target cut was chosen randomly
on each trial. The displays were presented on a CRT monitor at a refresh rate of 120 Hz, with a
fixation point always present at the center.
Procedure.
On each trial, participants selected the odd-colored diamond and pressed as quickly as possible a
key on the computer’s keyboard (USB interface) with the hand corresponding to the side of the
target’s cut. Stimuli stayed on-screen until a response was entered. An inter-trial interval
followed, with duration chosen randomly from a uniform distribution between 600 and 1100 ms.
Response times were collected during uninterrupted series of 500 trials. Each naïve participant
completed 3 series of responses separated by brief interruptions, one for each contrast level in
randomized order. The three experienced observers completed several sessions of testing across
different days. Target color (bright or dark), side of cut (left or right) and position (one of twelve
clock locations) alternated randomly, independently and with equal probabilities across trials. As
such, each sequence is a sample of uncorrelated noise.
Data Analysis.
The aim of this study is to recover the best linear predictor of the response times to a sequence of
stimulus features in the search task. When the input time series is uncorrelated noise this can be
achieved conveniently by cross-correlation (Marmarelis & Marmarelis, 1978). The recovered
response time series up to an error. The residual error may still contain dynamics of higher order
that are ignored in the present analysis. First order kernels for the target-selecting feature (color),
for the target’s position and for the response-selecting feature (cut-off side) were computed from
the reaction time series. For each participant, each individual reaction time series was first
de-trended up to second order. Separate sub-series were then formed, two comprising only reaction
times to bright or dark targets, two for left or right responses and twelve for the target’s
positions. Each reaction time was then z-scored (mean subtracted and divided by the standard
deviation) and empty cells were assigned the value zero. Corresponding [0,1] binary stimulus
sub-series were also formed, assigning the value 1 to trials containing the feature, response or
position of interest. Kernels were then recovered by cross-correlating the reaction time sub-series
with the corresponding stimulus sub-series and by scaling the result by the inverse of the
stimulus series’ power. Justification and a model for such computation was given in (Maljkovic
& Martini, 2005). Further computational details may be found in (Marmarelis & Berger, 2005).
For each individual observer, the pairs of kernels for colour (bright and dark) and response (left
and right) and the twelve position kernels were averaged, and finally the resulting average
kernels were averaged again across observers. Following this initial nonparametric analysis, a
parametric model was fitted by non-linear regression to each recovered kernel, obtaining
RESULTS
Contrast dependence and kernel normalization
Finding the pop-out target is more difficult at low than at high contrast, as evidenced by
the fact that responses are slower on average and more variable the lower the contrast (mean and
[image:9.612.209.385.219.349.2]SD, figure 2).
Figure 2. Summary statistics for reaction times at different contrasts. Mean and standard deviation of reaction times and lag-1 facilitation for repetition of the selection-defining feature decrease with increasing contrast. Data are averages across all observers.
Kernels for the target-defining feature are also affected by contrast. The facilitatory effect
of repeating the target-defining feature depends on difficulty, lag-1 facilitation being larger at
low than at high contrast (lag 1, figure 2). Shown in figure 3 are target-defining feature kernels
averaged across participants, for the three levels of contrast tested in the experiment. The
diagrams represent the amount of facilitation (speeding up) of a response to a bright or dark
target encountered in a future trial, elicited by a bright or dark target encountered in the current
trial. A similar pattern is observed across contrast levels: facilitation is maximal in the
immediately following trial (lag-1) and decays to average response time in about 10-15 trials.
However, facilitation tends to decrease with increasing contrast, following a similar trend as the
The effect of contrast on all three statistics (mean, SD and sequential dependencies) is
systematic, with regression slopes on the log-log-transformed data of figure 2 of -0.086, but only
[image:10.612.82.523.157.318.2]marginally significant (p<0.1).
Figure 3. Average selection-defining feature kernels for the 3 contrast levels used in the study. All kernels are heavy-tailed facilitation functions, with an initial fast decay followed by a slow decay to average response time in about 10-15 trials. Notice the progressive attenuation with increasing contrast, evident particularly a lag 1. Errors are 95% C.I.
The relationships between sequential effects, mean and standard deviation of response
times are further examined in the scatterplots of figure 4. Individual dots in each graph represent
a summary statistic calculated on a block of responses at a single contrast level from a single
participant. Replicating a well-known finding (Wagenmakers & Brown, 2007), the standard
deviation of the response times (figure 4, left panel) is linearly and very highly correlated with
mean reaction time (r=0.88, p<.0001). As expected from its dependence on contrast, also lag-1
facilitation (figure 4, middle panel) correlates significantly with mean reaction time (r=0.5,
p<0.0001). However, Z-scoring each reaction time series normalizes responses (figure 4, right
In summary, facilitation appears to increase with difficulty in segmenting the target from
the distracters, but such effect is canceled by taking into account corresponding increases in
variance. This may be an uninteresting result from a theoretical perspective, suggesting that
whatever mechanism is responsible for increasing the variance of reaction times proportionally
to the mean also increases proportionally the magnitude of sequential dependencies. However, it
[image:11.612.88.516.252.395.2]is of practical value inasmuch as it suggests a useful method of normalization.
Figure 4. Scatterplots of data pooled across participants and contrast levels. Solid lines through the data are LOWESS splines. On the left, the standard deviation of the response times for each contrast level and each participant is plotted as a function of the mean response time; the correlation between standard deviation and mean RT is very high (r=0.88, p<.0001). Middle, lag-1 facilitation is correlated with the mean (r=0.5, p<0.0001). Right, lag-1 facilitation calculated on z-scored data does not correlate with the mean (r=-.09, p>0.10).
Average kernels
The effectiveness of z-scoring as a normalization procedure justifies pooling the data
across all contrast levels and participants, thus allowing for the computation of the average
kernels shown in figure 5. The recovered kernels were modeled as the sum of two exponential
functions:
y w1exp x
1
w2exp x
2
Equation 1 was fitted to the data by non-linear regression.
For the target-defining feature (figure 5, left) and the target position (figure 5, right), the
obtained best fitting parameters indicate a fast-decay component with a time constant less than
one trial (selection feature: w1=1.33 0.14, 1=0.79 0.1; target position: w1=0.52 0.4,
1=0.65 0.37) and a slow-decay component with a time constant of about 5 trials and a much
smaller gain (selection feature: w2=0.14 0.14, 2=4.2 1.0; target position: w2=0.09 0.03,
2=6.3 2.0). The best fitting model for the response-defining feature kernel is instead a single
exponential function, with decay constant similar to the slow-decay component of the
[image:12.612.83.520.334.498.2]selection-defining feature kernel, but even lower gain (w2=0.05 0.01, 2=4.6 1.15).
Figure 5. Kernels for the selection-defining feature (left), the response-defining feature (middle) and target position (right) computed on z-scored data and averaged across contrast levels and participants. Errors are 95% C.I. The solid line through the data is a sum of two exponentials model for the selection feature and target position and single exponential for the response feature.
Single participant kernels
Kernel analyses for colour and response were also carried out on the data obtained from
three experienced observers, shown in figure 6. Individual kernels for the selection-defining
feature are very heterogeneous and well modeled by a sum of two exponential functions, unlike
the pooled data. Model’s parameters are reported in Table 1. Characteristically, the fast-decay
component of the model has positive or negative gain in different observers. In addition, the slow
[image:13.612.82.522.191.454.2]component appears to extend to longer lags in practiced versus naïve observers.
[image:13.612.71.528.562.692.2]Figure 6. Kernels for the selection-defining feature and the response-defining feature computed from the z-scored data of 3 individual observers. Solid lines are sum of exponentials models and errors are 95% C.I.
Table 1. Model’s parameters for single observers.
Observer Feature W1 T1 w2 T2
PM Colour 1.2±0.25 0.9±0.2 0.17±0.06 6.9±1.9
Response -0.48±0.08 1.42±0.4 0.1±0.04 10.7±3.8
VM Colour 0.43±0.31 0.78±0.5 0.14±0.03 8.4±1.9
Response -1.0±0.6 0.64±0.4 0.5±0.4 1.9±0.7
LB Colour 0.24±0.05 1.7±0.77 0.07±0.05 9.5±4.4
Discussion
Relation to previous studies of PoP
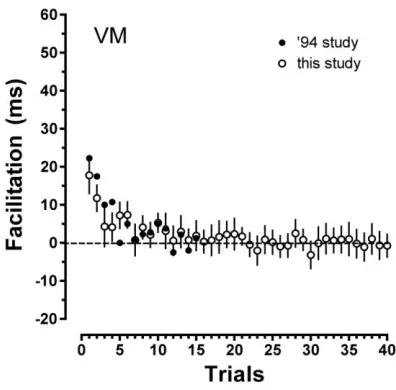
The original study of (Maljkovic & Nakayama, 1994) reported kernels for
selection-defining features computed on data from a small number of individual observers, including VM,
the first Author of that study. There is remarkable agreement between the selection-defining
kernels of observer VM computed in the original and the present study after a 15 years period
(see figure 7). This is just one example of a general observation that selection-defining feature
kernels appear stable and homogenous across different display conditions, temporal delays and
[image:14.612.200.398.381.576.2]observers, particularly when normalization measures, such as z-scoring, are applied.
Figure 7.Selection-defining feature kernels for participant VM. Empty symbols are data from this study, solid symbols reproduce data from figure 9 of (Maljkovic & Nakayama, 1994).
In contrast, (Maljkovic & Nakayama, 1994) reported no convincing evidence for the
Martini, 2005). This issue was reexamined by (Goolsby & Suzuki, 2001): they documented a
small, but reliable response-defining feature kernel in pooled data and the present study agrees
with their finding. Reliable quantification of response-defining feature kernels is complicated by
the small effect size and low signal/noise ratios, by the presence of stimulus-response
compatibility effects (note that responses in (Maljkovic & Nakayama, 1994) were unimanual and
therefore partially S-R incompatible, whereas in the present study and in (Goolsby & Suzuki,
2001) they were bimanual and S-R compatible) and by large heterogeneities found across
observers, particularly at lags shorter than three. These complications have affected past, and will
continue to affect future investigations of the response-defining feature kernel.
Parametric modeling of kernels
Extant studies of PoP have not attempted to quantify the recovered kernels by explicit
modeling. The only possible exception is the study of (Maljkovic & Martini, 2005), limited to a
single observer, where the selection-defining feature kernel was modeled as a single exponential
function. Except in the case of the response-defining feature kernel for the average data, a single
exponential function is not an adequate model for the present data: the best-fit solution of such
model tends to under-fit data at short and long lags and to over-fit them at intermediate lags. The
pattern observed in the data, i.e. an initial fast decay followed by a fat tail, is more consistent
with a power type relationship. The model proposed here, i.e. the sum of two exponentials,
approximates a power type function, but retains the advantage of having a finite memory.
Whether the two exponential components of the model reflect two real, independent mechanisms
can at present only be a matter of speculation. It is possible that the initial fast-decay component
For example, (Maljkovic & Nakayama, 2000) reported explicit memory for the features of up to
two trials in the past. Consistent with the idea of a separable fast-decay component is the
observation that the kernel for the response-defining feature is maximally heterogeneous across
observers in the initial ~3 lags, varying between inhibition and facilitation, whereas later lags
tend to uniformity by showing always a consistent, albeit small, facilitatory tail. Note also that
the time constant of the slow component is significantly longer in practiced than naïve observers,
suggesting some plasticity due to training. It remains for future studies to explore the possibility
of selectively manipulating performance in different lags’ ranges, thereby establishing whether
the proposed kernel’s fractionation reflects true separate influences or is simply a convenient
modeling exercise.
Similarities beetween PoP and other sequential dependencies
The study of sequential dependencies in behavioral data has a long history. Looking
beyond the PoP task, sequentially dependent behaviour has been observed in virtually every
choice task studied, including production of random data (Goodfellow, 1938, Hagelbarger, 1956,
Skinner, 1942), detection of liminal signals (Senders & Sowards, 1952, Verplanck, Collier &
Cotton, 1952), speeded choice among alternatives (Bertelson, 1965, Laming, 1969), magnitude
estimation (DeCarlo & Cross, 1990), categorization (Stewart, Brown & Chater, 2002),
sensori-motor adaptation (Baddeley, Ingram & Miall, 2003) and reward-contingent choice (Corrado,
Sugrue, Seung & Newsome, 2005, Hunter & Davison, 1985, Lau & Glimcher, 2005). The list is
certainly not exhaustive, but in all these instances the observed pattern of sequential
dependencies can be reduced to two common types, classically known as “contrast” and
tendency to alternate, whereas assimilation indicates positive correlation and reflects a tendency
to persist. PoP kernels are mostly of the assimilation type, but the inhibitory component
sometimes present in the response-defining feature kernel is clearly an example of a contrastive
influence.
Two recent investigations of the mechanisms for integration of rewards (Corrado et al.,
2005, Lau & Glimcher, 2005) come the closest, in terms of task demands and analytical
methods, to the study of kernels in PoP. The similarity between the kernels retrieved in those
studies and the present study is intriguing: both reward studies reported heavy-tailed kernels for
reward and heterogenous kernels for response. Is this simply a fortuitous similarity?
Prediction and learning in PoP
Ideas from behavior, neuroscience and machine learning have been brought together into
a coherent explanatory framework for kernels observed in reward-contingent behavior,
understood as the result of reinforcement learning (Sugrue, Corrado & Newsome, 2005, Sutton
& Barto, 1998). Central to this type of theories is the concept of temporal difference learning,
where choices are driven by a value function that is iteratively updated on every trial. Learning
proceeds by minimizing a prediction error, adding to the value function at every trial a weighted
difference between the reward received and the previously expected value. The prediction error
acts as a teaching signal, such that learning can proceed unsupervised.
In contrast, sequential dependencies in visual search have been interpreted as a form of
implicit short-term memory that biases attentional weights for certain aspects of the stimulus
(Maljkovic & Nakayama, 2000). Note, however, that the characterization of the kernel as a
stimulus’ feature increases attention toward that feature leaves unanswered the question as to
why it should be so: why isn’t attention reduced, rather than increased by repetition?
I suggest that a coherent framework to explain kernels in PoP can be articulated by
considering task goals and ecological contingencies. Finding a target among distractors may
benefit from learning about the regularities in the distribution of the items. By exploiting such
regularities the observer can anticipate the most likely stimulus configuration in the upcoming
trial, thus speeding up responses. The assumption here is that such regularities do exist, but this
is not often the case in laboratory tasks: in the classic PoP task, for example, all stimulus features
are equiprobable and alternate randomly. Yet, in nature completely random time series are the
exception rather than the norm, as attested by the observation of widespread 1/f-type spectra
(Hurst, Black & Simaika, 1965). Not only are most natural time series temporally correlated, but
also the spatial distribution of resources is often patchy (Taylor, Woiwod & Perry, 1978), such
that exploration of the environment also results in sequences of correlated encounters. As such,
prediction is clearly attainable in ecological settings and predictive tendencies are likely to be the
evolved operational default of behaving organisms.
These considerations suggest that kernels in PoP may reflect a similar prediction
algorithm as that postulated to exist for reward. The suggestion here is that value functions,
computed by means of unsupervised learning through a prediction error signal, may drive the
attentional weight given to stimulus features and thus affect the speed of response. In classic
temporal difference learning algorithms (Sutton & Barto, 1998), iterative value updating by a
prediction error signal leads to exponentially discounted kernels. The observation that PoP
kernels may have two exponential components suggests that the values of alternatives are
Similar suggestions have been made in the reward and decision-making literature (McClure,
Ericson, Laibson, Loewenstein & Cohen, 2007, Rustichini, 2008). Bringing the sequential effects
observed in PoP under the general umbrella of reinforcement learning and decision-making
highlights the commonalities between fluctuations of attentional weights and of motivational
salience (Maunsell, 2004) and suggests testable predictions about mechanisms and neural
structures.
References
Baddeley, R.J., Ingram, H.A., & Miall, R.C. (2003). System identification applied to a visuomotor task: Near-optimal human performance in a noisy changing task. Journal of
Neuroscience, 23 (7), 3066-3075.
Bertelson, P. (1965). Serial choice reaction-time as a function of response versus signal-and-response repetition. Nature, 206 (980), 217-218.
Corrado, G.S., Sugrue, L.P., Seung, H.S., & Newsome, W.T. (2005). Linear-nonlinear-Poisson models of primate choice dynamics. Journal of the Experimental Analysis of Behavior, 84 (3), 581-617.
DeCarlo, L.T., & Cross, D.V. (1990). Sequential effects in magnitude scaling: Models and theory. Journal of Experimental Psychology: General, 119 (4), 375-396.
Goodfellow, L.D. (1938). A psychological interpretation of the results of the Zenith radio experiments in telepathy. Journal of Experimental Psychology, 23 (6), 601-632.
Goolsby, B.A., & Suzuki, S. (2001). Understanding priming of color-singleton search: Roles of attention at encoding and "retrieval." Perception & Psychophysics, 63 (6), 929-944.
Hagelbarger, D.W. (1956). SEER, A SEquence Extrapolating Robot. IRE Transactions on
Electronic Computers, EC-5 (1), 1-7.
Hunter, I., & Davison, M. (1985). Determination of a behavioral transfer function: White-noise analysis of session-to-session response-ratio dynamics on concurrent VI VI schedules. Journal of
Hurst, H.E., Black, R.P., & Simaika, Y.M. (1965). Long-term storage, an experimental study. (pp. xiv, 145 p.). London,: Constable.
Kristjansson, A. (2008). "I know what you did on the last trial"--a selective review of research on priming in visual search. Front Biosci, 13, 1171-1181.
Laming, D.R. (1969). Subjective probability in choice-reaction experiments. Journal of
Mathematical Psychology, 6 (1), 81-120.
Lau, B., & Glimcher, P.W. (2005). Dynamic response-by-response models of matching behavior in rhesus monkeys. Journal of the Experimental Analysis of Behavior, 84 (3), 555-579.
Maljkovic, V., & Martini, P. (2005). Implicit short-term memory and event frequency effects in visual search. Vision Research, 45 (21), 2831-2846.
Maljkovic, V., & Nakayama, K. (1994). Priming of pop-out: I. Role of features. Memory &
Cognition, 22 (6), 657-672.
Maljkovic, V., & Nakayama, K. (1996). Priming of pop-out: II. The role of position. 1996.
Perception & Psychophysics, 58 (7), 977-991.
Maljkovic, V., & Nakayama, K. (2000). Priming of pop-out: III. A short-term implicit memory system beneficial for rapid target selection. Visual Cognition, 7 (5), 571-595.
Marmarelis, P.Z., & Marmarelis, V.Z. (1978). Analysis of physiological systems : the white-noise approach. (pp. xvi, 487). New York: Plenum Press.
Marmarelis, V.Z., & Berger, T.W. (2005). General methodology for nonlinear modeling of neural systems with Poisson point-process inputs. Math Biosci, 196 (1), 1-13.
Maunsell, J.H. (2004). Neuronal representations of cognitive state: reward or attention? Trends
Cogn Sci, 8 (6), 261-265.
McClure, S.M., Ericson, K.M., Laibson, D.I., Loewenstein, G., & Cohen, J.D. (2007). Time discounting for primary rewards. J Neurosci, 27 (21), 5796-5804.
Rustichini, A. (2008). Dual or unitary system? Two alternative models of decision making. Cogn
Affect Behav Neurosci, 8 (4), 355-362.
Senders, V.L., & Sowards, A. (1952). Analysis of response sequences in the setting of a psychophysical experiment. 1952. American Journal of Psychology, 65, 358-374.
Skinner, B.F. (1942). The processes involved in the repeated guessing of alternatives. Journal of
Stewart, N., Brown, G.D.A., & Chater, N. (2002). Sequence effects in categorization of simple perceptual stimuli. 2002. Journal of Experimental Psychology: Learning, Memory, and
Cognition, 28 (1), 3-11.
Sugrue, L.P., Corrado, G.S., & Newsome, W.T. (2005). Choosing the greater of two goods: Neural currencies for valuation and decision making. Nature Reviews Neuroscience, 6 (5), 363-375.
Sutton, R.S., & Barto, A.G. (1998). Reinforcement learning : an introduction. (pp. xviii, 322 p.). Cambridge, Mass.: MIT Press.
Taylor, L.R., Woiwod, I.P., & Perry, J.N. (1978). Density-Dependence of Spatial Behavior and Rarity of Randomness. Journal of Animal Ecology, 47 (2), 383-406.
Treisman, M., & Faulkner, A. (1984). The setting and maintenance of criteria representing levels of confidence. Journal of Experimental Psychology: Human Perception and Performance, 10 (1), 119-139.
Verplanck, W.S., Collier, G.H., & Cotton, J.W. (1952). Nonindependence of successive
responses in measurements of the visual threshold. Journal of Experimental Psychology, 44 (4), 273-282.