A Thesis Submitted for the Degree of PhD at the University of Warwick
http://go.warwick.ac.uk/wrap/36373
This thesis is made available online and is protected by original copyright. Please scroll down to view the document itself.
TRADE AND ENVIRONMENTAL ISSUES
BY
LISANDRO ESTEBAN ABREGO-CARDOZA
THESIS SUBMITTED FOR THE DEGREE OF DOCTOR OF PHILOSOPHY
UNIVERSITY OF WARWICK
DEPARTMENT OF ECONOMICS
and my parents Adan and Rosalia
LIST OF TABLES vii
Abstract viii
Introduction viii
Chapter
1. GENERAL EQUILIBRIUM ANALYSIS OF TRADE AND INDIRECT
TAX REFORM IN EL SALVADOR 1
1.1 Some Aspects of Structural Adjustment Reform in El Salvador . 4
1.1.1 Trade and Exchange Rate Policy 4
1.1.2 Taxation 7
1.2 The Model 8
1.2.1 Supply 9
1.2.2 Demand 11
1.2.3 Prices 13
1.2.4 Income 15
1.2.5 Market Clearing Conditions 16
1.2.6 Macroeconomic Closure 17
1.3 Data and Model Calibration 18
1.4 Simulation Results 23
1.4.1 Trade Liberalisation 23
1.4.2 Increased Value-Added Taxation 32
1.5 Concluding Remarks 35
2. TRADE LIBERALISATION IN THE PRESENCE OF FOREIGN
DI-RECT INVESTMENT AND TAX CREDITS 39
2.1 Tariffs, Capital Flows and Welfare 42
2.2 Recent Trade and Foreign Investment Policy in Costa Rica . . . 45 2.3 A Trade Model with Foreign Direct Investment and Capital Income
Taxation 49
2.3.1 Production 50
2.3.2 Capital Income Taxation and Factor Allocation 52
2.3.3 Consumption and Trade 53
2.3.4 Income 54
2.5 Simulation Results 61
2.6 Summary and Conclusions 69
3. LABOUR MARKET INSTITUTIONS AND DECOMPOSITION OF
WAGE INEQUALITY OUTCOMES 72
3.1 A Brief Review of the Literature* 76
3.2 A Model for Decomposition Analysis 81
3.2.1 Preferences 84
3.2.2 Production 85
3.2.3 Labour Markets 86
3.2.4 Market Clearing for Goods 87
3.2.5 Functional Forms 88
3.3 Data and Parameter Calibration 90
3.4 Simulation Results 93
3.4.1 Central Case Results 93
3.4.2 Sensitivity Analysis 96
3.5 Summary and Conclusions 98
4. TRADE AND ENVIRONMENT: BARGAINING OUTCOMES FROM
LINKED NEGOTIATIONS 101
4.1 A Two-Region Trade and Environment Model 107
4.1.1 Production 108
4.1.2 Prices and Environmental Taxes 108
4.1.3 Environmental Quality 110
4.1.4 Trade and Demand 111
4.1.5 Market Equilibrium 112
4.1.6 Choice of Functional Form 112
4.1.7 Policy Games in the Model 113
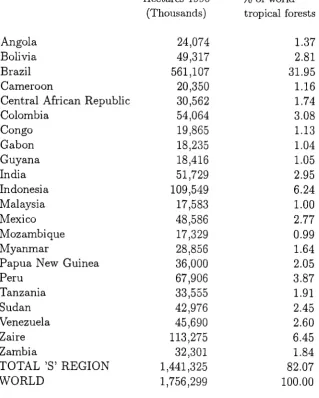
4.2 Data and Model Parameterisation 116
4.3 Simulations and Results 121
4.4 Concluding Remarks 129
5. ADAPTATION, INTERNALISATION AND ENVIRONMENTAL
EXTERNALITIES 132
5.1 Internalising Congestion Externalities in the Presence of Labour
Market Adaptation Responses 136
5.1.1 Labour-Leisure Response 137
5.1.2 Interregional Labour Locational Response 144
6. SUMMARY AND CONCLUSIONS 165
References 169
Table Page 1. El Salvador: Nominal and Effective Tariff Protection 6 2. El Salvador: Benchmark Selected Model Parameters 21 3. El Salvador: Welfare and GDP Impact of Alternative Tariff Changes . 24 4. El Salvador: Distribution Effects of Full Tariff Elimination 26 5. El Salvador: Selected Macroeconomic Effects of Trade Liberalisation . 28 6. El Salvador: Trade Liberalisation Effects with Endogenous Foreign Savings 31 7. El Salvador: Macroeconomic and Distribution Effects of Increasing VAT 33 8. Nominal Import-Tariff Protection in Costa Rica 46
9. Selected Benchmark Data for Costa Rica 59
10. Selected Benchmark Data for OECD Countries Using Tax Credits . 60 11. Costa Rica: Trade Liberalisation Effects and Optimal Tariff Structure 62 12. Costa Rica: Sensitivity Analysis on Trade Elasticities* 65 13. Cota Rica: Sensitivity Analyses on Capital Elasticities* 66 14. Central Case Parameters for UK Decomposition Model 91 15. UK Wage Inequality and Unemployment Decomposition: Central Case 93 16. UK Decomposition Model: Central Case Sectoral Effects 94 17. Ranges for Trade Contribution to UK Wage Inequality 97 18. Countries in the `S' Region in the Model and Their Tropical Forest Cover 117 19. Production Data Used in Trade and Environment Model 119 20. Parameters for Trade and Environment Model 119 21. Trade and Environment Bargaining: Central Case Results 123 22. Trade and Environment Bargaining with and without Side Payments 126 23. Trade and Environment Bargaining: Sensitivity Analyses on Trade
Elas-ticities 128
24. Trade and Environment Bargaining: Sensitivity Analyses on Damage and
Existence Value 128
27. Internalising Congestion Externalities with Interregional Labour Mobility 148 28. Sensitivity Analyses for Model with Interregional Labour Mobility . . . 150 29. Internalisation with Regional House Price Effects 154 30. Sensitivity Analyses for Model with Regional House Price Effects . . . 155 31. Comparing Results of Internalisation with and without House Price Effects 156 32. Internalisation Effects in a Model with Production-Based Damage . . . 163
This thesis uses general-equilibrium numerical-simulation techniques to analyse trade and environmental issues. It tries to take applied general equilibrium modelling in these areas beyond their traditional confines in a number of ways. These include endogenous incorporation of international capital flows into trade models, decompo-sition of observed economic outcomes, and computation of bargaining solutions and non-cooperative equilibria. Chapter 1 analyses the welfare, income distribution and macroeconomic implications of trade liberalisation and increased indirect taxation in El Salvador. It is found that these policies have little effect on welfare and in-come distribution, but a significant impact on macroeconomic aggregates. Chapter 2 examines trade liberalisation when foreign direct investment (FDI) flows and inter-national capital income taxation are present, using data for Costa Rica. The main finding is that, once FDI flows and its taxation are taken into consideration, trade liberalisation can hurt a small open economy, whose optimal policy is no longer free trade but a combination of taxes and subsidies on imports. Chapter 3 deals with the decomposition into trade and technology constituents parts of recent increased wage inequality in the UK. It analyses how decomposition is affected by the way in which labour markets are modelled. It is found that when labour markets are perfectly competitive, the main force behind increased wage inequality is technological change, with trade playing only a small role; but when labour market inflexibilities are taken into account, any of the two factors considered can become dominant, depending on the parameter specification used in the model. Chapter 4 examines the incentives for developing-country participation in possible future negotiation on trade and the environment, assumed to break down on North-South lines. It finds that developing countries will do better if they negotiate jointly on trade and environmental policies than if they negotiate over trade policy only. However, negotiations accompanied with side payments of cash will be even better for them. Finally, Chapter 5 analyses the role of adaptation responses to damage from externalities. Using a hierarchy of models calibrated to UK data, we compare internalisation effects in the presence of these responses with a case where they are absent. We find that taking account of adaptation responses significantly reduces the level of full-internalisation taxes and the associated welfare gains from externality correction.
There has been ample use of applied general equilibrium (AGE) models to analyse trade and environmental issues both in a static and dynamic framework. Amongst the many features these models share, we can identify three here, which are also common to similar models used in other fields. First, when addressing open economy issues, AGE models are usually build under the assumption that factors of production—especially capital—are intersectorally mobile, but internationally immo-bile. Second, they generally concerned themselves with doing counterfactual exper-iment analysis of ex-ante policy changes. Third, applied general equilibrium work typically focuses on Walrasian competitive equilibria only.
The present work takes AGE models dealing with trade and/or environmen-tal issues beyond these traditional confines. First, we build a trade model incorpo-rating endogenous determination of international capital flows in the form of foreign direct investment. Second, we move beyond counterfactual experiment analysis and use general equilibrium techniques to decompose observed economic outcomes derived from different sources into constituent parts attributable to each source. Third, we go beyond traditional Walrasian competitive equilibria, and compute both bargain-ing solutions and non-cooperative equilibria. In a similar vein, we also use modellbargain-ing techniques to endogenously determine the optimal size of specific policy instruments, with the full set of general equilibrium conditions serving as constraints.
ter 1, where we use a conventional model, each Chapter builds a structure departing from traditional AGE modelling in any of the three ways just described. We use these models with the aim of complementing theoretical discussions and contribute to policy analysis. Chapter 1 uses a traditional general equilibrium trade model to examine the effects of trade liberalisation and indirect tax reform in El Salvador. Our analysis here is exclusively policy-oriented, and we do not claim any methodological or thematic novelty for it. The only new aspect about it is its application to the Sal-vadorean economy—for which the issues in question have not been addressed within a general equilibrium framework. We examine the welfare, income distribution and macroeconomic effects of both trade liberalisation and value-added tax reform. Our finding is that the welfare and income distribution consequences of both policies are quite small, and that their main impact is on the macroeconomic side (government budget and external sector).
In Chapter 2, we modify and extend this simple trade model to incorpo-rate both foreign direct investment (FDI) and international capital income taxation (ICIT). To the best of our knowledge, no previous calibrated general equilibrium models have been used to examine trade issues when FDI flows or ICIT are present. In the absence of adequate Salvadorean data on sectoral FDI, we apply this model structure to the economy of Costa Rica, for which we examine the welfare effects of unilateral trade liberalisation and compute the optimal import tariff structure. Our
nation hurts the Costa Rican economy, whose optimal tariff structure in fact consists of a combination of import tariffs and import subsidies of relatively small size.
Chapter 3 uses general equilibrium modelling to conduct decomposition, ex post analysis. Here, we deal with the phenomenon of increased wage inequality
re-cently documented for a number of OECD countries (most notably the US and the UK), and which has been linked both to rising trade with low-wage countries (e.g. Wood, 1994) and technological change (e.g. Lawrence and Slaughter, 1993). We ex-amine the UK case, and use a generalised version of the Heckscher-Ohlin trade model to decompose the observed change in wage inequality over the period 1976-90 into portions due to trade and technological change. We do this under alternative labour market institutional frameworks, and find that decomposition results are sensitive to the way the labour market is modelled. Specifically, we find that when wages are fully flexible and labour markets clear, technology is the main force behind the increase in wage inequality. But when real wages are downwardly rigid, the dominant factor can be any of the two, depending on the model parameterisation used.
Chapter 4 uses a model incorporating cooperative an non-cooperative solu-tion concepts to analyse the interacsolu-tion between trade and environmental issues in an strategic setting. We examine the incentives for less developed countries (LDCs) to participate in possible future linked trade and environment negotiation in the World Trade Organization (WTO). It is suggested that these negotiations will largely break
and environment where LDCs are the custodians of environmental assets and can use the leverage this gives them in exchange for trade concessions by developed coun-tries. The latter are assumed—due to their higher income—to attach a large value to the environmental assets owned by LDCs, and can use trade policy threats to improve environmental management by developing countries. We go beyond conven-tional Walrasian competitive equilibria, and compute both cooperative (bargaining) and non-cooperative solutions over trade only, and over trade and the environment jointly considered. We find that developing countries would gain by moving from ne-gotiations only on trade towards linked nene-gotiations, with gains being larger if they are compensated with side payments of cash.
GENERAL EQUILIBRIUM ANALYSIS OF
TRADE AND INDIRECT TAX REFORM IN EL
S ALVAD OR*
During the last decade, El Salvador has undergone a series of policy changes, resulting from the implementation of structural adjustment reforms. These changes have affected virtually every aspect of its economy—from price control and exchange rate policy, to tax, trade, financial reform, and privatisation. The reforms have substantially increased the role of market forces and made the economy more open.
As in many other developing countries that have gone through similar policy reforms, the expectation was that structural adjustment would foster growth (e.g. Corbo et al., 1987). In fact, the growth performance of the Salvadorean economy during the 1990s has significantly improved, averaging about 5.3% a year (during the 1980s GDP contracted by 1.0%). Though few would challenge the view that policy changes since 1989 have something to do with this improved performance, it is difficult to establish the contribution of the various reform components. Policy-makers in El Salvador seem to have identified trade liberalisation as the single most important reform item and main contributor to recent growth. Accordingly, after
an initial significant liberalisation effort, they have taken additional steps to deepen trade reform.
Critics of structural adjustment in El Salvador, in turn, have attacked trade liberalisation on different fronts, but especially on the grounds of its (likely, at least) negative macroeconomic effects (e.g., increased budget deficit from lower tariff rev-enue, and increased trade imbalance from higher imports).' Although Salvadorean policy-makers have taken some measures to counterbalance adverse macroeconomic effects by increasing indirect taxation and allowing the exchange rate to depreciate, critics point to the negative distributional effects of these.
In this Chapter, we analyse the welfare, income distribution and macroe-conomic effects of deepening trade liberalisation in El Salvador. We also examine the effects of specific measures adopted partly to offset unwanted macroeconomic effects—such as increased value-added taxation. We use an applied general equilib-rium model to analyse these policy changes. The model—which has been calibrated to a 1990 data set—disaggregates economic activity into 15 sectors, and identifies three separate factors of production (capital, urban labour and rural labour) as well as two household groups (one deriving income mostly from capital and the other whose income comes mainly from labour). The lack of more disaggregated data does not allow us to do a more detailed analysis of distributional issues.
The trade reform numerical simulations we carry out consider alternative closure rules for both foreign sector and government sector. One set of closure rules has the purpose of calculating the welfare impact of liberalising trade in a theory-consistent fashion; whereas the other tries to examine broader effects of this policy given the specific characteristics (or circumstances) of the Salvadorean economy.
The specific issues this Chapter focuses on are the following. In the area of trade reform, we examine the effects of different degrees of trade liberalisation, according to the reform stages established by Salvadorean policy-makers. We first simulate the effects of moving to a tariff structure with rates between 0 and 15%, which El Salvador has already adopted. We also analyse the effects of taking this process further by adopting a two-rate tariff structure of zero and 6% as well those of a hypothetical movement to complete free trade. On the tax-reform side, we examine the impact of the 30% increase of the VAT rate that took place in El Salvador in 1995. The latter tries to assess the ability of increased indirect taxation to offset some adverse macroeconomic effects of trade liberalisation and the distributional consequences of higher indirect taxes.
1.1 Some Aspects of Structural Adjustment Reform in El
Salvador
1.1.1 Trade and Exchange Rate Policy
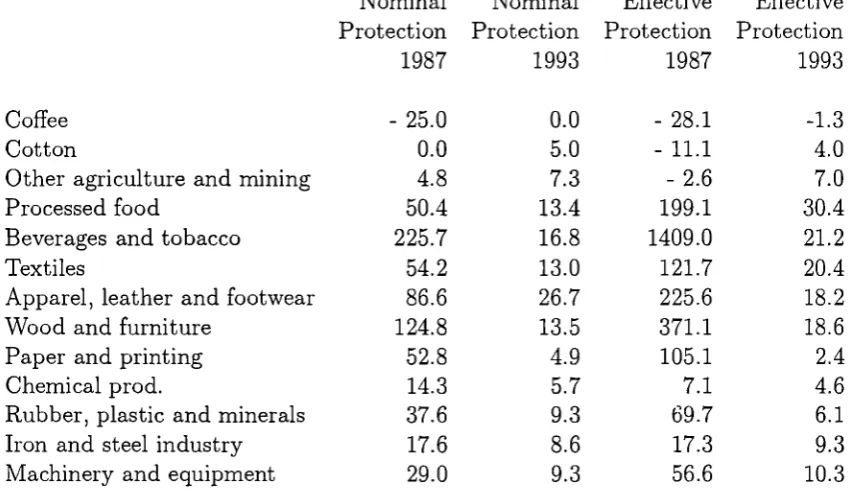
Like the rest of Central America, ever since the creation of the Central American Common Market (CACM) in 1960, El Salvador followed a growth strategy based on industrialization through import substitution, especially of consumer goods. In terms of trade policy, this strategy was implemented via the imposition of high tariff rates for consumer goods, on the one hand, and of low import taxes for intermediates and capital goods, on the other. Tariff protection for import substitutes during this period was thus characterized by a high average level and dispersion (Table 1). This was complemented with the existence of export taxes on those goods in which El Salvador had at the time a strong comparative advantage, such as coffee, cotton and sugar. With manufacturing exports being also indirectly taxed, the result was a trade regime penalising all exports.
Salvador had adopted a 5-20% tariff structure. Simultaneously, all export taxes have been scrapped. As a result, both the level of protection and its dispersion have been significantly reduced, with disprotection for key export goods (such as coffee) almost disappearing. Columns 2 and 4 of Table 1 show the new pattern of incentives by the early 90s.
There has been a strong belief by Salvadorean policy-makers that trade re-form has been an important element in the country's improved economic perre-formance during the 90s. Accordingly, there has been a great deal of enthusiasm for further deepening trade liberalisation. In 1995, the Salvadorean government announced that they were aiming at moving to a zero tariff for intermediate and capital goods, and a 6% tariff for consumer goods, by 1998. Though trade reform has proceeded at a slower pace than this—especially at the top of the tariff structure—, significant changes have taken place. El Salvador has nowadays a tariff range of 0-15%, a dramatic change in relation to the end of the 80s. The expectation is that trade reform will significantly boost economic growth mainly through export expansion (MIPLAN, 1989).
Table 1. El Salvador: Nominal and Effective Tariff Protection
Percentages
Nominal Nominal Effective Effective Protection Protection Protection Protection
1987 1993 1987 1993
Coffee - 25.0 0.0 - 28.1 -1.3
Cotton 0.0 5.0 - 11.1 4.0
Other agriculture and mining 4.8 7.3 - 2.6 7.0
Processed food 50.4 13.4 199.1 30.4
Beverages and tobacco 225.7 16.8 1409.0 21.2
Textiles 54.2 13.0 121.7 20.4
Apparel, leather and footwear 86.6 26.7 225.6 18.2
Wood and furniture 124.8 13.5 371.1 18.6
Paper and printing 52.8 4.9 105.1 2.4
Chemical prod. 14.3 5.7 7.1 4.6
Rubber, plastic and minerals 37.6 9.3 69.7 6.1
Iron and steel industry 17.6 8.6 17.3 9.3
Machinery and equipment 29.0 9.3 56.6 10.3
was some pressure for the currency to rise against the dollar, due to an oversupply of the latter brought about by remittances and foreign aid. With this, during 1989-93, the exchange rate experienced a nominal devaluation of approximately 70%. By 1994, however, policy-makers in El Salvador began having second thoughts regarding its exchange rate regime. These were formally converted into policy action at the beginning of 1995, when the Salvadorean government announced its plans to move again to a fixed exchange rate. In the last four years, the nominal exchange rate has remained basically fixed. As El Salvador's inflation has been above that of its main trade partners, this has implied a real appreciation of the local currency.
1 . 1 . 2
Taxation
Structural adjustment reforms in El Salvador have affected public finances especially through the revenue side—where a far-reaching tax reform has been imple-mented. This has comprised eventually all taxes that were in effect when adjustment reforms were launched in 1989, namely the income tax, property tax, sale tax, and—as already described—international trade taxes.
the number of income brackets, and eliminating a great deal of exemptions, most of them linked to the import-substitution strategy.
Company taxation, in turn, has also comprised the reduction of marginal and average rates, though less substantially. A very important change has been the abandonment of the multiple-rate system in favour of a flat-rate system. Another key change has been the scrapping of the classical system of corporate taxation—where profits were double taxed—in favour of one where taxation takes place at company level only. These reforms have been accompanied by the elimination of the property tax, which was applied to net assets both at company and personal level.
As to indirect taxation reform, this have comprised the substitution of the turnover tax by a value-added tax. The VAT has very few formal exemptions, and do not apply to capital goods sales. Set initially at 10% in 1992, its rate was increased to 13% in June, 1995—partly with the goal of compensating the loss of revenue stemming from further trade liberalisation—where it still remains.
1.2 The Model
each other, both on the import and on the export side. This implies that, for each good, three different markets are distinguished: the market for imports, the market for exports and the market for domestic goods sold at home. World prices are as-sumed to be fixed both for import and export goods. As to the third market, demand and supply are endogenously determined. It is assumed that the three markets are perfectly competitive, and that full employment prevails in factor markets.
1.2.1 Supply
In order to model differences between output produced for the domestic and export market, supply in the model is determined in two stages. In the first stage, it is assumed that producers maximize profits from producing a composite good. In the second stage, this composite good is divided between the domestic and export market, depending on relative prices. This good is assumed to be produced by a fixed proportion combination of value added and intermediate inputs. Thus, the production function for the good in question is given by
Z.
Xi = min (C2i , j = 1, 2, ..., 15,
10
added, in turn, is produced by a combination of capital, urban labour, and rural labour according to a Cobb-Douglas technology
Qj =llFkaiki k = u, r, IC;
E
aki = 1, (1.2)where Fkj represents the quantity of factor k used by the jth sector, and aki is the
share of factor k's income in total valued added in sector j.
As to intermediate inputs, they are also required in fixed proportion
Profit maximization subject to (1.1), (1.2) and (1.3) leads to the following factor demand function
Pvi a k j X j
Fk3 = (1.4)
Wk7Pki
where Pi,3 is the price of value added, wk is the average factor price, and 17bkj is a parameter taking account of the fact that factor prices differ across sectors (which Devarajan et al. (1994) interpret as a factor-market-distortion parameter).
The technology that transforms output for domestic market into output for the export market is described by the following CET function (for convenience, the elasticity subindex has been omitted)
Cost minimization subject to (1.5) yields the following export supply func-tion
Ej D3 [( 1 13i)PE:17471 P jPDi
where PEi and 13Dj are export and domestic goods prices, respectively, expressed in local currency.
1.2.2 Demand
There are three different sources of demand: foreign demand for export goods, domestic demand for the domestic good, and domestic demand for imports. Because of our small country assumption, we do not need an elaborate treatment of foreign demand, and concentrate on the discussion of domestic demand. It is assumed that imports and domestic goods are imperfect substitutes for each other (Armingtion assumption). This implies that, for each sector, there is a composite commodity, Cj, which is a CES aggregation function of imports (/V/j ) and domestically-produced goods (Dj ) (the elasticity index is again omitted):
Cj = [aj /lC a
+
(1 — aj )Di a ] , (1.7)where aj is a share parameter and o- = 1/(1+€ 2 ), E2 being the elasticity of substitution
between domestic goods and imports.
Cost minimization subject to (1.7) yields import demand as a function of the domestic good price, Ppi, and the imported good price, PA43:
[ ai Ppi 1+6
Mi = D3 (1.8)
(1 - ai)Pm,
As to the components of domestic final demand, household consumption is derived from the maximization of a Cobb-Douglas utility function subject to each household's budget constraint, yielding
CHhi = Sh)(1 th)/ Pcp (1.9)
where [thi is the share of good j in total consumption by household h, Ih is household
income, sh is the average propensity to save by household, t h is an average income tax rate, and P the price of composite good j.
Government demand, in turn, is assumed to be exogenously given, and is made up by the purchase of goods and services, plus transfers to households
GD =ECCG +
ETR
h,
(1.10)where cki is the share of good j in aggregate government consumption of goods and services, CG, and TRh denotes government transfers to households.
Finally, although this is a static model, we must accommodate for invest-ment occurring during the period of analysis. Aggregate investinvest-ment, which is exoge-nously set equal to aggregate savings, is made up of fixed capital investment, VI , and inventory investment, V2:
As to fixed capital formation, we consider only gross investment, as no recent depre-ciation data is available for El Salvador. Fixed investment by sector of destination and origin is given by the following expressions, respectively
PjK=mV1, (1.12)
K; =Ebii K (1.13)
where Pi is the price of a unit of capital installed in sector j, K.di is fixed investment in sector j, mi denotes the proportion of aggregate fixed investment done by sector j, K; is fixed investment by sector of origin, while b ii represents the share of capital good j in fixed investment in sector i.
Finally, inventory investment is specified as a fixed proportion of gross out-put
v2
= E
63 X3 Psi , (1.14)3
where Si is the ratio of the value of inventory investment to gross output in sector j, and Ps, is the price of gross output.
1.2.3 Prices
As indicated earlier, the model incorporates the small open economy as-sumption and thus considers world prices for imports and exports to be exogenous for all goods. Domestic import and export prices are, respectively, given by
PEj =
RP.,
(1.16)where Pmf . and 3 denote the world price of imports and exports, respectively, R is 3
the exchange rate, and tmi is the tariff rate applied to good j.
Prices for composite good, C, and gross output, X i , are given by
PC, = (PD3 D3 + PAI,M3)1C3, (1.17)
Pxj (PD-DJ PEJ EAl X j. (1.18)
The valued-added price is, in turn, the price of sectoral output net of intermediate inputs and indirect taxes:
Pt); = P 3(1 — txi ) — (1.19)
where tx, represent either an excise tax—applied to alcoholic drinks and tobacco, and which we model as a production tax—or a production subsidy—granted to some agricultural activities and utilities.
The price per unit of capital, Pi , is given by
Pj
= EP„b
ij.
(1.20)Finally, we will use the producer price index as our aggregate price index, P:
P =
E
03Xy, (1.21)3
1.2.4 Income
Factor incomes are made up of domestically-generated income, Yk, and
in-come from abroad, Fk, i.e.
Yk
=
E
WkiPjFkj RFk• (1.22) 3We distinguish two types of households according to their income composi-tion between labour income and capital income. We label these labour and capitalist households, respectively. Here, we also consider separately the existence of remit-tances as well as government transfers. Mapping the distribution of factor income into the distribution of income between the two households, and adding remittances and government transfers, we get
= E
Akh Yk RNh T Rh) (1.23)where /h denotes household income Akh represents the share of factor k's income
going to household
h,
and Nh andTRh
are remittances from abroad and governmenttransfers, respectively.
Government derives its revenue,
GR,
from taxes, transfers from abroad and other non-tax revenue (such as revenue from domestic transfers, services provided by the government, etc.):+Et
x,1
3xiX
j—
+ NTR, (1.24)where t„ is an average corporate tax rate, L is corporate income, t vi is the value-added tax rate, and NTR represents non-tax revenue. (The second last term in (1.24) takes account of the fact the capital goods are exempt from the value-added tax). Corporate income is, in turn, given by
L = -y w,c0i , (1.25)
where -y is the fraction of capital income generated by corporations in the economy
as a whole (the subscript K refers to the factor capital).
1.2.5 Market Clearing Conditions
Equilibrium in the goods market implies that supply equals demand for each commodity, i.e.
Ci =
INT; + ECH
ih+
CC; + 13 . (1.26)In the labour market, full employment of each factor is assumed, so that aggregate demand for each input type must equal aggregate supply:
E
Fki = (1.27)1.2.6 Macroeconomic Closure
Regarding closure rules,' the model is savings-driven in that investment in the period of analysis equals aggregate savings—which is the sum of households savings (SP), government savings (S
9
) and foreign savings (S1):INV = SP
+ S9
+ RSf ,
(1.28)The first two components of the right hand side of (1.28) are defined as
SP =
Es
h (1—
th
)Y Hh , (1.29)S
9
= GR— GD,
(1.30)while the third component is determined from the identity for the balance of payments current account:
E PI Mi Ykf =
EP1Ej +ENh +TRF + Sf
(1.31)We use different closure rules involving the three savings types,' depending on the particular issue we are interested in. Closure rules differ when we simulate the impact of trade liberalisation. Here, in order to isolate the welfare effect of trade reform, we keep government revenue constant and endogenise one tax rate (the corporate tax rate); as to the foreign sector, we fix foreign savings and allow the exchange rate to
2 0n the general issue of closure rules in applied general equilibrium models see Dewatripont and Michel (1987).
vary; 4 while to keep private savings constant, we endogenise the household savings rate, hs h . Government expenditure, in turn, is always fixed as well as international transfers and factor income from abroad.
Although this closure rule is very useful from an analytical standpoint, it does not necessarily reflects the situation of the Salvadorean economy in the last few years. On the external sector, the relevant feature of this economy is its ability to finance an increasing trade deficit through aid, capital inflows and, especially, remittances. To capture this, in our second trade liberalisation simulation, foreign savings are endogenously determined. Since transfers and factor income from abroad are fixed, the endogenisation of foreign savings is equivalent to keeping the trade balance free. On the other hand, we keep the exchange rate fixed, reflecting the plan of pegging that variable announced by the Salvadorean government in February, 1995. Similarly, we endogenise both government revenue and private savings—which implies that household savings rates and the corporate tax rate are now exogenous. For the model to be exactly determined, one more variable must be determined exogenously. Our choice is to make aggregate fixed-capital investment exogenous.
1.3 Data and Model Calibration
The social accounting matrix (SAM) that feeds the model is based mainly on data from the Banco Central de Reserva de El Salvador (1993) (Henceforth BCR,
1993) and Ministerio de Planificacion de El Salvador (1991) and (1994) (Henceforth MIPLAN, 1991 and 1994, respectively). In BCR (1993), a new system of national accounts for El Salvador has been built. This system, set up for the year 1990, contains an input-output table, together with income and expenditure accounts for households, corporations (both private and public), government and the rest of the world. In fact, it amounts to a SAM with a rather different format. We combine this data with information from household consumption expenditure and employment surveys done by MIPLAN (1991) and MIPLAN (1994) as well as with some macroeconomic accounts. With the necessary adjustments, this data readily produce a SAM with the disaggregation and consistency required by our model.
The input-output table contained in BCR (1993) is a 1990 updated version of the 1978 table, and classifies economic activity into 44 sectors. The updating was performed by a combination of survey data and RAS. We have aggregated this table into 15 sectors, trying to keep separately key sectors in agriculture and manufacturing in the Salvadorean economy.
remunera-tions by sector between rural and urban labour. The consumption survey done by MIPLAN is for 1990-91, while the employment survey is for 1992-93. The obvious result is that BCR and MIPLAN magnitudes do not match. Therefore, in order to maintain SAM balances, we have used MIPLAN's data to compute shares only and have kept the corresponding aggregate magnitudes provided by BCR.
When the foregoing data combination has not been sufficient, we have com-plemented it with balance of payments and government finance accounts. This has been done especially with regard to transfers among institutional sectors as well as government non-tax revenue. When appropriate, we have again followed the proce-dure of using the complementary information to compute shares only, while preserving the original aggregates.
As to other data required for our model, such as sectoral capital stocks, trade elasticities and other parameters, they have been obtained as follows. In the absence of adequate data, capital stocks have been computed by assuming a uniform return to capital of 20%. This is a procedure that has also been used in some of the applied public finance literature (e.g. Ballard et al., 1985). On the other hand, lacking a capital composition matrix, we used the associated vector, which gives the share of each capital good in aggregate investment demand.
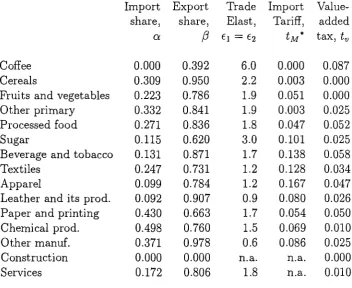
Table 2. El Salvador: Benchmark Selected Model Parameters Import Export Trade Import
Value-Coffee share, a 0.000 share, i3 0.392 Elast, € 1 = 62 6.0 Tariff, tm* 0.000 added tax, ti, 0.087
Cereals 0.309 0.950 2.2 0.003 0.000
Fruits and vegetables 0.223 0.786 1.9 0.051 0.000
Other primary 0.332 0.841 1.9 0.003 0.025
Processed food 0.271 0.836 1.8 0.047 0.052
Sugar 0.115 0.620 3.0 0.101 0.025
Beverage and tobacco 0.131 0.871 1.7 0.138 0.058
Textiles 0.247 0.731 1.2 0.128 0.034
Apparel 0.099 0.784 1.2 0.167 0.047
Leather and its prod. 0.092 0.907 0.9 0.080 0.026 Paper and printing 0.430 0.663 1.7 0.054 0.050 Chemical prod. 0.498 0.760 1.5 0.069 0.010
Other manuf. 0.371 0.978 0.6 0.086 0.025
Construction 0.000 0.000 n.a. n.a. 0.000
Services 0.172 0.806 1.8 n.a. 0.010
* Ratio of tariff revenue to imports. Tariffs in this column are lower than those presented
in Table 1 because they take into account the existence of both exemptions and free trade
within the CACM.
using, for a given sector, the same values for Armington and CET functions. They also assign larger elasticity values to agricultural goods, trying to reflect the higher degree of homogeneity between agricultural goods abroad and their counterparts consumed domestically. We adopt this practice as well. On the production and preferences sides, we use Cobb-Douglas functional forms.
Reinert and Roland-Holst (1992) and Shiells and Reinert (1993) have esti-mated Armington elasticities for manufacturing activities using data for the United States. They produce estimates which are generally lower than those we use here.' Though their sectors and ours do not exactly match, their estimates are smaller on average by about one third than those presented in Table 2 for manufacturing activ-ities. For some of our sectors—leather and other manufacturing—the estimates they present are larger than our values. As part of our trade liberalisation simulations, we do sensitivity analyses on the trade elasticity values, and find that using the US esti-mates for manufacturing activities has only a minor effect on welfare and aggregate income results.
ters we use for the Armington and CET functions as well some additional information for the benchmark year.
1.4 Simulation Results
1.4.1 Trade Liberalisation
In this section we describe simulation results from the following scenarios of trade liberalisation:
1. Reducing the maximum tariff for consumer goods from 20% to 15% and the minimum duty for intermediate and capital goods from 5% to zero. This cor-responds to the tariff changes implemented between 1995 and 1998.
2. Setting a single tariff of 6% for consumer goods and a zero-tariff for intermedi-ate and capital goods. This corresponds to the longer-term trade-reform plan announced by the Salvadorean government in February, 1995.
3. Completely eliminating all import tariffs.
Trade Liberalisation with Fixed Foreign Savings and Fixed
Government Revenue
In order to isolate the impact of trade liberalisation on welfare, we fix foreign and private savings as well as government revenue (equal-revenue yield) for the three trade liberalisation scenarios considered. The counterpart of fixing government rev-enue and private savings is the endogenisation of the corporate income tax rate and labour houselods' propensity to save. Finally, with fixed foreign savings, the exchange rate has been allowed to vary (the producer price index being the new numeraire).
Table 3. El Salvador: Welfare and GDP Impact of Alternative Tariff Changes
0-15% Tariff 0-6% Tariff
Structure Structure
Free Trade Equivalent variation
as a % of income
All households* 0.25 0.34 0.39
Labour households 1.47 1.85 2.02
Cap. households -1.61 -1.59 -1.68
Change in GDP (%) 0.16 0.19 0.21
* As a% of GDP.
Welfare and Income Level
The movement from a tariff structure of 5-20% towards a 0-15% structure
a positive impact on aggregate welfare (Table 3). Once this movement has been made, the welfare gains from moving towards complete free trade are very modest (welfare rises by 0.14% of GDP). Moving from the current tariff structure towards that aimed at by the Salvadorean government (of 0-6%) would mean a welfare increase of only 0.09%. The trade liberalisation impact on GDP follows a very similar pattern. These results suggest that the efficiency gains of reducing tariff protection fall exponentially once a relatively low tariff level has been achieved, a result consistent with other findings in the literature (see, e.g. Whalley and Srinivassan, 1986).
Table 4. El Salvador: Distribution Effects of Full Tariff Elimination
Percentages of aggregate factor and household income Benchmark New Equilibrium Factor income
Rural labour 11.83 12.05
Urban labour 21.44 21.32
Capital 66.73 66.63
Household income
Labour households 41.97 42.82
Cap. households 58.03 57.18
Income Distribution
Welfare results in Table 3 also show that only labour households benefit from trade liberalisation—a reflection of changes in income distribution are adverse to cap-italist households. However, for our model disaggregation at least, the distributional impact of reducing tariffs is quite modest for all scenarios of trade liberalisation. Ab-solute returns increase for all factors under the three scenarios of trade liberalisation considered, with rural labour being the main winner and urban labour the main rel-ative loser—as shown by Table 4 for the full-tariff elimination scenario. The overall return to labour relative to that of capital also increases slightly in all cases.
by the contraction of manufacturing and construction and services, its main users. The decline of these sectors is also responsible for the fall in the return to capital relative to the aggregate wage rate.
These factor return movements seem to be consistent with traditional trade theory predictions, such as those made by the Stolper-Samuelson theorem (e.g. Jones and Neary, 1984). In effect, it is the factor used intensively in the sector whose relative price went down—manufacturing—the one that ends up losing. However, there are not absolute losers here.
As to household income, in line with the foregoing, the winners are labour households (Table 4). Thus, at an aggregate level, trade liberalisation has a small but progressive impact on income distribution. At a more specific level, this seems to be still the case since rural labour wins, and rural households in El Salvador are poorer than their urban counterparts (Gregory, 1992).
Macroeconomic Aggregates
cases), in order to keep total revenue constant. Clearly, such a change in corporate taxes would be infeasible in practice.
Table 5. El Salvador: Selected Macroeconomic Effects of Trade Liberalisation
Percentage changes with respect to benchmark 0-15%
Structure
0-6% Structure
Free Trade
Private savings -4.07 -4.49 -4.81
Corporate tax revenue 108.99 118.91 126.12 Personal income tax revenue -2.16 -2.39 -2.56
VAT revenue -0.70 -0.77 -0.81
Tariff revenue -85.84 -94.05 -100.00
Other tax revenue -0.40 -0.56 -0.68
We should highlight two results here. First, despite the GDP expansion, rev-enue from the personal income tax falls. This is due to the changes that have taken place in income distribution, which has lowered income for capitalist households—El Salvador's main tax payers. Second, even though absorption has remained roughly constant, indirect tax revenue exclusive of tariffs declines. This comes from the con-traction of manufacturing and services, the main sources of this type of revenue in El Salvador.
As to export expansion—the main channel through which El Salvador's policy-makers expect trade liberalisation to foster growth–, the effect of lower tar-iffs on it is indeed modest, ranging between 3.8% and 5.1%, depending on the extent of trade liberalisation.
Trade Liberalisation with Endogenous Foreign Savings and
Government Revenue
As indicated above, over the last eight years, El Salvador has been able to finance an increasing trade deficit through a combination of foreign aid, capital inflows and family remittances. In fact, the plan for further deepening trade liberalisation that was announced by the Salvadorean government in February, 1995, could hardly have been made without the expectation that this flow of foreign resources—especially remittances—will be present, at least in the near future.
fixed, the variable that equilibrates its budget is savings. Again, we have performed simulations for the three trade liberalisation scenarios identified above. Aggregate results are shown in Table 6.
Note that the expansion in GDP is now lower under all scenarios of trade liberalisation. This seems to be the result of smaller exports resulting from the exchange rate not having experienced a depreciation. The pattern of changes in production is also somewhat different. Under the movement toward a 0-15% tariff structure, agricultural GDP contracts while all other major sectors expand. This means that sectoral results are being dominated by the capital inflow that is generated in order to keep real investment constant. This inflow is quite high, implying an increase in the trade deficit of more than 10.7%. Note that exports even contract under the first scenario of trade liberalisation (0-15% structure).
Table 6. El Salvador: Trade Liberalisation Effects with Endogenous Foreign Savings
Percentage changes with respect to benchmark 0-15%
Structure
0-6% Structure
Free Trade Income and trade
GDP 0.10 0.13 0.15
Exports -0.18 0.08 0.27
Imports 3.61 4.27 4.74
Trade deficit 8.83 9.95 10.77
Public finances
Government revenue -15.50 -16.99 -18.07 Personal income tax rev. 0.68 0.68 0.67 Corporate tax revenue 0.65 0.65 0.64
VAT revenue 0.08 0.070 0.07
Other tax revenue 0.08 -0.09 -0.20
Government savings -1273 -1393 -1479 Other Savings
Private savings 0.82 0.80 0.79
Foreign savings 20.08 31.64 34.24
Factor prices
Rural labour return (1) 0.58 0.65 0.70 Urban labour return (2) 0.68 0.66 0.65
Capital return (3) 0.65 0.67 0.64
(1)/(3) -0.07 0.00 0.05
distribution changes have allowed private savings to increase. The second movement is, however, quite modest, so that national savings experience a large contraction.
Now, if investment is to remain unchanged, there must be a replacement of national by foreign savings, as shown by Table 6. However, boosting public savings by rising taxes on sales, for instance, may contribute to avoid this, as we will see now.
1.4.2 Increased Value-Added Taxation
We have simulated the effects of the increase in the value-added tax rate from 10% to 13%, which took place in June, 1995. Results are presented in Table 7. Again, in order to take account of El Salvador's circumstances, we have kept the exchange fixed and allow foreign savings to vary. Since not all goods are subject to the VAT, uniformly rising its rate in all sectors being taxed has an impact not only on the general price level but also on relative prices.
Relative price changes, in turn, lead to movements both in the level and structure of output. Now, given that we are in a second-best world, G GDP ends up rising, though very slightly. This comes especially from the expansion agricultural activities, where most goods exempt from value-added taxation are. Manufacturing and services both contract in aggregate.
Table 7. El Salvador: Macroeconomic and Distribution Effects of Increasing VAT
Percentage changes with respect to benchmark % Change Macro aggregates
GDP 0.03
Trade balance -4.68
Tax revenue 7.02
Government savings 581.83
Private savings -0.72
Foreign savings -14.88
Income distribution
Rural labour income share* 0.93 Urban labour income share* -0.28
Capital income share* -0.07
Labour households income share** 0.17 Cap. households income share** -0.12
Rural labour return (1) 0.48
Urban labour return (2) -0.68
Capital return (3) -0.48
(1)/(3) 0.67
(2)/(3) -0.19
* Share in GDP
These movements in production have an impact on factor prices and income distribution. On the one hand, the expansion of agriculture causes the return to rural labour—an input used intensively there—to rise slightly, while the contraction of manufacturing and services—both intensive users of urban labour—leads to a fall in the urban wage rate. The return to capital also decreases, following the decline of manufacturing, its main user. Thus, factor income distribution changes in favour of rural labour. Though the ratio of the urban wage rate to the return to capital falls slightly, the increase in the rural wage rate is big enough to make labour as a whole a winner vis-a-vis capital. This is also reflected in terms of household income dis-tribution, with labour households increasing their share, though very slightly (Table 7).
As to the trade balance, the increase in the VAT leads to a small rise of exports and a contraction of imports, improving the balance of trade —and current account (Table 7). However, rising the VAT rate to 13% does not fully compensate for the trade balance deterioration induced by moving to a 0-15% tariff structure. With a fixed nominal exchange rate, a full compensation would require rising the VAT by approximately 40.3% on average.
which pay much less taxes, is not enough to offset this). Tariff revenue, in turn, falls as imports decline, while revenue from excise taxes goes down as a result of the fall in manufacturing output. Due to the contraction of manufacturing and a fall in consumption, the percentage increase in VAT revenue is below the increase in its rate. The VAT rate increase from 10% to 13% would not be enough to fully compensate for the fall in revenue that would result from moving to a 0-15% tariff structure. According to our simulations, with flexible foreign savings and fixed ex-change rate, to fully offset this, the required rise in the VAT rate would be of 40.4% on average (very similar to the increase needed to keep the current account balance unchanged). For complete liberalisation, the corresponding VAT increase would be of roughly 75%.
1.5 Concluding Remarks
This Chapter has used an applied general equilibrium model to analyse the welfare, distribution and macroeconomic effects of trade liberalisation in El Salvador as well as the effects from increased value-added taxation. We find that further unilateral trade liberalisation in this country produces quite small gains in terms of GDP and welfare. This is due to some extent to the fact that tariff rates are already relatively low and there is no much dispersion in the tariff structure. 7 Contrary to
the expectations of Salvadorean policy-makers in recent years, the export impact of trade liberalisation appears to be also modest. Thus, it would seem difficult to argue that trade liberalisation alone will turn exports into the engine of growth for the Salvadorean economy.
On the other hand, and contrary to the views of critics of structural reform in El Salvador, we find that the higher income level that trade liberalisation leads to will be more progressively distributed; this both in terms of factors and households, at least for the level of disaggregation in our model. This is basically in line with the predictions of traditional trade theory.
The macroeconomic impact of trade liberalisation seems to be negative. National savings—and even aggregate savings—tend to decrease, which do not favour long-run growth. Thus, trade reform would tend to favour consumption over capital accumulation, unless other measures are adopted. On the other hand, the fall in government savings may threaten fiscal stability. Trade liberalisation would also lead to a significant deterioration of the balance of trade—a consequence of a sharp rise in imports and a modest export expansion.
for example, may also come into play. Our simulations also show that the increase in the VAT rate that took place in mid 1995—partly intended to offset the loss of tariff revenue from trade liberalisation—will have a positive and significant impact on government finance and the balance of trade. This substantially offsets the negative macroeconomic effects of trade liberalisation.
On the other hand, raising the VAT rate may have less negative effects than often thought. In particular, output does not contract, and income distribution even seems to improve, though very slightly. This suggests that many of the presumed negative effects of higher value-added taxation in El Salvador—such as a worsened income distribution—, may come in fact from factors certainly related to the tax measure, but different from it (such as expectations, speculation, etc. and their effect on prices). On the other hand, we must bear in mind that our model yields 'long-run' results (i.e., once the economy has reached a new equilibrium); short-run effects may well be very different.
TRADE LIBERALISATION IN THE PRESENCE
OF FOREIGN DIRECT INVESTMENT AND TAX
CREDITS
A well-known result from the "tariff-jumping" investment literature of the 1970s is that import-tariff-induced capital inflows will be immiserising for a small open economy (e.g. Brecher and Diaz-Alejandro, 1977). It is also well-known that this result relies crucially on the assumption that the host economy does not tax foreign capital (Bhagwati, 1973). As Bond (1991) has shown, if this assumption is lifted and taxes paid in the host country by foreign companies are credited in the source country against the corresponding domestic tax liability, tariff-induced capital inflows are no longer immiserising. Therefore, it will be optimal for a small open economy to impose a tariff on its imports—provided that the importable sector uses capital intensively.
The possibility of import tariffs being welfare-enhancing for a small economy may have some interesting policy implications for many developing countries which have embarked on outward-oriented growth strategies in the last fifteen years or so. First, unilateral trade liberalisation and foreign direct investment figure prominently in most LDCs' "new" growth strategies. Second, in many developing countries trade
liberalisation has implied a reduction in tariff protection for the manufacturing sector, which tends to be relatively capital-intensive. This, as the Stolper-Samuelson theorem suggests, will tend to reduce the return to capital and thereby FDI inflows to these countries.' Third, the bulk of FDI in developing countries originates in developed countries, the majority of which uses the tax credit mechanism when taxing foreign-source income.2
In this context, unilateral trade liberalisation could deteriorate national wel-fare. Whether it does or not is an empirical question—which would depend on the relative strength of the positive effect of lower distortions resulting from freer trade, and the negative effect associated with the loss of tax revenue following lower FDI inflows. Incidentally, this possibility of welfare-reducing trade liberalisation could provide an explanation to some of the opposition that reforms seeking freer trade have faced in developing countries. In effect, this could be the case of the opposition by groups that would not necessarily or directly lose from the changes in relative prices and the relocation effects associated with trade liberalisation.
Although a lot of work has been devoted to the theoretical link between import tariffs and international capital flows (see e.g. Wong, 1996), model-based
'This would be more likely to occur in countries with relatively large domestic markets in which foreign companies have located to bypass an import tariff and serve the internal market.
empirical work endogenously linking capital flows to tariff changes in a general equi-librium setting—whether with foreign capital taxation or not— is quite scant. In fact, the only calibrated study that appears to have addressed this linkage is Goulder and Eichengreen (1992). 3 However, they focused exclusively on portfolio investment, without considering FDI. They also do not consider international capital income tax-ation.
This Chapter quantifies the welfare impact of unilateral trade liberalisation once its effect on FDI flows is taken into account and taxation of FDI is allowed for. For this, a multi-sector applied general equilibrium model integrating trade, capital flows and international capital income taxation is used. The model has been calibrated to a 1990-91 data set for the economies of Costa Rica and a group of OECD countries (those using the credit mechanism when taxing foreign-source income). We show that, with foreign capital taxation and the foreign-tax-credit system in force, free trade is no longer first-best for a small country such as Costa Rica, and that trade liberalisation may be harmful to it. We find that the optimal tariff structure for the Costa Rican economy would consist of a combination of relatively low import tariffs and subsidies.
3Some applied general equilibrium models seeking to quantify the effects of the North American Free Agreement (NAFTA) explored the likely impact of incorporating FDI flows, but did so in an
The Chapter is organised as follows. The next Section discusses the relation-ship between import tariffs, capital flows and welfare with and without tax credits. Section 2.2 describes recent trade liberalisation and FDI policy in Costa Rica. Section 2.3 describes the model used in our numerical simulations. Section 2.4 discusses the nature of the data used for the empirical implementation of the model. Section 2.5 analyses simulation results, and Section 2.6 summarises and concludes.
2.1 Tariffs, Capital Flows and Welfare
The relationship between unilateral tariff changes and international capital movements has been analysed in great detail in the theoretical international trade literature (see, e.g. Mundell, 1957; Jones, 1967; Wong, 1995). The dominant ap-proach considers trade and capital movements to be substitutes for each other.' This approach is based on the traditional Heckscher-Ohlin model, in which countries differ in terms of factor endowments. As is well-known, in this model free trade leads to the equalisation of factor prices, which eliminates the rationale for factor movements. Hence free trade is a perfect substitute for factor movements. On the other hand, if factors move from where they are abundant to where they are scarce, the bases for trade are reduced, or disappear. Hence factor movements are a substitute for trade (Ruffin, 1984).
The interaction between tariff changes and capital movements was first for-mally presented by Mundell (1957). In a two-sector, two-factor model, invoking the Stolper-Samuelson theorem, Mundell shows that when a tariff is imposed by the labour-abundant country the return to capital is increased, and capital moves there; with perfect capital mobility, trade eventually disappears. This type of analysis later gave rise to the literature on "tariff-jumping" investment and its welfare consequences for a small open economy. The main conclusion of this literature was that the com-bination of capital inflows and distortionary tariff barriers in a small economy would result in immiserising growth. The idea had been suggested in Johnson (1967) and Bhagwati (1973), and was further developed by Minabe (1974), and Brecher and Diaz-Alejandro (1977) in a two-good, two-factor framework. It was generalised by Jones (1984), and especially by Neary and Ruane (1988). The second two authors lifted the restriction on the number of goods and factors, and extended the main result to the case in which capital inflows are entirely endogenous.
is present in foreign investors' home country, the optimal import tariff for a small, host economy is positive. As is well-known, under the foreign-tax-credit system, income taxes paid by companies operating abroad are fully credited against their home country tax liability—as long as their amount does not exceed such liability. In such a case, by taxing foreign capital income, host countries extract a gain in terms of tax revenue that would otherwise be captured by the home country.
As Bond indicates, by bringing with it tax revenue, foreign capital generates a kind of (positive) fiscal externality in the host country. The argument, as presented by Bond, runs as follows. For the host to capture all of the tax revenue associated with foreign capital income, its tax rate must be set at a level equal to that in the capital-exporting country. This, however, gives rise to a divergence between private and social cost of capital, i.e. the gross and the net rate of return, respectively. The latter is indeed the return required by foreign capitalists, which in equilibrium must be the same in the host and home country. Therefore, the optimal policy for the host consists of subsidising foreign capital at a rate equal to the income tax rate. As Bond (p. 321) puts it, "essentially, the home country wants to pay the taxes for the owners of imported capital and to impose no distortions in the goods market."
effective for a capital-importing country to resort to an indirect form of subsidisa-tion, such as an import tariff—provided, of course, that foreign capital locates in the import-competing sector. As the tariff will distort consumption decisions, it will be an inferior option to the direct subsidy—but still superior to free trade. In Section 6 we compare the performance of the direct subsidy vis-a-vis that of the tariff. The next section describes recent trade and FDI policy in Costa Rica.
2.2 Recent Trade and Foreign Investment Policy in Costa
Rica
Like El Salvador, Costa Rica is a member of the Central American Common Market (CACM). This has contributed to both countries sharing similar trade and industrial policies at least since the creation of the CACM in 1960. Costa Rica also followed a growth strategy based on industrialisation through import substitution, supported by a tariff structure very similar to El Salvador's—high tariff rates for consumer goods, on the one hand, and of low import taxes for intermediates and capital goods, on the other. Costa Rica's trade regime was biased against exports some of which— such as coffee and bananas, for instance—were directly taxed.
8), especially for industrial consumer goods and virtually all import quantitative restrictions and regulations have been eliminated. At the same time, the scope of export taxes has been greatly reduced,' and the level of export duties that still remains is now significantly lower.
Table 8. Nominal Import-Tariff Protection in Costa Rica
Percentages
1987 1994
Primary sector 4.8 6.2
Food. bev. and tob. 59.1 15.1 Textiles and apparel 41.1 19.9 Paper and printing 27.3 4.9 Chemical products 12.2 5.7 Non-met. mineral prod. 23.8 9.3 Metal products 14.2 8.6 Other manufacturing 21.7 9.3 Source: Calculations based on SIECA (1993) and WTO (1995).
Simultaneously to this unilateral trade liberalisation, Costa Rica has also embarked on some reciprocal, regional trade liberalisation—which, incidentally, has entailed changes to the CACM treaty. Costa Rica signed a free trade agreement with Mexico in 1994, which went into effect at the beginning of 1995. It has also been engaged in negotiations to establish a free trade area with Colombia and Venezuela, though no formal agreement has been reached.
Costa Rica's trade reforms have been accompanied by changes in its foreign investment regime, seeking to make the country more attractive to foreign companies. The idea has been to foster growth not only by reducing distortions but also by increasing capital accumulation. Foreign investment is also supposed to be a response to the need of reducing unemployment and increasing productivity levels; the latter to the extent that FDI can give rise to technology transfer benefiting eventually domestic firms as well. Costa Rica's reforms of its FDI regime, however, have not been as far-reaching as those in the area of trade policy. They have consisted mainly of the abolishment of restrictions on international capital movements, and the partial lifting of foreign ownership restrictions in some economic activities. However, important foreign ownership restrictions still continue in place in activities such as banking and insurance, telecommunications, and energy (Nathan and Associates, 1994). Foreign investment in newspapers and advertising agencies is prohibited, while regulations in the transport and tourism sectors discriminate against foreign investors and set limits to their participation.
had established BITs with Switzerland and Germany, and was in the process of ne-gotiating similar agreements with the United States and Spain. Regional free trade agreements—such as the one subscribed with Mexico in 1994—are also intended to make the country more attractive to foreign investors as they enlarge the size of the market in which Costa Rican goods can be sold duty-free.
The next Section describes the model used to simulate the effects of unilat-eral trade libunilat-eralisation on welfare in Costa Rica, once FDI responses and interna-tional capital income taxation are taken into consideration.
2.3 A Trade Model with Foreign Direct Investment and
Capital Income Taxation
The model we use here is basically a variant of the one used in Chapter 1. The model has been changed in several directions, simplifying it in some aspects and making slightly more complicated in others. First, we have eliminated a number of model features non-essential to the point we want to make in this Chapter. Thus, we now only concentrate on import tariffs and capital income taxes. Similarly, the current version no longer includes a foreign exchange rate, and abstracts from the presence of differences in factor returns across sectors. 7 With macroeconomic and distributional elements no longer being an issue here, the model has also been simplified on those fronts. There is now only one type of good (consumption), one household, and two aggregate factors of production.
On the other hand, we now use a multi-country model structure, where world prices for goods (and factors) are endogenously determined. In this structure, capital is internationally mobile (and inter-sectorally mobile, as in the previous model). In fact, we now distinguish between domestic and foreign capital, and allow for the
;
possibility of different returns to them. The capital allocation issue is now two fold-sectoral and international. The income tax regime in the new version is slightly more complicated in that there is now international capital income taxation, and countries use the tax-credit mechanism when taxing foreign source income. We turn now a fuller description of the new model version.
2.3.1 Production
There are two countries, 8 A and
B,
each producing n goods (n>1), some of which (at least) are tradable. Production technology is similar as in the previous model—in each country a fixed-proportion combination of value added and interme-diate inputs is required (henceforth we use superscripts to denote countries, and omit subscripts to index sectors), with intermediate inputs, in turn, required in a fixed proportion:xA . min
(nA _
zA) ' ' aAX B = min (QB ZB)
ZA = aAXA;
ZB = a B X B .
8In the empirical implementation of the model we consider in fact three "countries," including a "Rest of the World." To keep notation as simple as possible and avoid repetition, throughout this section we abstract from this third region.
where X is gross output, Q is value added and Z represents intermediate inputs.
The as denote the fixed amount of intermediate goods required to produce a unit of output.
Value added requires the use of two primary inputs, labour and capital, L
and K, whose supply is assumed to be fixed. These primary inputs are combined
according to a constant elasticity of substitution (CES) function:
Q A (LA K A ) _ (LA)-crA + ( 1 _ ceA)(KA)-1-*4 (2.5)
QB ( LB , KB) ,),B[aB(LB)-oB + ( 1 _ ct.6)(KB)-aBi--,4 (2.6)
where the Q A s denote value added, the -ys are shift parameters, the as are share parameters and the as reflect the elasticity of substitution between labour and capital
in each country (elasticity, c i = 1/(1 ± a)).
Furthermore, it is assumed that labour is internationally immobile while capital can move freely across countries. Capital used in the production in each country is an aggregate of domestic capital (Kd ) and foreign capital (K,), which are
viewed as imperfect substitutes.' This specification allows for the consideration of the phenomenon of cross-hauling in international capital flows, reflected by balance of payments data. The corresponding aggregate capital function is given by
K A (K" , K ,jrti ) = [6 A (K ,`14 ) - PA + (1— 6A )(Kg) -PA F PIA ; (2.7)