University of Warwick institutional repository: http://go.warwick.ac.uk/wrap
A Thesis Submitted for the Degree of PhD at the University of Warwick
http://go.warwick.ac.uk/wrap/36364
This thesis is made available online and is protected by original copyright. Please scroll down to view the document itself.
Crowd Dynamics
G. Keith Still
PhD Thesis
University of Warwick
Crowd Dynamics
by
G. Keith Still
BSc Physical Sciences
(Robert Gordons Institute of Technology,
Aberdeen 1981)
A thesis submitted in partial fulfilment of the
requirements for the degree of Doctor of
Philosophy in Mathematics
University of Warwick, Department of
Mathematics
Acknowledgments
Although a few words do not do justice to their contribution I would like to
thank the following people for making this work possible. Andy Ward (Aylesbury
Fire Brigade) for his interest and assistance in reaching the right people. The staff
and management at Wembley, especially George Wise (Operations Director,
retired); to Eric Powell and Tom Williams (Cubic Transportation Systems) for their
support in providing access to the initial calibration data. To Frank Wood for his
endless references and pointers to research material. Bill Phillips, Nigel Smithy,
Brian Piggot (who stuck his neck out for me more than once, it was very much
appreciated) and Dr. David Wooley of the Fire Research Station. Dr. Kevin Towler
(International Fire Consultants) for the discussions on the fire safety legislation. The
ACO and staff at the Fire Services College (Morton-on-Marsh) for the
encouragement, video footage and staff discussions during the initial research. Mark
L. Briggs BEM for funding, long before a product became a reality. Stuart
Tracy-Dunn, for believing enough to quit his job and assist in the initial development of the
commercial software and to James Stewart, for developing the Legion-Orator
product against the odds. Douglas Connor for his financial support and the crew at
Legion Crowd Dynamics Ltd for turning the theory and algorithms into worldwide
products. To John Parkinson for researching materials on crowd disasters and Steve
Hicks of the Home Office Emergency Planning College (Easingwold) for his kind
invitation to lecture on crowds extending to a workshop on crowd dynamics.
Special thanks to Ian Stewart for his guidance through all weathers. Without
his tireless moral and academic support it would not have happened, or been as
Declaration
I hereby declare that the dissertation, submitted in partial fulfillment of the
requirements for the degree of Doctorate of Philosophy and entitled "Crowd
Dynamics", represents my own work and has not been previously submitted to this
or any other institution for any degree, diploma or other qualification.
G. Keith Still
Abstract of thesis entitled "Crowd dynamics"
Crowd dynamics are complex. This thesis examines the nature of the crowd
and its dynamics with specific reference to the issues of crowd safety. A model
(Legion) was developed that simulates the crowd as an emergent phenomenon using
simulated annealing and mobile cellular automata. We outline the elements of that
model based on the interaction of four parameters: Objective, Motility, Constraint
and Assimilation. The model treats every entity as an individual and it can simulate
how people read and react to their environment in a variety of conditions. Which
allows the user to study a wide range of crowd dynamics in different geometries and
highlights the interactions of the crowd with their environment. We demonstrate that
the model runs in polynomial time and can be used to assess the limits of crowd
safety during normal and emergency egress.
Over the last 10 years there have been many incidents of crowd related
disasters. We highlight deficiencies in the existing guidelines relating to crowds. We
compare and contrast the model with the safety guidelines and highlight specific
areas where the guides may be improved. We demonstrate that the model is capable
of reproducing these dynamics without additional parameters, satisfying Occam's
Razor. The model is tested against known crowd dynamics from field studies,
including Wembley Stadium, Balham Station and the Hong Kong Jockey club. We
propose an alternative approach to assessing the dynamics of the crowd through the
use of the simulation and analysis of least effort behaviour. Finally we test the
model in a variety of applications where crowd related incidents warrant structural
alterations at client sites. We demonstrate that the model explains the variance in a
variety of field measurements, that it is robust and that it can be applied to future
To my beloved wife Valerie. None of this would
be possible without your love and support
To my children, Harry and Erin, who are the reason
Contents
Acknowledgments i
Declaration ii
Abstract iii
Dedication iv
Table of contents v
List of Tables and Illustrations x
Chapter 1 Introduction Page 1
1.1 Legion Page 1
1.1.1 The least effort algorithm Page 2
1.1.2 Introduction to the Legion tools Page 2
1.2 Brief synopsis of chapters 2 - 9 Page 5
1.3 The Guides Page 6
1.4 Crowds and occupant capacity Page 6
1.5 Nomenclature Page 7
Chapter 2 Crowd problems and crowd safety Page 9
2 Introduction Page 9
2.1 Keeping the crowd out of danger: an overview Page 9
2.2 A catalogue of catastrophes Page 10
2.3 Gate C Page 11
2.4 Players' tunnel Page 13
2.5 The fluid analogy Page 15
2.5.1 Why is the fluid analogy untenable? Page 16
2.5.2 Definition of crowd density Page 16
2.5.3 Crowds find their own levels. Page 16
2.6 Two key questions Page 17
2.7 Ingress safety at Wembley Page 17
2.7.1 Wembley turnstile data Page 18
2.7.2 Wembley ingress capacity Page 19
2.7.3 G and J turnstiles Page 22
2.8 Wembley Complex Station Page 23
2.9 Why we need something different Page 26
2.10 Analysis of the Hillsborough disaster Page 27
2.11 Conclusion Page 29
Chapter 3 Crowd dynamics Page 31
3 Introduction Page 31
3.1 John J. Fruin - Pedestrian planning and design Page 31
3.1.1 Fnlin Level of Service (LoS) Page 32
3.1.2 Anthropomorphic tables Page 34
3.1.4 Fruin. Density v speed Page 37
3.1.5 Green Guide - density v speed Page 38
3.1.6 Fruin v the Green Guide Page 38
3.1.7 Is high density unsafe? Page 40
3.1.8 How long can high density be sustained? Page 41
3.1.9 Is the Fruin Level of Service Wrong? Page 42
3.2 Effects of geometry Page 44
3.2.1 Approach routes to Wembley stadium Page 45
3.2.2 Problems with entry points Page 45
3.2.3 The Wembley Turnstiles (A-M) Page 48
3.3 Network analysis (Green Guide) Page 52
3.3.1 The dynamics of crowds in a network Page 54
3.3.2 Braess's paradox Page 56
3.3.3 Braess's paradox and the Green Guide Page 61
3.4 Review of other simulation systems Page 61
3.4.1 Passenger flow evaluation system Page 62
3.4.2 Egress (SRD, AEA Technology) Page 63
3.4.3 Pedroute Page 64
3.4.4 Exodus Page 65
3.4.5 Rampage - Animation science Page 66
3.4.6 The social force models Page 67
3.5 VEgAS Page 70
3.5.1 The uses of virtual reality in egress analysis Page 71
3.5.2 Intractable parameters Page 73
3.5.3 Flow through a door Page 74
3.6 Conclusions to chapter 3 Page 78
3.6.1 Emergent solution Page 79
Chapter 4 Principles of a simulation Page 81
4 Introduction Page 81
4.1 Key components of a computer simulation Page 81
4.1.1 Defining rules in a simulation Page 83
4.1.2 Modelling movement in a simulation Page 84
4.2 Computer simulation vs network analysis Page 87
4.2.1 Flock of Boids Page 88
4.3 Programming people Page 89
4.3.1 Objective and Constraint Page 90
4.3.2 Motility and Assimilation Page 93
4.4 Crowd psychology Page 95
4.4.1 Psychology and the OMCA rules Page 98
4.5 Conclusions to Chapter 4 Page 99
Chapter 5 Legion Page 100
5 Introduction Page 100
5.1 Choosing the simulation parameters Page 100
5.2 Modelling People Page 101
5.2.1 Choosing the 95th percentile Page 102
5.3 Modelling Space Page 108
5.3.2 Component definitions Page 110
5.3.3 Component communication Page 110
5.3.4 Example of iSpace coding Page 111
5.3.5 iSpace objectives Page 111
5.3.6 Self-organised environments Page 112
5.4 Modelling movement Page 113
5.5 Modelling crowds Page 113
5.5.1 How people move, a random walk Page 114
5.5.2 Compensating for the random walk Page 116
5.5.3 The rules in a crowd Page 117
5.6 Intractability of collision detection Page 118
5.6.1 Overcoming computational intractability Page 118
5.7 The Legion solution Page 119
5.7.1 Exploiting short cuts Page 121
5.7.2 Speed profiles in people and crowds Page 121
5.7.3 Filling space Page 123
5.7.4 Crowd clustering Page 124
5.7.5 Collective intelligence Page 127
5.7.6 Influences of geometry Page 127
5.7.7 Self-organization Page 128
Chapter 6 Validation of a computer model Page 129
6 Introduction Page 129
6.1 Validation components Page 130
6.1.1 Component testing Page 131
6.1.2 Functional validation Page 132
6.1.3 Qualitative validation Page 133
6.1.4 Quantitative validation Page 133
6.2 Observations and procedures Page 136
6.2.1 Validation stages Page 138
6.3 The validation tool Page 140
6.3.1 Validation tool output Page 140
6.3.2 Scales used in the maps Page 142
6.3.3 Fluxing and space utilisation Page 143
6.3.4 The Legion maps Page 144
6.4 Qualitative validation of Legion Page 145
6.4.1 Validating the edge effect Page 146
6.4.2 The entity objective Page 147
6.4.3 The entity position map Page 148
6.4.4 Dynamic and static density Page 152
6.4.5 Space utilisation Page 153
6.4.6 Dynamic and static maps Page 155
6.4.7 Validating the finger effect Page 156
6.4.8 Validating crowd compression Page 159
6.4.9 Validating the human trail Page 159
6.5 Quantitative validation of Legion Page 167
6.5.1 The Fruin data Page 167
6.5.2 Validation against Togawa Page 169
6.5.4 Validation against Fruin Page 171
6.5.5 Validation against Paulsen Page 173
6.6 Validation conclusions Page 174
Chapter 7 Case Study 1: Balham Station Page 175
7 Introduction Page 175
7.1 Ticket hall operations Page 176
7.1.1 Poisson probability distribution Page 177
7.1.2 Service time distribution Page 177
7.1.3 Queuing models Page 178
7.1.4 Spreadsheet modelling Page 180
7.1.5 The queuing problem Page 182
7.1.6 Focal route analysis Page 184
7.1.7 Service time distribution Page 185
7.2 Balham Station operation Page 186
7.2.1 The Legion model Page 186
7.2.2 Determining focal routes with Legion Page 187
7.2.3 Short-cut analysis - the "ant" algorithm Page 188
7.2.4 Ticket hall - space utilisation Page 188
7.2.5 Ticket hall - creating mode space Page 190
7.3 Queuing Page 191
7.4 Multiplex views Page 192
7.5 Problem Analysis Page 192
7.6 Analysing crowd behaviour Page 193
7.7 Conclusions to the Balham Study Page 194
7.8 Implications for Legion Page 195
Chapter 8 Case Study 2: The Hong Kong Jockey Club .. • • Page 196
8 Introduction Page 196
8.1 Overview of the Hong Kong Jockey Club Page 196
8.2 Attendance statistics Page 196
8.3 Area I - Happy Valley public entrance Page 197
8.4 Public entrance - focal route analysis Page 199
8.4.1 Public entrance statistics Page 201
8.4.2 Ingress rates - flux Page 202
8.4.3 Public entrance - present design Page 203
8.4.4 Alternative designs Page 205
8.4.5 The Legion simulations Page 207
8.4.6 Conclusion: Public entrance Page 211
8.5 Area III - Happy Valley infield tunnel Page 212
8.5.1 Infield tunnel statistics Page 214
8.5.2 Infield tunnel entrance Page 215
8.5.3 Details of the infield tunnel Page 219
8.5.4 Resolving the problems Page 220
8.5.5 Conclusion: Infield tunnel Page 221
8.6 Area IV - Sha-Tin - Gate 1 Page 223
8.6.1 Gate 1 statistics Page 224
8.6.2 As-is model: Gate 1 Page 226
8.6.4 Shortening the distance Page 229
8.6.5 Arranging the space Page 230
8.6.6 Conclusion: Gate 1 Page 232
8.7 Area V - Sha-Tin - Concourse Page 233
8.7.1 KCR entrance/exit system - present system. Page 237
8.7.2 Egress considerations Page 237
8.7.3 Evacuation procedures Page 239
8.7.4 Modelling evacuation Page 239
8.7.5 Alternative for safe egress Page 241
8.7.6 Study points for the simulation Page 244
8.7.7 Conclusion: Concourse simulation Page 245
Chapter 9 Conclusions Page 246
9 Introduction Page 246
9.1 The crowd simulation criteria Page 249
9.1.1 A crowd consists of many individuals Page 250
9.1.2 Individuals exploit short cuts Page 250
9.1.3 Not filling to its own level Page 251
9.1.4 Crowds cluster Page 252
9.1.5 No collective intelligence Page 252
9.1.6 Crowds are influenced by geometry Page 253 9.1.7 Crowds self organise at high density Page 254
9.2 The work to date Page 255
9.2.1 The applications Page 256
List of Tables and Illustrations
List of Tables
1 Pg 19 Gate C statistics - ingress counts over several football matches. 2 Pg 24 Fruin Level of Service categories (converted to metres) 3 Pg 32 Fruin Level of Service summary
4 Pg 34 Anthropomorphic sizes of the worlds population
5 Pg 39 Calculated speed v density relationship from the Green Guide
6 Pg 171 Data from field study at Liverpool Street Station (London Underground) 7 Pg 172 Speed and density from Liverpool Street Station
List of illustrations
1 Pg 3 Legion replayer model screen shot. Olympics Stadium and general layout. 2 Pg 4 Sydney Olympic Park. General plan and location of stadium
3 Pg 4 Screen shot of validation tool
4 Pg 11 Wembley stadium - gate C - gap in fence
5 Pg 12 Gate C Wembley Stadium. Gap in fence and people coming up stairs 6 Pg 12 Gate C pre-event use of grass embankment
7 Pg 13 Gate C using the gap as a short cut from the embankment. 8 Pg 14 Plan of Gate C showing the flow of people up the embankment. 9 Pg 14 View from players' tunnel of bidirectional crowd flow.
10 Pg 15 Zoom of Figure 14 showing the bidirectional movement and fingering patterns 11 Pg 18 Aerial view of Wembley stadium showing the location of the gates
12 Pg 19 Histogram of the turnstile usage of gate C - averaged over several events. 13 Pg 21 14th April 1991 - Counts per minute - ingress at turnstiles
14 Pg 21 14th April 1991 - Cumulative entry count - ingress at turnstiles 15 Pg 21 18th May 1991 - Counts per minute - ingress at turnstiles 16 Pg 21 18th May 1991 - Cumulative entry count - ingress at turnstiles 17 Pg 21 31 March 1993 - Counts per minute - ingress at turnstiles 18 Pg 21 31' March 1993 - Cumulative entry count - ingress at turnstiles 19 Pg 21 14th May 1994 - Counts per minute - ingress at turnstiles 20 Pg 21 14th May 1994 - Cumulative entry count - ingress at turnstiles 21 Pg 22 Plan of G, H and J turnstiles at Wembley Stadium
22 Pg 23 View of dense crowd outside G, H and J turnstiles - showing no direction 23 Pg 24 Enlarged plan of Wembley complex station platforms and bridge.
24 Pg 25 Station platforms as seen from Wembley Hill Road.
25 Pg 25 The queue of 20,000 supporters waiting for the train on South Way. 26 Pg 26 View of unregulated queues spilling onto Wembley Hill Road 27 Pg 28 Plan of Leppings Lane end of the grounds at Hillsborough Stadium. 28 Pg 33 The Fruin Labourer compared to the Author 99 percentile
29 Pg 33 Fruin Level of service shown with metric scale and bodyspace 30 Pg 35 Anthropomorphic sizes shown by weight and area
31 Pg 36 Fruin Level of service D (at one person per square metre)
32 Pg 37 Fruin speed v density relationship (from Pedestrian Planning and design) 33 Pg 40 Comparison of speed v density. Green Guide, Togawa and Fruin. 34 Pg 41 Gate C packing density exceeding 4 people per square metre 35 Pg 44 Wembley Stadium approaches and local area.
36 Pg 45 Wembley plan showing the main routes taken by spectators 37 Pg 48 The Wembley turnstiles (A-M)
38 Pg 49 Plan of gate D and turnstiles at Wembley Stadium 39 Pg 49 Graph of turnstile usage at Gate D
42 Pg 51 Plan of gate G and turnstiles at Wembley Stadium 43 Pg 51 Graph of turnstile usage at Gate G
44 Pg 53 Diagram from the Green Guide showing network analysis of egress system. 45 Pg 55 Photograph of crowds turning a corner (low density)
46 Pg 56 Photograph of crowds turning a corner (high density) 47 Pg 57 Network of four roads as a cost for travel
48 Pg 58 Network from Figure 47 showing additional road and increased cost. 49 Pg 75 Virtual reality screen shot - showing people moving through a door gap. 50 Pg 76 Graph of flow rate v door width
51 Pg 76 Illustration from New Scientist article on door widths - without barrier 52 Pg 76 Illustration from New Scientist article on door widths - with barrier 53 Pg 77 Graph of enhanced flow using barrier.
54 Pg 83 Three ball collision on a billiard table. 55 Pg 91 Shortest route to pens 3 and 4 at Hillsborough.
56 Pg 93 Speed distribution graph of the crowds at the Hong Kong race meetings. 57 Pg 102 Normal distribution curve - showing frequency distribution of stature 58 Pg 103 Illustration of packing different body sizes 4 people per square metre 59 Pg 104 Illustration of body area as both area and smallest rectangle
60 Pg 105 Packing 8.4 people per square metre
61 Pg 106 Wembley stadium concourse Level B during ingress 62 Pg 107 Wembley stadium close packed bi-directional crowd flow 63 Pg 107 Orientation of a body space onto a 10 cm grid
64 Pg 108 Graphic of 30 cm grids packed to highest possible density. 65 Pg 115 Screen shot of a model of entities navigating with a random walk 66 Pg 117 Screen shot of entities using a course correction algorithm 67 Pg 118 Graph of a non polynomial time collision detection algorithm 68 Pg 119 Graph of the Legion algorithm showing polynomial time 69 Pg 122 Photograph of plan (Figure 123) showing location of concessions 70 Pg 123 Plan of area of outer concourse at Wembley stadium
71 pg 124 Photograph of a platform illustrating that density is not evenly distributed 72 Pg 125 Queues are static (standing waves) in space, but the people are changing 73 Pg 126 A small group of people in a moving crowd creates a static cluster
74 Pg 126 Crowds have dynamic clusters which alter flow rate calculations (cluster in time) 75 Pg 128 Entity turning a corner by a series of straight lines
76 Pg 141 Screen shot of the validation tool, illustrating both the fluxed and on fluxed entities 77 Pg 143 Scale (Blue to Red) for the speed ergodic maps
78 Pg 143 Scale (Green to Red) for the density ergodic maps
79 Pg 147 Screen shot of the validation tool showing the bottleneck experiment 80 Pg 149 Screen shot of the validation tool showing the bottleneck after 1 second 81 Pg 149 Screen shot of the validation tool showing the bottleneck after 5 seconds 82 Pg 149 Screen shot of the validation tool showing the bottleneck after 240 second2 83 Pg 150 Screen shot of 240 Seconds after initialisation. Dynamic Density Map Bottleneck 84 Pg 150 Screen shot of 240 Seconds after initialisation. Speed Average Map Bottleneck 85 Pg 151 Speed distribution histogram for the edge effect experiment.
86 Pg 151 Graph of the edge effect speed profile 87 Pg 151 Graph of the edge effect density profile
88 Pg 152 Showing the wake of free space around corners in free flowing areas 89 Pg 152 Photograph of unused space on Olympic Way (Wembley Stadium) 90 Pg 154 Screen shot of validation tool illustrating the space utilisation map 91 Pg 155 Graph of cross sectional density from the edge effect experiment 92 Pg 157 Progression of entities in a bidirectional flow model (1)
93 Pg 157 Progression of entities in a bidirectional flow model (2) 94 Pg 157 Progression of entities in a bidirectional flow model (3) 95 pg 157 Progression of entities in a bidirectional flow model (4) 96 Pg 157 Progression of entities in a bidirectional flow model (5) 97 pg 157 Progression of entities in a bidirectional flow model (6)
98 Pg 158 Photograph illustrating the ease of following the natural flow of the crowd. 99 pg 160 Screen shot of the QB45 tool for analysis of the evolution of trails
101 Pg 162 Screen shot after 5 frames of assimilation as the circle erodes
102 Pg 162 Screen shot after 10 frames of assimilation showing the formation of islands 103 Pg 162 Screen shot after 15 frames of assimilation showing erosion in corners 104 Pg 162 Screen shot after 19 frames of assimilation with entities at origins
105 Pg 162 Screen shot after 20 frames of assimilation blanked during the erosion algorithm 106 Pg 162 Screen shot after 23 frames of assimilation with entities starting from origins 107 Pg 162 Screen shot after 23 frames of assimilation with entities running through model 108 Pg 162 Screen shot after 25 frames of assimilation symmetry being established 109 Pg 162 Screen shot after 27 frames of assimilation model nearing equilibrium 110 Pg 162 Screen shot after 30 frames of assimilation dynamic equilibrium
111 Pg 162 Screen shot after 20 frames of assimilation, same model with fewer entities 112 Pg 162 Screen shot after 30 frames of assimilation, solution same but with narrower paths 113 Pg 164 Screen shot after 15 frames of assimilation, the tracks begin to form
114 Pg 164 Screen shot after 18 frames of assimilation, some of the tracks lose use
115 Pg 164 Screen shot after 19 frames of assimilation, under used track allow greater growth 116 Pg 164 Screen shot after 20 frames of assimilation, now the track has died
117 Pg 164 Screen shot after 23 frames of assimilation, the entities start to erode a new path 118 Pg 164 Screen shot after 25 frames of assimilation, the nodes form in equilibrium points 119 Pg 164 Screen shot after 30 frames of assimilation, nodes half way down the path 120 Pg 164 Screen shot after 39 frames of assimilation, erosion along the path
121 Pg 164 Screen shot after 40 frames of assimilation, as the new path forms by erosion 122 Pg 164 Screen shot after 45 frames of assimilation, we can see the least effort evolve 123 Pg 164 Screen shot after 48 frames of assimilation, the final solution is minimum effort 124 Pg 164 Screen shot after 60 frames of assimilation, shortest routes now fully evolved. 125 Pg 165 Path forming from hole in fence towards the camera position
126 Pg 166 Path formed over several months of field erosion.
127 Pg 167 Graph of the Fruin data showing density (square metre per person) against speed. 128 Pg 168 Graph of Fruin data showing density (people per square metre) against speed 129 Pg 168 Graph of Legion output against the Fruin data (along horizontal and all angles) 130 Pg 169 The Togawa graph of speed v density (in people per square metre)
131 Pg 169 Comparison of the Fruin, Togawa and Green Guide speed v density relationship 132 Pg 170 Graph of the Legion data against the Green Guide data for speed v density 133 Pg 171 Graph of Legion data against Fruin data showing the effect of adding noise. 134 Pg 172 Graph of the London Underground data showing deviation from the Fruin curve. 135 Pg 172 Graph of London Underground data against a modified Legion speed distribution 136 Pg 172 Graph of the measured speed distribution from the London Underground study. 137 Pg 173 Graph of the Legion, Green Guide and London Underground study
138 Pg 174 Graph of the results from the Paulsen evacuation model 139 Pg 175 Schematic of Balham station (CTS plan)
140 Pg 176 View from security camera showing the pillar and the congestion in the ticket hall 141 Pg 180 Spreadsheet model of queuing theory. Poisson arrivals, exponential service time. 142 Pg 181 Spreadsheet model of queuing theory for the manual gate (single server)
143 Pg 181 Split screen view of the ticket hall and the gates from cameras in the ticket hall 144 Pg 182 The average queue depth conforms to the model for a single server.
145 Pg 183 Split screen view of the ticket hall showing a single server queue 146 Pg 183 Split screen view showing two servers and not queue.
147 Pg 184 Schematic of the ticket hall - preparation for a Legion model. 148 Pg 185 Focal route analysis showing the intersections where conflicts occur 149 Pg 186 Virtual reality model of the ticket hall showing main flow paths
150 Pg 189 Using the Legion model in an "ant" searching mode - finding the focal routes. 151 Pg 190 Testing configuration 1 in the Legion model - using the space utilisation map 152 Pg 190 Testing configuration 2 in the Legion model - showing the effect of a small change 153 Pg 197 Graph of the attendance figures for the Hong Kong Jockey Club
154 Pg 197 Graph of the drop in attendance for the Sha-Tin race course over the years 155 Pg 198 Plan of the Happy Valley race course in Hong Kong. Indicating areas land 156 Pg 198 Schematic of the run-in area to the Public Entrance of Happy Valley race course 157 Pg 198 Photograph of the entrance to the public enclosure at Happy Valley
160 Pg 200 Public entrance statistic for turnstile usage (averaged over several events) 161 Pg 201 Public Entrance ingress statistics for Happy Valley (afternoon session) 162 Pg 201 Public Entrance ingress statistics for Happy Valley (evening session) 163 Pg 202 Routes and flow rates measured from the video tapes of the Public Entrance
164 Pg 203 The queue exceed the depth predicted by queuing theory - conflicts with focal route 165 Pg 205 Focal route analysis of scenario 1, kiosk upper right - queue discipline 1
166 Pg 205 Focal route analysis of scenario 2, kiosk upper right - queue discipline 2 167 Pg 206 Focal route analysis of scenario 3, kiosk on lower right
168 Pg 206 Focal route analysis of scenario 4, smart card operation
169 Pg 207 Schematic of the Public Entrance indicating area where people arrive and wait 170 Pg 208 Schematic of the Public Entrance indicating changes
171 Pg 208 Space utilisation map of the present configuration of the Public Entrance 172 Pg 208 Results from the Legion mode showing the simulation v reality.
173 Pg 209 Space utilisation map of scenario 1 174 Pg 209 Space utilisation map of scenario 2 175 Pg 209 Space utilisation map of scenario 3 176 Pg 210 Space utilisation map of scenario 4
177 Pg 210 Space utilisation map comparison of the two different queuing regimes 178 Pg 212 Plan of the Infield tunnel at Happy Valley racecourse in Hong Kong 179 Pg 212 Entrance area of the Infield Tunnel.
180 Pg 213 Entrance stairs to the Infield Tunnel - looking down
181 Pg 213 Entrance stairs to the Infield Tunnel - looking up from the bottom. 182 Pg 214 Photograph of the infield tunnel from the bottom of the stairs 183 Pg 214 Photograph of the stairs at the far end of the infield tunnel 184 Pg 215 Graph of the simulation results against the turnstile count. 185 Pg 216 Infield Tunnel ingress statistics afternoon session
186 Pg 216 Infield Tunnel ingress statistics afternoon session
187 Pg 219 Schematic of the Infield Tunnel - showing waiting points and turnstiles 188 Pg 220 Simulation model run of the Infield Tunnel
189 Pg 221 Schematic of the proposed changes for the Infield Tunnel
190 Pg 222 Space utilisation map of the Infield Tunnel after the safety features are added 191 Pg 222 Space to the right of the entrance allow the safety feature installation. 192 Pg 223 Plan of the two areas modelled at the Sha-Tin racecourse Hong Kong. 193 Pg 224 Photograph of the approach to the Gate 1 kiosks and turnstiles at Sha-Tin 194 Pg 224 Photograph of attendant shouting at patrons to use the appropriate turnstiles 195 Pg 225 Gate 1 distribution statistics - cumulative data averaged over several events 196 Pg 225 Gate 1 ingress statistics for 301 January 1998 showing the timed counts 197 Pg 225 Ingress rates at Sha-Tin racecourse. Peak time flow rates.
198 Pg 225 Sha-Tin moving average of the count from the ramp to the straight walkway. 199 Pg 226 Sha-Tin ratio of people walking down the ramp to those walking along the straight 200 Pg 227 Photograph of the queuing at the Gate 1 kiosks in line of sight.
201 Pg 228 Focal route analysis of the turnstile at Gate 1 202 Pg 228 Simulation of Gate 1 present design.
203 Pg 229 Space utilisation map of the present design of Gate 1 204 Pg 229 Simulation of the scenario 1 proposed for Gate 1 205 Pg 229 Scenario 1 space utilisation map
206 Pg 231 Scenario 2 space utilisation map
207 Pg 231 Graph of the comparisons of the two scenario space utilisation maps. 208 Pg 234 Left hand segment of the egress system at Sha-Tin main concourse 209 Pg 234 Middle segment of the egress system at Sha-Tin main concourse 210 Pg 234 Right hand segment of the egress system at Sha-Tin main concourse
211 Pg 235 Left hand segment of the egress system showing both ingress and egress routes 212 Pg 235 Photograph of the egress system (empty)
213 Pg 235 Photograph of the egress system (full)
214 Pg 236 Photograph inside the pen of the egress system during egress
215 Pg 236 Photograph of the view from the control gate of the bridge and platform 216 Pg 240 Simulation of the egress system during an egress analysis
219 Pg 242 30 second entity position of the egress system during reverse flow 220 Pg 242 30 second density map of the egress system during reverse flow 221 Pg 242 45 second entity position of the egress system during reverse flow 222 Pg 242 45 second density map of the egress system during reverse flow 223 Pg 242 60 second entity position of the egress system during reverse flow 224 Pg 242 60 second density map of the egress system during reverse flow 225 Pg 243 Scenario 1 entity position map during egress (15 seconds) 226 Pg 243 Scenario 2 entity position map during egress (15 seconds) 227 Pg 243 Scenario 1 entity position map during egress (30 seconds) 228 Pg 243 Scenario 2 entity position map during egress (30 seconds) 229 Pg 243 Scenario 1 entity position map during egress (45 seconds) 230 Pg 243 Scenario 2 entity position map during egress (45 seconds) 231 Pg 244 Scenario 1 entity position map during egress (60 seconds) 232 Pg 244 Scenario 2 entity position map during egress (60 seconds)
233 Pg 245 Comparison of the egress rates for scenario 1, 2 against the original design 234 Pg 253 Egress route from Wembley Stadium - showing exit gates
235 Pg 253 Egress route from Wembley Stadium - showing focal routes
Chapter 1 Introduction
Crowd dynamics can be defined as the study of the how and where crowds
form and move above the critical density of more than one person per square metre.
At this density there is the potential for overcrowding and personal injury.
We examine different approaches used to define crowd safety, in particular
the Green Guide [1,21 which defines the criteria for sporting grounds, the Purple
Guide [3, 4] which defines the criteria for pop concerts and similar events and the
Primrose Guide [5] which defines the criteria for existing places of entertainment.
We examine the relationships between crowd flow and density, specifically
the work of Fruin [6] who has been instrumental in setting the standards for
pedestrian planning around the world. We also examine the work of Ando, Aoki and
Togawa [7, 8, 9, 10], Henderson [11, 12], Helbing [13, 14, 15, 16, 17, 18, 19, 20],
Galea [23, 24], Paulsen [25], Cohen [26, 27] and Penn [28].
In addition to the existing body of literature and guides we perform extensive
field studies to examine the nature of crowd dynamics with respect to local
geometry, for example, building entrances, turnstiles and corridors. Case studies,
Balham Station, Wembley Stadium and the Hong Kong Jockey Club are presented.
1.1 Legion
Legion is the name used to describe the collection of programmes developed
to analyse the dynamics of crowds. The heart of this suite there is an algorithm
which models the dynamics of the crowd by using a least effort algorithm. It treats
every person (entity) in the crowd as an individual, calculating their positions by
1.1.1 The least effort algorithm.
Suppose we have N entities, with an entity i at position (xi, yi) inside a region
R of the plane R2, representing the accessible parts of a building. Each entity's path
Pi through the building is constrained: first, by the entity's speed distribution, and
secondly by the requirement that entity i visit certain places or subregions of the
building in some order. Call the set of all these constraints on the entity i's path C,.
There are also non-collision constraints Kii which asserts that entities i and j
cannot occupy the same position at the same time. There is a cost function u(P1) for
example, length, total time, effort. For a set P of paths P, satisfying constraints C.
and Kii, there is a total cost U(P) = u(P I ) + + u(P„). The problem is to minimize
U(P) subject to those constraints, thereby finding the set of paths (flow pattern of the
crowd) that requires the least effort (in total). This optimization problem can be
solved by a type of simulated annealing, iteratively starting from a set of paths P,
randomly varying it, seeing if the cost goes down, and if so choosing the cheaper set
of paths; then repeat. The algorithm stops when it fails to improve the solution.
It can be shown that the algorithm solves the problems of calculating the
dynamics of large (>100,000 individuals in a simulation) in polynomial time.
Further detail of the algorithm is subject to a commercial non disclosure
agreement. However, we discuss its inputs, outputs and the validation process in this
thesis. We also examine the emergent phenomena, unique to crowds, which can be
examined using the simulation suite and the least effort algorithm.
1.1.2 Introduction to the Legion tools
5VCDO SJuniairi in14:141- Data Sat.', 2 lin '.3i.witaa.ra 22'h 11114: 22 : fatal Entitiaa In: 2112
model builder and simulator (commercial products developed for client projects) and
a replayer, which allows the clients to view, review and analyse their models.
With Legion it is possible to alter various parameters and study the effects of,
for example, increasing the crowd density. The use of a simulation provides us with
two important perspectives. Firstly, the simulation provides us with insights to the
nature of crowd dynamics. Often it is the insight to the problem that leads us to the
solution. Secondly, the simulation can be used to prove or disprove a variety of
relationships observed in the crowd, for example, it is presently assumed that
doubling the width of an egress route will double the flow of people on that route,
but this turns out to be wrong.
Applications include modelling multi-venue events, such as the Olympics
Games. Figure
1
shows the screen display from the Legion replayer and Figure 2 [image:20.595.80.503.434.746.2]shows the plan of the same area of the Sydney Olympic Park.
I
'n
.--...aflaggridital\ . '.. n IN
i \i
ronea*.e4aura.“1AErVy .\
•••••,,,,,,A1 11/^.1.-..,,, 1 101,7..131701411JIM /Oat.
Z el Zit ._...0013111111111. /1010,60./. /SO • 4(.19':•LOMI
4-54:44 4
ya, Cy I h ya an wy
'.70011741MantEIVAWRingUiVVEWOMI•
fXaga"P''...g..*.g12Etg!kiai.r • :k
.56-Figure 2 - Sydney Olympic Park. General plan and location of stadia.
The boulevard and rail station are a common domain for all venues. Loading
[image:21.595.115.462.46.374.2]and unloading crowds are simulated using the Legion system (Figure 1).
[image:21.595.117.464.457.716.2]Figure 3 shows the validation tool displaying the entities (yellow dots)
moving along two corridors (grey = walls). During the simulation run the entities
move around the screen, avoiding each other and the local geometry.
1.2 Brief synopsis of chapters 2 - 9
In chapters 2 and 3 we discuss the various problems relating to crowd
movement and crowd safety. We discuss the problems of applying the present
guidelines and review the various methodologies used to assess crowd safety. We
also discuss the application of a variety of techniques presently used to model
crowds and review the existing literature.
Chapter 4 discusses the principles of computer simulation, the problems of
developing a suitable model of crowd dynamics and the parameters required for
accurate crowd modelling. We relate the psychological factors of human decisions to
a mathematical framework, using the four rules which define the least effort
algorithm.
In chapter 5 we discuss the various inputs to the Legion simulation suite, why
they were chosen and the relevance they have in determining the parameters for
assessing crowd risk and crowd safety. The entity behaviour, and its significance to
simulating crowd dynamics are also discussed in chapters 5 and 6.
Chapter 6 discusses the validation of the algorithms and compares the results
to field observations and historical studies. We examine the qualitative and
quantitative data, the results of the Legion analysis and the emergent phenomena
which are unique to crowds.
Chapter 9 draws the previous chapters to a conclusion and indicates the scope
of the simulation, how and where it should be applied and the potential future
developments of the Legion methodology.
It is important to understand the frame work for the development of these
tools and we need to outline the various guidelines which are used to define crowd
safety in places of public assembly.
1.3 The Guides
There are a number of documents which have been produced to advise on
crowd safety issues. The relevant documents are the Green, Purple and Primrose
Guides. The guides are advisory documents for use by competent persons. They are
the distillation of many years of research and experience of the safe management and
design of places of public assembly. The guides have no statutory force but many of
their recommendations are given force of law at individual sites by their inclusion in
safety certificates issued under the Safety of Sports Grounds Act 1975 or the Fire
Safety and Safety of Places of Sport Act 1987. The advice given in the Guides is
without prejudice to the application of the appropriate building regulations, the
Health and Safety at Work Act 1974, and any other relevant legislation.
1.4 Crowds and occupant capacity
The maximum size of the audience for a particular event is generally
determined by the licensing authority (taking advice from the fire authority) and is
known technically as the "occupant capacity". This will include all ticket holders,
finding the total area available to the public (in square metres) and multiplying by 2,
where 2 = 2 people per square metre. For example: An outdoor site measuring 100
metres x 50 metres with all areas available to the public could accommodate a
maximum of 10,000 people (100 x 50 = 5,000 sq. metres x 2 = 10,000 people). We
will discuss the naivety of this type of calculation in later chapters.
1.5 Nomenclature
Crowds have certain characteristics which are part fluid, part granular and
part psychological reaction. The nomenclature we will use as follows.
Unimpeded speed The individual, free space, walking speed
Least effort The easiest path or route from A to B that individuals
take as they progress through an environment. This can
be reduced to two simple algorithmic rules.
1. Individuals will take the shortest available
route to get from source to destination.
2. Individuals try to move at their normal speed.
Focal routes A focal route is the shortest (least effort) path an
individual would take to reach their destination.
Crowd speed The emergent speed of a group of individuals. The
speed/density relationship is not a constant value but is
a function of the local geometry and the interactions
within the group/crowd.
Space utilisation The use of space over time (that is the relative
proportion of time in which a given region of space is
occupied). An area of low space utilisation is rarely
used and an area that is in constant use has a high
space utilisation.
There are other effects which we introduce during the discussion on
validation in chapter 6. These relate to the emergent phenomena unique to crowds,
such as the fingering effect seen in areas of high density bidirectional flows, crowd
compression effects which alter the dynamics of crowd movement, and edge effects
where speeds are distributed within the crowd.
The author has attended and worked alongside many crowd safety engineers,
security staff, stadium managers, computer programmers and mathematicians for the
last 10 years. The author also lectures at Easingwold, (the Home Office Emergency
Planning College) to those people responsible for the safety of crowds at public
venues. The inclusion of the photographs, illustrations and diagrams, are based on
Chapter 2 Crowd problems and crowd safety.
2
Introduction
In this chapter we discuss the problems of crowd dynamics and the fluid
analogy, using areas of Wembley Stadium to illustrate various crowd safety features.
2.1 Keeping the crowd out of danger: an overview
Designing an effective evacuation (egress) strategy for places of public
assembly is a formidable problem. Every building is unique and operational
efficiency during emergency egress cannot be fully tested until a real crisis occurs.
To ignore the danger is to deserve the disaster. Therefore the challenge is in
anticipating the problems that may occur during an emergency, especially where
they relate to the complexity of human behaviour. If the design could be constructed
in advance, it would be possible to perform qualitative and quantitative risk
assessment by destructive testing. Unfortunately it is not feasible to test every layout
for every possible scenario. It is also unethical to expose people to real emergencies
in order to analyse their behaviour and reactions.
Computer simulations are one method of addressing the problem. A range of
network flow, crowd and egress analysis systems are available on the market. They
are all useful, but no single system provides a comprehensive range of scenario
testing for safety engineering purposes. Many treat human traffic as blocks of
uniform individuals moving as one. Some systems use the mathematics of fluid
dynamics to predict human flow patterns. Some systems are based on assumptions
that are fundamentally flawed.
misinterpretation. These need to be highlighted and an alternative methodology used.
The objective of this research was to develop a model of crowds, specifically
aimed at the issues of, and to define numerical standards for, crowd safety.
As stadia have been part of our culture for the last four thousand years why
do we need a tool for assessing crowd safety? The following catalogue of disasters
from around the world answers that question.
2.2 A catalogue of catastrophes
There are dangers associated with large gatherings. Every year there are
reports of overcrowding and crushing incidents from around the world. To put the
problem into perspective, the following list highlights just some of the events that
have ended in tragedy.
1964 - 300 die in a stampede after goal disallowed, Olympic qualifying match. Lima, Peru.
1968 - 74 died when a crowd stampeded after burning paper was thrown onto terraces. Fans head towards a closed exit and are crushed against the doors. Buenos Aires.
1971 - 66 died when barriers in Ibrox collapse during football match. Glasgow, UK. 1974 - 49 trampled to death as crowds break barriers. Cairo.
1979 - 24 died and 27 injured in a stampede as fans stampede during a light failure. Nigeria
1981 - 24 died in a stampede as fans rush to leave ground. Piraeus, Greece.
1981 - 38 injured during a crowd surge at Hillsborough Stadium. Sheffield, Great Britain.
1982 - 340 died at European Cup Match between. Incident occurs when fans, leaving stadium, try to re-enter after last minute goal. Moscow, Russia.
1982 - 24 died and 250 injured in a stampede, caused when drunken fans provoke a stampede. Cali, Columbia.
1985 - 10 died and 29 injured trying to force their way into a stadium. Mexico City.
1989 - 95 died when police open gates to alleviate crowding. Hillsborough, Sheffield, UK. 1990 - 1,426 died in stampede in overcrowded pedestrian tunnel. Mecca, Saudi Arabia.
1991 - 40 died along fences when fans try to escape fighting. Orkney, South Africa.
1992 - 50 injured falling from upper tier of Maracana Stadium when part of the fence gave way when 150,000 fans await the Brazilian championship final. Rio de Janerio.
1994 - 270 died in a stampede during "stoning the Devil" ritual. Mecca, Saudi Arabia.
1996 83 died and 180 injured at a World Cup qualifying match. Guatemala City. 1998 150 Muslim pilgrims crushed to death in a stampede. Mecca, Saudi Arabia.
1999 Jan 15th - 51 Hindus killed and 100 injured in a stampede after part of a shrine collapsed. Over 1.5 million present at ceremony. Kerala, India.
1999 May 31' - 54 dead, 150 injured, 78 hospitalized (35 still on critical list) when a crowd of 2,500 rushed to get out of the rain at the railway station. Minsk, Belarus.
2000 June 28th - 8 trampled to death at rock festival. Roskilde, Copenhagan, Denmark.
2000 - July 12"1- 12 die, dozens injured as crowd flees from police tear gas. Harare, South Africa.
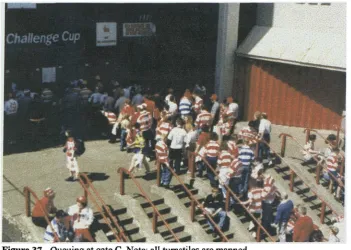
2.3 Gate C
Crowd behaviour can be anticipated, even when it appears counterintuitive.
Figure 4 shows the top of the stairs at gate C of Wembley. There is a gap in the fence
' where supporters can take a short cut by walking up the embankment and ducking
[image:28.595.120.476.523.739.2]under the hand rail (Figures 5, 6 and 7).
The view of the short cut is shown in Figure 4, as seen from the approach to
gate C along the main concourse. As the crowd occupies the grass embankment
(Figure 6) it is natural for those people simply to use the available gap in the fence as
a short-cut (Figure 7).
Figure 5 - Gate C with people waiting and coming up the embankment
Figure 6 - Gate C - the embankment is used as a seating area prior to entry
However, a few people cutting through this gap do not explain why a large
number of people are held back on the stairs. The area on the upper stairs, in front
of the turnstiles, is 15 by 7 metres (105 square metres) and counts of 400 to 500
Figure 7 - Using the short cut from the embankment to the turnstiles.
Between 3 and 5 people per square metre are typical of the normal ingress
density. When patrons exploit the short cut under the railing, a triangular phalanx
forms which pushes toward the turnstiles (Figure 8) this impedes the flow of patrons
on the stairs. The phalanx creates a lateral pressure across the top concourse,
pinching off the crowd flow up the stairs. The problems are: how to assess the
impact of this flow, and how to optimize the crowd dynamics for these turnstiles.
2.4 The players' tunnel
Between B and C turnstiles there is a tunnel where the players enter the
stadium (bottom left in Figure 8). This area is a focus of attention when the team
coaches arrive.
The crowd is held clear of the road by police horses. When the coaches pass
into the tunnel the horses move aside and the two crowd, to the left and right of the
Triangular Phalanx
4.
IN
a ...• ....• ... ... II__
---
lc :
. ., vr: 112....• ...•• ...• ,:M.. ..""*.0.. ..„.w...... ,=W... .....o....w...-- ... ... .......„ ...,.___... •••..•• ... ... ....o ...'''. ''''•...., ...•••.... - ' ' . . ...„ ....,... . . . • IS S IS r". .= .1....Z.-. ."... . • • . . • . ' ' .••n_2•.2.. .d...' .u.... ... : + ' ' ' ' 'V/ f.h ' ' . ' ''. • . •• • . " ' ' . ' ' . . '' ' " '.."...-....•••••n • . '
.=:._ ... ex... ''''----tr=••n••- =. '.'' '''''' ''''''. ....,_. ...___ ... ...n• •"' ... '.'.-.. ...
M. . . • . ' — -. . . .r...„ • ' ' " ". a m . .., ' ' ' ' ... . .. . . 7._. ..__ __ . ' ' " ' ' . . ••w r • • • .. . . ' ' . r. . " .'
....• ...n•• ...• ... ..n•n•
.... •••n••n•nvasnMAII(0n••
Direction of Flow
V
Figure 8 - Plan of gate C showing how the embankment users flow across the concourse.
In this high density crowd movement we observe the phenomenon of
self-organized, bidirectional, flow. Where two opposing flows self-organise into long
chains of people passing each other, like conga lines at a party, in opposite
directions.
Figure 10 - Zoom of Figure 9 showing the fingering patterns forming
Similar patterns are often seen in densely crowded areas. We shall examine
how and why they occurs and how they form in crowds in chapter 6.4.7.
2.5 The fluid analogy
After the event at gate C in 1992 an investigation was begun into the existing
literature relating to crowd movement and the legislation relating to crowd safety.
The literature was sparse, assumptions of average density and average flow were
used to indicate safety limits, for example, in the Building Research Establishment
document [29].
Crowds are often described in fluid terms, a "sea of people", "ebbing and
flowing like a tide" the language rich in fluid analogies. Egress routes and building
designed are based on the fluid flow assumption Flow volume = Average speed x
Average density. Also, the assumptions that crowds flow like a fluid implies that the
fastest flow is down the centre, as in Poiseuille flow [30]. Yet field observations
2.5.1 Why is the fluid analogy untenable?
Understanding crowd dynamics is essential for understanding crowd safety.
In 1992, at gate C, a small flow of people, coming up along the edge of the queue
via a grass embankment, had an effect on the operation of the turnstiles. This small
flow effectively blocked the forward motion of the crowd. No such phenomenon
occurs in fluids, so there have to be some fundamental differences between crowd
and fluid flows. The laws of crowd dynamics have to include the fact that people do
not follow the laws of physics, they have a choice in their direction, have no
conservation of momentum and can stop and start at will. They cannot be reduced to
equations which are appropriate for the movement of ball bearings through viscous
fluids [31].
2.5.2 Definition of crowd density
In the Guides crowd density is defined as the number of people in 10 square
metres. References to density appear in the Guides. The following problem of a
crowd filling an area was highlighted in the Taylor Report [32].
2.5.3 Crowds find their own levels.
It was assumed that people entering an area will distribute evenly across the
available space. The conjecture that a crowd finds its own level is based on a fluid
model of a crowd. This assumption implies that the crowd has complete awareness
and behaves in a sensible manner for the benefit and safety of all the individuals in
that crowd. It also assumes that individuals in the crowd are free to migrate across
station platform is filling to capacity; there is little room for the individual to
manoeuvre to lower density. In those environments people compete for space.
2.6 Two key questions
There are two key questions which arise from the assumptions of crowd
behaviour. Firstly, do crowds find their own levels as claimed? Secondly, as
previously reported statements indicate, do crowds flow like fluids?
As the initial interest in crowd dynamics occurred at Wembley Stadium,
permission was sought, and duly granted allowing the author unlimited access over
a two-year period (1994 and 1995). The management team headed by operations
director George Wise (now retired) allowed access to available historical video
footage, attendance of all the major events for the two year duration of the field
study, maps of the local area, plans of the stadium and access to observation points,
from which the public are normally excluded, for photographs and observations.
The stadium has a capacity of 82,000 and hosts football, rugby, concerts,
greyhound racing and wrestling. The approaches to the Wembley area are monitored
for a radius of 20 miles (via police cameras situated on motorways) where traffic
can be observed and the event can be delayed if necessary.
Although Wembley Stadium has no history of any crowd related disasters,
the staff are aware that complacency is the biggest threat to public safety.
2.7 Ingress safety at Wembley
Wembley Stadium (Figure 11) hosts a variety of events. Patrons arrive by a
sporting events, all of the supporters can arrive in a relatively short space of time
(30 - 90 minutes). 30,000 supporters can arrive in the hour prior to kick-off
Figure 11 - Aerial view of Wembley Stadium showing location of the gates.
To analyze the operating parameters of Wembley it is necessary to study the
records of the turnstile computer. These records are archived, ingress numbers are
printed and a copy is kept as an archive. The computer system also records the flow
rates during ingress but those data are available only during the event.
2.7.1 Wembley turnstile data
Every turnstile at Wembley Stadium has a counter which is tripped when a
person enters. The final count through each turnstile is recorded.
Some data (stored on floppy computer disk) were recovered from previous
system tests. These and the 1994 FA cup final, which was recorded and video taped.
Those data are used to illustrate the problems of late arrivals and the impact
of changing flow rates. The ingress distribution for the turnstiles for several football
events at gate C is shown in Table 1. The usage is not evenly distributed. Figure 12
Gate C
Turnstile Averages
1000
• BOO (..) BOO
no
%) 400 Cu" < 200
1 2 3 4 5 5 7
Turnstile
Gate C 14/04/91 18/05/91 30/03/93 31/03/93 , 14/05/94 11/04/96 , 09/04/9 Total Average 397.43
1 677 646 8 397 385 575 94 2782
2 612 794 96 605 586 672 166 3531 504.43
3 573
—
803 80 644 541 508 200 3349 478.43
4 736 915 237 643 810 678 327 4346 620.86
5 902 734 176 752 770 546 263 4143 591.86
6 1004 1157 77 843 875 655 409 5020 717.14
7 924 934 135 743 638 848 384 4606 658
8 1268 920 257 1074 962 979 591 6051 864.43
9 1090 1084 297 1021 699 797 648 5636 805.14
10 1292 1188 496 953 801 _ 800 _ 719 _ 6249 892.71
All 1 9078 1 9175 1 1859 1 7675 1 7067 1 7058
I
3801 1457131 6530.43Table 1 - Gate C Wembley Stadium ingress over several (football) events showing various event dates (horizontal axis) against turnstile counts (vertical)
It is clear from the histogram that the turnstiles are not being used evenly. In
fact turnstile number 10 has an average total ingress double that of turnstile 1.
The crowd approaches the turnstiles along the concourse (Figures 4 and 8)
and the nearest turnstile is 10. We examine this uneven usage in chapter 3.4 (Effects
of geometry) in more detail.
Figure 12 - Histogram of turnstile usage at gate C (averaged over several events)
2.7.2 Wembley ingress capacity
Wembley Stadium has 10 turnstile groups and 2 gallery entrances. The gates
entry numbers and flow rates shown on the main computer in the control room. The
Olympic gallery entrances are labelled E and H and have a manual ingress count.
Gates A, B, C, D, F, G, J, L have 10 turnstiles each, M has 8, K has 12 but 11
and 12 are not used. The stadium capacity is 82,000, with an ingress capacity of 660
per turnstile per hour, the total capacity is 660 x 98 = 64680 per hour or 1078 per
minute. It would therefore take 76 minutes to fill the stadium given an even
distribution of patrons to each turnstile. The gates are opened 2 hours prior to
kick-off for football matches. It is clear that ample time has been allowed for orderly,
safe ingress. The wide concourses and the stairs leading up to the turnstiles act as
passive crowd management aides, by design.
The records for four events are summarized in Figures 13 to 20. These show
two graphs (side by side for each event) of the entry counts per minute (left hand
graph) and the counts per minute (right hand graph). Both graph types have time
across the horizontal axis and start when the gates open. The slope of the right hand
graph gives an indication of the entry rates. The important feature to note is the
shape of the left hand graph (the initial peak is when the gates open and the initial
waiting crowd enters). The plateau shows the majority entering. The gap between
the peak and plateau indicates the differences in the walk-up (the name given to the
mass of fans arriving close to kick-off) and those patrons who arrive in good time
for the gates opening. Two other noteworthy features are the slope on the tail end of
Figures 13, 15 and 17 compared to the sharp drop for Figure 19. This indicates that
Figure 13 - Counts per minute
Figure 15 - Counts per minute
Figure 17 - Counts per minute
270 240 mln count 4r, 90 4,04 3734 3110 144211 1044 1044 i22 -242 2,14 120 /50 100 21C
Figure 14 - Entry count per minute
Figure 16 - Entry count per minute
XAOS 1044 1444 422
• • 44, 124 1411 1.10 210 ate
--Figure 18 - Entry count per minute
210 2/0 mln
Count SEPO 2,74 A254 37)2 2110 2422 lea. 1244 422
141 May 1994 FA Cup Final Max. 120 ppm Total Count
78,579 14th April
1991 FA Semi-Final Max. 140 ppm Total count
76,467
18th May 1991 FA Cup Final Max. 120 ppm
Total Count 79,079
31' March 1993 1 4 Division
Playoffs Max. 120 ppm
Total Count 72,455
Figure 19 - Counts per minute Figure 20 - Entry count per minute
It is worth noting that these graphs were obtained by taking a series of screen
grabs from the turnstile computer system. The process involved taking a copy of
data from the main computer (not automatically saved) after the event, and running
it on a different computer to obtain the graphs. It was not possible to extract this
data from the archived materials kept at Wembley Stadium in a single process. The
same system is still in operational use and the flow rates are not recorded or
2.7.3 G and J turnstiles
When the concourse area is empty, the perception is that the area has ample
space for crowd circulation.
..-
,..)-N. s'
...
...
Figure 21 - Plan of G, H and J (far left) turnstiles and concourse area (Wembley Stadium)
The main line railway station is to the left of Figure 21, the car parks are at
the top of the plan, and the tube station is to the right of the plan. The area in Figure
21 is the most congested area of the Wembley concourse. It measures some 23
metres in width. From a vantage location, circled in Figure 21, the scene in Figure
22 was found to be typical of a normal crowd ingress to the stadium.
The concourse area by G, H and J turnstiles is multidirectional with crowd
flows from both left and right (car parks at either side, underground and main line
railways). There are toilets below the walkway (entrance to the Exhibition Hall),
and there are a number of concessions (hot dog stands, merchandising, etc.).
and J turnstiles are of concern due to the congestion on the concourse in the
[image:40.595.119.467.117.336.2]illustrated areas. The flow patterns and crowd dynamics in this area appear chaotic.
Figure 22 - The heads and faces show no clear sense of direction in this crowd.
Crowd sway, when a congested crowd moves from side to side, can lead to
problems. The edges of the crowd, in a confined space, can reaches high density and
supporters are in danger of being injured by being crushed against any solid walls.
As Figure 22 shows, the crowd is very tightly packed. It can be seen from the
way that the heads are facing that there is no clear sense of direction. There is a
potential for a sway to cause harm to those supporters closest to the walls. Should
there be a need to clear this area there is no identifiable egress route.
2.8 Wembley Complex Station.
The Fire Services College prepared a guideline for existing rail surface
stations [35, 36] which echoes the Guide recommendations of egress rates:
No. of Units of Exit Width Number of Persons (1)
%G. nn•
1111111•1111
....
Figure 23 - Enlarged plan of Wembley Complex Station platforms
... M . 45.111m
Where number of persons (1) means the maximum number of people that
could be expected to be on a platform at any time. Flow rate (2) means 40 persons
per minute for escape routes incorporating stairs, and 60 persons per minute for
level escape routes (without stairs). Passenger walking speeds should be assumed to
be 38 metres per minute for horizontal circulation. These figures are based on
research by John Fruin [6]. Table 2 indicates the square metres per person related to
this Level of Service category. We question these assumptions in chapter 3.2.
Fruin - Level of Service Category
Level of Service A B C D E F
Walkways >3.25 3.25 to 2.32 2.32 to 1.39 1.39 to 0.93 0.93 to 0.46 <0.46 Stairways >1.85 1.85 to 1.39 1.39 to 0.93 0.93 to 0.65 0.65 to 0.37 <0.37 Queuing Areas >1.21 1.21 to 0.93 0.93 to 0.65 0.65 to 0.28 0.28 to 0.19 <0.19
A = Free Flowing D = Restricted movement for most B = Minor Conflicts E = Restricted movement for all C = Some Restrictions to Speed F = Shuffling movements for all
Table 2 - Fruin Level of Service data
Evacuation time (3) is derived from the Green Guide, which takes into
account the maximum flow rate figures, the provision of fire safety measures, and
The maximum capacity of a train coach will not generally exceed 100
persons. The platforms are serviced via two bridges from Wembley Park Road (left
and right of Figure 23 and in background of Figure 24). The left-hand bridge (Figure
23) is a pavement/road whereas the bridge (Figure 24) is a footbridge only.
Figure 24 - Station platforms, as seen from Wembley Hill Road
South Way can be seen in Figure 25. It runs from the Wembley Hill Road to
the stadium. During egress on 28 th May 1994 South Way was full of supporters,
jubilant after their resounding victory; spirits were high and a party atmosphere
prevailed. Had they lost, the behaviour of this group would have been different.
Supporters who do not want to queue on South Way can walk round to the
other platform entrance, via Wembley Hill Road. The narrow pavement and lack of
crowd management measures, temporary barriers, or police monitoring, mean that
queuing supporters spill over the pavement and onto the busy road (Figure 26).
Figure 26 - View of unregulated queue spilling onto Wembley Hill Road
2.9 Why we need something different
From the initial observation of the unusual crowd movements at Wembley
Stadium several models of crowds were created. Initially built in a virtual reality
environment, these proved to be computationally limited due to the time it took to
calculate the collision detection of the virtual objects. This led to an extensive
literature search and discussions with the authorities from the local fire officers,
architects, design engineers, safety consultants, consulting engineers, the home
office, the fire research station, the building research establishment and the
construction directive.
dynamics, and directed the objectives of the research programme. This initial work
was followed by two seasons of crowd study, again at Wembley, in which the nature
of crowd safety began to direct the course of development.
The field studies proved the contradictions of the fluid analogy as we can see
from the photographs of Wembley Compex Station. On the platform (Figure 24)
there are sections of the platform (bottom right) that are empty, where the area in
the middle is more densely packed. Yet the the crowd outside the station appears to
follow the fluid analogy where the crowd is "finding its own level."
2.10 Analysis of the Hillsborough disaster (1989)
One of the worst disasters in British football history, where the crowd failed
to find its own level, occurred at Hillsborough Stadium on April 15 th 1989.
Hillsborough had hosted similar FA cup semi-final matches, without incident, many
times before. This included the same fixture between the same two teams the
previous year. The circumstances that led to 95 deaths and over 400 injuries
highlight the lack of understanding of the nature of crowd dynamics. They also
signified a turning point in the attitude of management to safety, for the first time
putting greater emphasis on human factors. The Archbishop of York said this at the
Hillsborough memorial service.
Events of the magnitude of Hillsborough don't usually happen just for one
single reason, nor is it usually possible to pin the blame on one single
scapegoat. Disasters happen because a whole series of mistakes,
SCALE
0 35 metres
I i
0 40 100 lee,
It is not difficult to reconstruct what happened at Hillsborough. 24,000
Liverpool fans approached Hillsborough from Leppings Lane. 10,000 of them would
make their way to the terraces (behind the goal) which were serviced by seven
turnstiles. The late arrival of the fans created a dangerous crowd build-up by the
perimeter gates. There was no single factor that led to those late arrivals and within
20 minutes the problems of crowd density, and hence crowd safety, became
unmanageable. Approximately 5,000 fans were in danger of physical harm around
the perimeter gates and turnstiles in Leppings Lane. In an attempt to relieve the
pressure at the turnstiles, the police opened the exit gates (gate C - Figure 27)
allowing 2,000 additional fans into the ground and towards pens 3 and 4 which were
already full.