Internal migration and inclusive
development: Insights from the field
Ray, Jhilam and Naaz, Farhat and Khasnobis, Poulomi and
Majumder, Rajarshi
Department of Economics, University of Burdwan
March 2019
Online at
https://mpra.ub.uni-muenchen.de/93318/
Internal Migration and Inclusive Development:
Insights from the Field
Jhilam Ray1, Farhat Naaz2, Poulomi Khasnobis3, Rajarshi Majumder4
_______________________________________________________________________
Background
People and size of population have remained an interesting area of enquiry and research in
social sciences since time immemorial – oscillating between considering people as a
favourable factor for economic growth and viewing them as a drag to the growth process. The
Mercantilist view, which dominated economic thought during 16th-18th centuries, considered
increase in population as a blessing. According to them higher population meant higher
number of soldiers and increase in the number of productive workers. On the other hand, the
Physiocrats were suspicious about the advantages of population growth and some of them
insisted that shortage of food was a possibility that ought to be taken into account by a nation
if population increased continuously. This debate was a subset of the wider debate between
looking at people from the Human Capital context and the Human Development context.
While the former treats people as active economic agents and inputs to the production
process, the latter looks at human being as the benefactor of the process of growth. Now,
population of any region can change through natural processes of birth and death, and through movements of population or migration. Over the last three hundred years or so, the natural process has stabilised across the globe. With advances in science and technology, preventive and curative medical facilities have improved tremendously, leading to convergence of death rates. Socioeconomic progress at the macro level and changes in micro-decision making at the household level have led to a fall in birth rates. As a result, migration has emerged as an important factor behind population changes – both temporary and permanent. It has also become a part of worldwide process of urbanisation and
industrialisation. It signals social and economic change, and can be regarded as a human
adjustment to economic, environmental and social situation.
What is the size of migrant population in the globe and in India? It is reported that more than
a billion people in the globe are migrants, and that too by a conservative methodology (UN
1
Corresponding & Principal Author, Associate Professor, Department of Economics, University of Burdwan, Burdwan, West Bengal – 713104; Email: [email protected]
2 & 3
Research Students, Department of Economics, University of Burdwan, Burdwan, West Bengal – 713104;
4
DESA, 2013). Thus one in every seven persons is away from their place of origin or usual
residence. Of these, more than three-fourth are internal migrants, i.e. they are footloose but
within their own country. The same institution estimates that close to 46 million people in
India are migrants – staying at places outside their home state.
However, these estimates depend on how we define migration in the first place. Defining
migration (especially internal migration) is a controversial issue. At one end of the spectrum,
migration is defined as movement of people over some distance (or at least from one “migration-defining area” to another) and from one “usual place of residence” to another. At the other end of the spectrum the definition of migration discards the requirements that
migration must involve a change of residence and a move across some distance (Kok, 1999).
Standing (1984) suggested that one should rather use a change in “activity space” as a
criterion to define migration. However, it is virtually impossible to determine whether there has been a change in “activity space” or not unless research or census questionnaire specifically makes provision for the appropriate information to be obtained. Shryock et al
(1976) defined migrants as those persons who are moving relative to labour market areas.
The most accepted and widely used approach to define migration is – a change in usual place
of residence and a move from one migration defining area to another. The estimate earlier
mentioned is based on the administrative unit of provinces/regions/states as a migration
defining area in the larger countries like China and India. Some of these are larger in area and
population than some mid-European countries. If smaller administrative units like districts
are used, then the number would jump significantly. Also, people are constantly on the move – migrating and then also coming back to their place of origin – and getting estimate of the stock is quite a difficult task. Considering these issues, India is said to have close to 450
million migrants – taking both intra-state and inter-state migrants together – implying that
one-third of India stays outside its place of birth/usual residence [Census of India, 2011;
NSSO, 2007-08]. This is more than the population of USA, and close to the population of
USA, UK and Germany combined. A large part of them move due to marraige, birth and
family movements, but more than a fifth, or about 90 million are temporary economic
migrants or footloose workers – a size higher than the entire population of Germany and three
times that of Canada. Thus the issue of migration in India is gigantic and necessitates
Review of Literature
To provide a background, Ravenstein (1885) was the foremost proponent who claimed that
migration is an economic decision. Neo-classical theorists took this forward and the basic
models (Lewis 1954; Ranis & Fei, 1961) portray how modern sector grows through capital
accumulation and movement of labour from traditional to modern sector in lure of higher
wages. Harris and Todaro (Todaro, 1969; Harris & Todaro, 1970) evolved this further to note
that migration occurs in response to expected income differentials to account for rural urban
migration even in presence of urban unemployment in less developed countries. However,
contrary to the neo-classical view, historical experience suggests that migration does not lead
to equalisation of wages across space and sector as several factors not only perpetuate the old
socio-economic differences between source and destination regions, but new differences are
created by the migration process itself, leading to systematic and recurring migration between
regions. This is especially true when people with low skill, without economic opportunities at
home, travel each year to regions where some work is available in particular seasons (e.g.
agricultural workers at harvesting season, brick kiln workers in dry season, etc. See
Majumder and Mukherjee, 2012 for a case study). Thus the process of migration, especially
within a particular developing country, seems to follow the trail suggested first by Lee (1966)
who fragmented the force behind migration into push and pull factors. Push factors like
poverty, political instability, unemployment etc pushes potential migrants to move out of a
region. On the other hand pull factors like vibrant economy, better job opportunities etc
attract migrants to move in. Migration decision is influenced by the factors that are
determined at an individual level, household level, community level and regional level and in
turn affects those factors. Net Migration to a region is thus determined by the relative strength
of both push and pull factors in that region. Thus, as long as such pull-s and push-es exist,
migration would continue. Piore (1979) contradicted this theory and said that migration is not
caused by push factors like low wages and high unemployment in the sending countries but
by the pull factors in the receiving country. [These and other issues that link migration with
development and poverty and the existing literature have been comprehensively discussed by
de Haan (2006, 2008)]. Empirical studies, in general, echo the Todaro-Lee-Piore concept that
migration is in response to gap between actual economic position in source region and
expected situation in destination region. These include Deshinkgar & Grimm (2005) and
Banga & Sahu (2010) who discuss internal migration and role of remittances in global
perspective across countries and continents. At the national level, studies by Rele (1969),
Mitra and Murayama (2008), Wouters (2008), Kundu (2009), Roy and Debnath (2011),
Taralekar et.al (2012), Naaz & Majumder (2016), Mahapatro (2012), Coffey et.al (2014),
Abbas and Verma (2014) all refer to uneven regional development, search for better jobs,
diversification of livelihood as main reasons for (male) migration in India. Area or sector
specific studies on migration in India include those by Mukherjee (2004), Sundari (2005),
Deshingkar and Akhter (2009), Rodgers & Rodgers (2011), Bora (2014) also confirm such a
notion. Naaz & Majumder (2017) takes a more nuanced approach and differentiates between
two different streams of migrants – one which include people with high levels of human
capital moving mostly from urban to urban centres and two, those with low human capital
moving in search of low end jobs mainly from rural to urban areas. This supported the views
of Kundu and Sarangi (2007) who pointed out that though both poor and rich households
migrate, poor households send few members out to create a diversified and external support
system for livelihood, while better off households mostly migrate en masse, relocating the
entire family for enjoying better amenities and status at urban metropole.
A large part of such migrants are females, moving after marriage, or family members moving
with rest of the household. The individuals in these cases have no say over the decision to
move, but they bear the consequent impacts – both positive and negative. At the same time,
the condition of the household and its members across dimensions of assets, physical &
human capital, gender & age composition etc. do exert influence on the household’s
decisions about whether to migrate, when to migrate and who would migrate. Similarly,
duration of migration also varies from a few months in a year to long term migrants who
migrated two generations back and have settled down in a new place. The reasons, impetus,
and also the socioeconomic import of long run migration would differ substantially from
short term migration. Surprisingly, while the literature on migration is voluminous, there has
not emerged much work that looks at both these type of migrants at a micro context –
focussing on the processes and results of short term and long term migration on households.
The present paper seeks to address this research gap by using case study from three districts
of the state of Bengal in eastern part of India.
Database & Methodology
Since independence, India has maintained a clear agenda towards potent fiscal federalism
aimed at balanced state-wise economic progress. Despite this effort, the issue of disparities in
regional economic output has persisted over many years (Mathur, 1983, 1987, 1992;
of infrastructure, economic conditions, employment opportunities and aggregate development
level. Thus there are considerable out-migration from relatively backward districts and
in-migration into relatively advanced districts. We have selected two backward districts of the
state of Bengal - Malda and Puruliya – which has a long history of repetitive, temporary
migration, to study the micro condition of such temporary out-migrants. As a contrast we
have selected a developed district of the same state – Bardhaman – which also has a long
history of attracting migrants from not only surrounding districts but neighbouring states as
well into its myriad mines and factories. Those here are mostly long-term migrants from the
backward districts of not only Bengal but also of Bihar and Jharkhand, and settled down with
their families in urban areas of west Bardhaman. Here, we selected the urban centre of
Asansol which is home to a large mass of long term settled migrants. Municipal wards from
Asansol (city) and villages from Malda and Puruliya district were selected through purposive
sampling to represent locations that had a mix of both migrants and natives/non-migrants.
After that Random Sampling was used to select households from the two strata – Migrants
and Non-migrants, in proportion to their share in population. In all we surveyed 245
households in Malda, 281 households in Puruliya, and 210 households in Bardhaman district.
Of these, 498 were migrant households.
Temporary Migration: Driving Factors
People migrate from the place where push factors outweigh the pull factors and move to a
place where pull factors outweigh the push factors. These factors may be of two kinds -
Economic and Non-Economic. Movement in search of employment or better income may be
termed Economic factors whereas marriage, education, family movement may be designated
as Non-Economic factors. At the macro-economic level, it has been observed that Male
migration in India is mostly economic whereas female migration is predominantly for
non-economic reasons (Naaz & Majumder, 2016). While rural male migrants are observed to be
better educated compared to the non-migrants, female migrants in both rural and urban areas
have less education compared to the non-migrant females (Naaz & Majumder, 2017). It is
also argued that rural-urban temporary migration is age and gender-selective and peaks for
the young adult males whose physical productivity is relatively higher than the rest (Esipova
et al, 2013; IOM, 2015). There is also a recurring argument that it is the poor asset-less rural
people who migrate in search of job (though this has been questioned in recent times by
researchers; see Kundu & Sarongi, 2007; Kundu, 2007). Another observation is that people
(Kothari, 2002; Gurung, 2012). It was also argued that temporary seasonal migrants from
rural areas are more likely to be single males rather than married (Singh, 1998). This has been
now challenged by recent data which supports the view that men migrate more after marriage
when the family responsibility rests upon them and that migration is a family strategy
(Gordon, 1981; de Haan, 1997).
We therefore try to examine whether our field data can throw some light on these issues and
bring out the correlates of the process of temporary migration from rural areas.
For that purpose we have used a Binary Logistic Regression Function where the Dependent
Variable is Whether an Individual is Temporary Migrant or Not (=1 if migrant, =0
otherwise). The causal variables identified for our study are Age, Gender, Education
represented by Completed years of formal schooling, Marital status, Social Class, Family
Size, and Land owned (in Kathas) as a proxy of asset. We also include Age squared and
Land-owned squared to account for non-linearity of impact of these two variables.
Given the above discussion, status (Yij) of the ith member of the jth household may be either
of the two – Temporary Migrant (Yij = 1); or, Non-migrant (Yij = 0). This status would
depend on the Household-specific characteristics (X) and individual-specific characteristics
(Z).
P[Yij = 1 | Xj, Zi]
i Z j X e
i Z j X e
j 1
; ………. (1)
Or the Log Odds Ratio would be given by:
LORij= α + βXj+ πZi ; ………. (2)
Where, X and Z are vectors of variables as mentioned earlier. Estimated coefficients β and π provide us the impact of explanatory variables on the Log-Odds Ratio of being a Temporary
Migrant vis-a-vis being a non-migrant. The impacts of changes in the explanatory variables
on the probability are obtained as marginal effects or eβ and eπ. To exclude child-migration
who migrate mostly with their family and are not decision-makers, we include only those
who are 14+ years of age in our study. Descriptives of the sample data are reproduced in
Table 1
Determinants of Migration – Sample Descriptives
Characteristics / Variables Pooled Malda Purulia
Mean Low High Mean Low High Mean Low High
% Migrant 20.1 23.0 17.2
Age (years) 35 15 90 30 15 85 36 15 90 Years of Schooling 4 0 21 6 0 21 4 0 15 Family Size 5 1 10 5 2 9 5 1 10 Land possessed (in kathas) 35 0 200 21 0 200 45 0 180
% Males 52.8 54.4 51.5
% Married 72.0 68.9 74.7
% Hindu ST 43.9 17.7 66.7
% Hindu SC 24.0 34.3 15.0
% Muslims 12.4 26.7 -
Number of Observations 1779 827 952
Source:Author’s calculation based on Field Survey (2017-18)
Table 2
Determinants of Migration – Logit Regression (14+ population)
Dependent Variable: Whether Temporary Migrant (or not)
Causal Variables
Pooled Malda Purulia
Beta Marginal
Impact Beta
Marginal
Impact Beta
Marginal Impact
Age (years) 0.053**
(0.07) 1.05
0.066
(0.14) 1.07
0.047
(0.25) 1.05 Age squared -0.01**
(0.02) 1.00
-0.001**
(0.04) 1.00
-0.001*
(0.13) 1.00 Years of Schooling 0.014
(0.31) 1.01
-0.009
(0.68) 0.99
0.022
(0.35) 1.02 Gender Dummy Males;
(control group: females)
3.045**
(0.01) 21.02
3.814**
(0.01) 45.35
2.500**
(0.01) 12.18 Marital Status Dummy (Married)
(control group: unmarried)
1.124**
(0.01) 3.08
1.329**
(0.01) 3.78
-0.130** (0.03) 0.88 Family Size -0.162**
(0.01) 0.85
-0.187**
(0.01) 0.83
1.023** (0.01) 2.78 Land possessed (in kathas) -0.008*
(0.12) 0.99
-0.002
(0.85) 0.99
-0.010*
(0.16) 0.99
Land possessed squared - - -0.001 (0.21) 0.97 0.001 (0.97) 1.00 Social Group Dummy (Hindu ST)
(control group: Hindu Gen)
0.218*
(0.20) 1.24 - -
0.592** (0.04) 1.81 Social Group Dummy (Hindu SC)
(control group: Hindu Gen)
-0.013
(0.91) 0.99
-0.185
(0.50) 0.83
0.183
(0.61) 1.20 Social Group Dummy (Muslim)
(control group: Hindu Gen)
0.169
(0.49) 1.18
0.154
(0.60) 1.28 - -
Nagelkerke R-squared 0.339 0.424 0.268
Log-likelihood ratio 1346 ** 620.2** 707.8**
Correct classification (%) 82.9 81.5 83.4
Number of Observations 1779 827 952
Source:Author’s calculation based on Field Survey (2017-18)
Note: * and ** denote significance at 20% and 10% levels respectively. Figures in parenthesis
Pooled Regression – All
From results shown in Table 2, we observe that Seasonal / Temporary Out-migration from
the two selected districts of Bengal are indeed age and gender specific. Probability of
migration increases with age initially but comes down eventually as shown by positive
coefficient of Age and negative coefficient of Age-squared. Males are twenty times more
likely to migrate than females. Marital status is also significant and we find evidence that
rather than single males, it is married males who migrate more. They are three times more
likely to migrate than unmarried males. Family size is an important determinant too, but
contrary to popular hypothesis, members of large families are less likely to migrate as shown
by the significantly negative coefficient. Migration is also driven by asset poverty as
probability of migration decreases as quantity of land possessed increases. Probability of
Migration is significantly higher for Hindu STs and Muslims compared to Hindu Others (or
Hindu Upper castes). Education as indicated by completed years of formal education seems
to increase probability of migration, though the impact is statistically insignificant.
These results are also brought out by Figures 1 & 2 which shows a hump in probability of
migration around age 25-45, a secular decline in migration probability as land size increases,
and the higher migration propensity of males.
Split regression – All
If we segregate across the two districts, the results provide interesting insights into the
heterogeneity of migration process. While the results remain almost identical for age, gender,
and land possessed; for the rest the two districts provide a contrasting picture. In Malda,
education seems to decrease the probability of migration. In Puruliya, being married
decreases the probability of migration and larger family size increases such probability. Also,
the social class effects are now more pronounced with STs in Puruliya and Muslims in Malda
showing remarkably higher propensity to migrate compared to the reference category. The
gender division is also more stark in Malda with males almost fifty times more likely to
migrate than females while in Puruliya males are twelve times more likely to migrate than
females. Thus in Puruliya it is the single educated male from larger tribal families who are
more prone to migrate compared to Malda where married males with less education from
smaller Muslim families that are more probable to migrate. This contrasting picture
underlines the diversity in the process of migration decision making as well as the profile of
Figure: 1
Model Based Predicted Probability of Migration across Age by Gender
Source:Author’s calculation based on Table 2 & Field Survey (2017-18)
Figure: 2
Model Based Predicted Probability of Migration across Land Possessed
Source:Author’s calculation based on Table 2 & Field Survey (2017-18)
Pooled Regression – Males
It is a reality that temporary/seasonal internal migration in India is dominated by males. Our
survey results discussed above also support this fact as males are significantly more likely to
migrate than females. Hence we decided to focus more on the male population and explore
whether results discussed above holds true when only males are considered. It is observed
from Table 3 that the impacts are almost similar. Age still has a positive but non-linear
impact on probability of migration. Married men are about four times more likely to migrate
STs and Muslims are more likely to migrate than the reference category of Hindu upper caste
men. The only difference now is that education now has a negative coefficient, indicating that
men with relatively less years of formal education are more probable to migrate.
Table 3
Determinants of Male Migration – Logit Regression (14+ Males)
Dependent Variable: Whether Temporary Migrant (or not)
Causal Variables
Pooled Malda Purulia
Beta Marginal
Impact Beta
Marginal
Impact Beta
Marginal Impact
Age (years) 0.039 (0.23) 1.04 0.065* (0.16) 1.07 0.001 (0.99) 1.00
Age squared -0.001**
(0.04) 1.00
-0.001**
(0.05) 1.00
0.001
(0.48) 1.00 Years of Schooling -0.003
(0.88) 0.99
-0.008
(0.73) 0.99
-0.013
(0.63) 0.99 Marital Status Dummy (Married)
(control group: unmarried)
1.350**
(0.01) 3.86
1.401**
(0.01) 4.06
1.412**
(0.01) 4.11
Family Size -0.185** (0.01) 0.83 -0.198** (0.01) 0.82 -0.156** (0.02) 0.86
Land possessed (in kathas) -0.007*
(0.17) 0.99
-0.002
(0.80) 0.99
-0.006
(0.45) 0.99 Land possessed squared 0.001
(0.60) 1.00
0.001
(0.21) 1.00
0.000
(0.80) 1.00 Social Group Dummy (Hindu ST)
(control group: Hindu Gen)
0.101
(0.63) 1.11 - -
0.348
(0.26) 1.42 Social Group Dummy (Hindu SC)
(control group: Hindu Gen)
-0.029
(0.90) 0.97
-0.084
(0.77) 0.92
-0.179
(0.65) 0.84 Social Group Dummy (Muslim)
(control group: Hindu Gen)
0.024
(0.93) 1.02
0.314
(0.31) 1.35 - -
Nagelkerke R-squared 0.166 0.200 0.142
Log-likelihood ratio 1091.2* 534.3* 541.9*
Correct classification (%) 70.1 68.9 72.7
Number of Observations 940 450 490
Source:Author’s calculation based on Field Survey (2017-18)
Note: * and ** denote significance at 20% and 10% levels respectively. Figures in parenthesis are p-values
Split Regression – Males
When we segregate across districts, we find that there are some subtle differences. The
age-selection process is more pronounced in Malda than in Puruliya. Also, as before, the age-selection
across social classes follows the demographic pattern of the two districts – STs in Puruliya
and Muslims in Malda are more prone to migration.
Summary
It therefore emerges from our survey results that temporary seasonal migration is mostly a
distress phenomenon. People without adequate (farm) land in rural areas, mostly married
males, with little formal education and belonging to the socially disadvantaged groups (STs
and Muslims) are more likely to migrate. We can calculate predicted probability of the
average person as also several counterfactuals for the pooled data as well as the district level
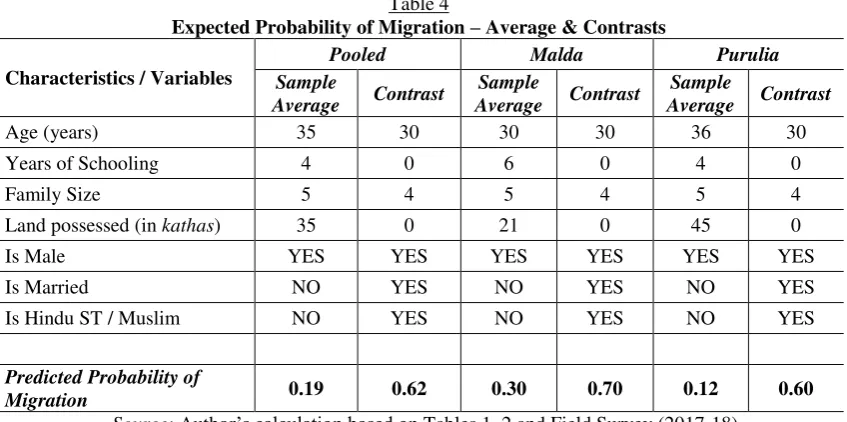
Table 4
Expected Probability of Migration – Average & Contrasts
Characteristics / Variables
Pooled Malda Purulia
Sample
Average Contrast
Sample
Average Contrast
Sample
Average Contrast
Age (years) 35 30 30 30 36 30 Years of Schooling 4 0 6 0 4 0
Family Size 5 4 5 4 5 4
Land possessed (in kathas) 35 0 21 0 45 0 Is Male YES YES YES YES YES YES Is Married NO YES NO YES NO YES Is Hindu ST / Muslim NO YES NO YES NO YES
Predicted Probability of
Migration 0.19 0.62 0.30 0.70 0.12 0.60
Source: Author’s calculation based on Tables 1, 2 and Field Survey (2017-18)
The average unmarried male from Hindu upper caste household is 35 years of age, has just 4
years of formal schooling and comes from a household of 5 members with 35 kathas of land.
For this person, predicted probability of migration is just 19 per cent. As a contrast, if we
consider the median person who is married, 30 years of age, from a ST or Muslim landless
family of 4 persons, without any formal schooling, the predicted probability multiplies three
times to become 62 per cent.
Looking at the district level data separately, the average person in Malda is younger, with
more formal schooling and less amount of land under possession. For this person the
predicted probability of migration stands at around 30 per cent. Predicted probability of
migration for the contrasting person in this district with characteristic variables as mentioned
before is more than double at 70 per cent.
For Puruliya, the average person is older, of 36 years of age, with just 4 years of formal
schooling, comes from a household of 5 persons with 45 kathas of land in possession. The
average person has substantially lower predicted probability of migration (than Malda) – just
about 12 per cent. The contrasting person in this case is five times more likely to migrate than
the average person, with predicted probability of migration at 60 per cent.
Our results therefore support the opinion that migration decisions depend on individual as
well as household factors, especially in developing countries, where temporary and seasonal
migration is a strategy to diversify sources of income and improve total income through
2012]. Whether such a strategy bears fruit at the ground level is a matter of enquiry which we
attempt in the next section.
Impact of Migration on Participating Households
We have already inferred that temporary migration is a risk-minimising poverty-mitigating
strategy of rural households from disadvantaged social background. But does migration act as
an inclusive process where the migrant families improve their economic condition? There are
several such questions that beg answer. What is the educational, employment and
occupational condition of the migrant households? Do migrant households enjoy better
income/consumption levels compared to non-migrants? Are their activity and occupational
structure better? Do they have better housing, amenities, and enjoy financial inclusion? These
issues have been explored in this section.
As mentioned earlier, we compare households that send members as temporary/seasonal
migrants and those that do not send out migrants. Also, to examine whether there is a
difference between long term permanent/semi-permanent migration and seasonal migration in
terms of socioeconomic outcome of migration, we use a control group of settled migrants
from Bardhaman district of Bengal. The results are discussed below.
Table: 5
Human Capital Position – Education of the 18+ Sample Household Members
Education Distribution
Status Illiterate Below Primary
Primary passed
Middle passed
School
passed Graduate+
Puruliya Temp Migrants 41.6 20.8 11.6 12.3 12.0 1.6
Non-migrants 41.8 18.0 13.5 12.0 12.7 1.9
Maldah Temp Migrants 23.7 22.2 19.6 15.6 16.4 2.5
Non-migrants 27.0 18.3 12.4 16.6 18.7 7.1
Bardhaman Settled Migrants 7.5 20.7 12.8 33.1 9.9 16.0
Non-migrants 9.7 15.8 14.7 40.5 7.3 12.0
Source:Author’s calculation based on Field Survey (2017-18)
Human Capital Position
We have looked at the human capital position of the 18+ population of our sample. We
compare between Seasonal Migrants (from Puruliya and Malda districts), Settled Migrants (in
Bardhaman district) and Non-migrants. It is observed that human capital situation in both
Puruliya and Malda districts are inadequate with Temporary Migrant households having
relatively poorer human capital situation than the Non-migrant households of the same
district (Table 5). They have more illiterates and below primary school educated persons and
lesser share of graduates and high school pass-outs. The settled migrants in Bardhaman on
indicating that after settling down they have been able to improve their educational
attainment substantially.
Participation in Labour Market
Since temporary migration is a strategy to get meaningful employment and raise income
level, it is no surprise that LFPR and WPR are higher among temporary migrants in both
Malda and Puruliya compared to the non-migrant households (Table 6). However, settled
migrants in Bardhaman have a lower LFPR and WPR not only from the temporary migrants
of these two districts but also from the natives. Migrant households in Puruliya had the
highest LFPR and WPR – perhaps reflecting the overall economic stagnancy of the region.
Unemployment is highest among non-migrants in Puruliya and lowest among migrants in
Malda, which is expected as the raison-d’être of migration is getting jobs.
Table: 6 Labour Market Statistics
District Status
Too Young / Too Old
School going
Domestic duties
Out of Labour
force
LFPR Unem
ployed WPR
Puruliya Temp Migrants 3.4 21.6 14.1 39.1 60.9 4.2 56.7
Non-migrants 2.6 23.3 22.1 48.0 52.0 8.2 43.8
Maldah Temp Migrants 3.3 36.0 15.9 55.2 44.8 2.9 41.9
Non-migrants 13.6 35.8 13.1 62.5 37.5 4.0 33.5
Bardhaman Settled Migrants 13.6 24.9 18.9 57.4 42.6 3.9 38.7
Non-migrants 12.4 27.0 22.2 63.6 36.4 3.9 34.5
Source:Author’s calculation based on Field Survey (2017-18)
Table: 7
Proportion of Workers in Different Types of Employment / Activity Status
District Status Self
Employment
Casual Employment
Regular / Salaried Employment
Puruliya Temp Migrants 0.5 98.8 0.7
Non-migrants 3.0 85.8 11.2
Maldah Temp Migrants 0.2 99.5 0.2
Non-migrants 3.0 92.2 4.8
Bardhaman Settled Migrants 35.4 35.9 28.7
Non-migrants 22.0 40.0 38.0
Source:Author’s calculation based on Field Survey (2017-18)
Work Activity Status
It is true that the poor can ill-afford to remain unemployed. Hence LFPR & WPR are
generally perverse indicators of economic vibrancy of a region/group and it is better to look
at the type of work/activity to understand the real condition of the workers. We have
segregated workers into three broad types. In order of hierarchy and economic benefits, they
are Regular Salaried Employment, Casual Employment, and Self-employment. It is observed
that almost the entire employment among Temporary migrants comes from Casual Work,
of non-migrants in Malda and Puruliya are in Regular Salaried job. In contrast, settled
migrants in Bardhaman have a more equitable spread over the three types of employment,
though here too casual work is marginally dominating. The highest share of regular/salaried
job is found among non-migrants in Bardhaman district, indicating that this group is perhaps
in the best economic condition.
Occupational Distribution
Another major indicator of labour market conditions is the occupational distribution of
workers. It is observed that seasonal migrants are predominantly into Construction work and
Unspecified manual work in both Puruliya and Malda (Table 8). The non-migrants in these
two districts, as expected, are mostly in the farming occupation as cultivators and agricultural
labourers. Presence of migrant workers in clerical and managerial jobs is negligible. This
indicates that the migrants are mostly engaged in lower rung of occupations. The settled
migrants in Bardhaman, in contrast, are more in Sales and Clerical & Managerial jobs –
occupation that are less exerting and more paying.
Table: 8
Occupational Distribution of Workers
Activity
Puruliya Malda Bardhaman
Migrant
Non-migrant All Migrant
Non-migrant ALL Migrant
Non-migrant ALL
Cultivator 21.5 38.1 26.8 45.6 35.9 41.3 1.0 0.1 1.0
Agricultural
Labourer 12.3 13.8 12.8 6.6 10.2 7.4 0.5 0.2 0.3
Industrial Labourer 7.4 7.4 7.4 2.3 1.7 2.2 9.2 6.0 8.0
Construction
Labourer 2.0 4.2 2.7 31.4 20.0 31.1 1.3 1.6 1.4
Unspecified Manual
Labourer 49.3 11.6 25.0 0.1 0.0 0.0 27.0 45.0 31.6
Handicrafts 2.5 1.1 2.0 2.3 3.4 2.5 16.0 7.0 14.0
Clerical &
Managerial 0.3 4.2 1.7 0.0 1.7 0.4 15.0 12.0 15.0
Sales & Others 4.7 19.6 21.6 11.7 27.1 15.1 30.0 28.1 28.7
Source:Author’s calculation based on Field Survey (2017-18)
Table: 9
Conditions of Housing and Amenities
District Status Pucca
Houses
Pucca Toilet
Safe Drinking Water
Clean
Cooking Fuel Electricity
Puruliya Temp Migrants 22.7 6.8 84.6 9.9 73.0
Non-migrants 12.7 10.2 85.6 21.2 57.6
Maldah Temp Migrants 41.2 20.9 73.3 28.9 73.3
Non-migrants 62.1 29.3 81.0 29.3 77.6
Bardhaman Settled Migrants 58.3 77.0 93.1 90.5 100.0
Non-migrants 65.4 62.1 89.7 90.3 96.6
Housing & Amenities
The living condition is best reflected in the condition of housing/dwelling and amenities
therein. It is observed that in Malda, migrant households have relatively poor housing
condition compared to the non-migrants (Table 9). In Puruliya, migrant households have
better houses and electricity but not sanitation or clean cooking fuel. In Bardhaman however,
the settled migrants enjoy better housing conditions, though they have relatively less share of
pucca houses.
Consumption, Poverty & Inequality
In India, economic condition and living standard of people are usually measured by their
consumption levels. Though fraught with measurement errors, recall bias and myriad other
methodological issues, MPCE (Monthly Per-capita Consumption Expenditure) is still
considered as benchmark in determining the economic status of a household. We have
attempted at collecting information on consumption expenses and constructed the MPCE
figures. It is observed that average MPCE of surveyed households is lowest in Puruliya and
highest in Bardhaman – in line with the general economic condition of the three districts as
exhibited by secondary data too (Table 10).1 If we compare across migrants and
non-migrants, we find that the seasonal migrant households in Malda and Puruliya have
marginally lower average MPCE than the non-migrant families. Since in the earlier section
we noted that the migrants mostly come from asset-less poor families, the results here
indicate that migration did help them to come up to an economic level closer to the
non-migrants. In Bardhaman however, the settled migrants have average MPCE that is marginally
higher than the natives, indicating that permanent migration is more effective as a coping
strategy than temporary migration.
Table: 10
Household Consumption Expenditure (` per capita per month at current prices 2016-17)
District Status
Mean MPCE Median MPCE
% below State Poverty Line
Puruliya Temp Migrants 791 570 44.5
Non-migrants 813 825 74.5
Maldah Temp Migrants 1527 1218 35.2
Non-migrants 1559 1272 35.5
Bardhaman Settled Migrants 2580 2030 23.2
Non-migrants 2521 1742 26.0
Source:Author’s calculation based on Field Survey (2017-18)
We also tried to measure incidence of Head Count Poverty across districts and family types
on the basis of computed MPCE levels. For this we have used the State-specific poverty line
1
provided by NITI Ayog/Planning Commission for West Bengal (GoI, 2014). For the year
2011-12, this was ` 783 for rural areas and ` 981 for urban areas. We updated this to 2016-17
figures using the CPIAL for rural areas and CPIIW for urban areas. It is observed that, as
expected, HCR is highest among the surveyed households in Puruliya, followed by Malda,
and least in Bardhaman (Table 10). What is more interesting is that while incidence of
consumption poverty is almost similar across migrant and non-migrant families in Malda, in
Puruliya households with migrant members have remarkably lower incidence of consumption
poverty compared with non-migrant families. In Bardhaman too, settled migrants show lower
HCR compared to the natives. Thus, in Puruliya, migration as a poverty alleviation strategy
of the households is remarkably successful. This is also true, but with a lesser degree, for the
migrant families settling in Bardhaman.
We have also tried to examine the relative inequality in consumption levels across
households. For this we have pooled the sample households together and divided them into 5
quintiles based on their MPCE levels, separately for each of the three districts. Q5 is the
highest MPCE bracket and Q1 is the lowest one. Thereafter we have examined what
proportion of each household-type in each district are in the 5 quintile groups. It is observed
that the migrant households are more equally spread across the 5 quintile groups while the
non-migrant households are more polarised near the two ends (Table 11). Thus inequality
seems to be lower within migrant households compared to within non-migrant households in
all the three districts. This is clearer when we look at Figure 3 which shows that the
distribution across MPCE classes are uni-polar for the migrant households and bi-polar for
the non-migrant households.
Table: 11
Distribution of persons across MPCE Quintiles for Migrants and Non-migrants
Status Q1 Q2 Q3 Q4 Q5
Puruliya Migrants 14.1 28.9 22.5 17.5 16.9
Non-migrants 28.7 9.9 19.9 23.3 18.2
Maldah
Migrants 22.3 19.4 23.3 18.9 16.1
Non-migrants 21.6 23.6 13.2 22.8 18.8
Bardhaman Migrants 20.0 19.0 21.0 21.0 18.0
Non-migrants 16.0 20.0 12.0 15.0 37.0
Source:Author’s calculation based on Field Survey (2017-18)
It therefore appears that migration indeed acts as a way out of poverty for rural households.
They have improved consumption levels, lower incidence of Headcount poverty and lower
within group inequality. In this, migration seems to be working as an inclusive process, with
Figure: 3
MPCE Distribution across Quintiles for Migrants and Non-migrants
Puruliya Malda Bardhaman
Distribution for Migrants: Distribution for Non-Migrants:
Source:Author’s calculation based on Field Survey (2017-18)
Financial Inclusion
Another way to look at the impact of migration is to examine the aspect of financial
inclusion. In recent years there has been an emphasis in policy as well as implementation
level towards financial inclusion – make banking and institutional credit services accessible
to all. What is the situation among the surveyed households in this dimension was explored.
It appears that making people come to the bank and have bank account has been successful in
Bardhaman and Puruliya where most of the households have bank accounts (Table 12).
However, this has not been that much successful in Malda. Also, Bank accounts are more
frequent among migrant households than non-migrants in the two districts mentioned –
perhaps because of the remittance factor as sending and receiving money is facilitated when
the family has bank account. In Malda, fewer migrant households have bank accounts
compared to non-migrants – perhaps because the monetary transactions there are more
through personal channel rather than institutional.
Table: 12
Penetration of Financial Instruments
Puruliya Malda Bardhaman
Activity Migrant
Non-migrant All Migrant
Non-migrant ALL Migrant
Non-migrant ALL % with Bank
Account 82.2 78.0 80.4 9.6 13.8 10.6 94.6 91.7 93.7
% indebted 45.4 34.7 40.9 41.2 48.3 42.9 22.5 25.0 23.3
% loan from
Institutions 4.3 2.5 3.6 10.7 10.3 10.6 19.4 13.3 17.6
Source:Author’s calculation based on Field Survey (2017-18)
Indebtedness is also higher in Malda compared to Puruliya and Bardhaman. Indebtedness is
higher among non-migrants in these two districts while in Malda, indebtedness is more
frequent among migrant households. What is alarming is the fact that only a fraction of such
loans are from institutional sources, especially in Puruliya where it is almost negligible. 0
10 20 30
0 1 2 3 4 5 6
0 10 20 30
0 1 2 3 4 5 6
0 10 20 30 40
However, the brighter side is that institutional credit is marginally more frequent among
migrant households than non-migrants in all the three districts.
Summary
It therefore emerges from our study that success of migration as a coping and poverty
alleviation strategy is somewhat mixed. While they do seem to enjoy higher consumption
levels, lower poverty and within-group inequality, the nature of employment and earning is
questionable. Most of them are in unskilled manual jobs outside the state and the jobs are
casual in nature. Housing and amenities are not remarkably better and indebtedness is high,
especially in Malda. Also, the situation of the settled migrants are somewhat better than the
seasonal/temporary migrants. This brings us to the final section on the process of migration
and associated threats and pitfalls.
Migration Process and the Human Angle
What we have discussed so far are revealing the macroeconomic processes no doubt but at
the same time it misses one important aspect – the story of the human beings in flesh and
blood, people with hunger and poverty no doubt, but also people with emotions, passions,
families, culture and attachments. In this section let us tell the tale of human beings –
migrants as we know them – interspersed with some hard facts to bring out the nuances of the
micro-process of migration and the associated pitfalls and risks.
The migrant workers move in search of a better income and livelihood but pay a high cost to
do so. There are increasing instances of social-politics of identity being aroused across the
country and migrant workers are treated as aliens and root of all problems in overcrowded
cities; cities that do not spare a single square-foot of space for dignified living of the immigrant but is unsparing in criticising the workers’ shanties as an eye sore and ghettos; cities where the mob descends on anyone not conforming to the local concept of
righteousness.1 Lacking proper documentation and faced with political exclusion (migrants
are not registered voters in their destination region and in their source areas they are
absentees during election), they are a non-existent constituency and lack a lobbying voice to
ensure their basic rights.2 They are also soft targets of local and organised crime and very
often fall victim to human trafficking. These are the threats faced by temporary migrants of
1
Lynching and mob fury against migrant workers are common; see The Deccan Chronicle, Jan 17, 2018.
2
India on a regular basis. In addition, the process of migration itself gives rise to further risks
and heartbreaks.
Table 13
Channels of Migration – Percentage Shares
Channel Puruliya Maldah Bardhaman
Family /Relatives 23.8 41.9 60.9
Friends 36.2 - 18.2
Middlemen/Labour
Contractors 40.0 58.1 20.9
100 100 100
Source:Author’s calculation based on Field Survey (2017-18)
Most of the process of migration is based on social networks – of family relatives, friends or
the neighbourhood uncle who also doubles as labour contractor or middlemen/agent. Our
survey results also come up with the same pattern – seasonal or temporary migration is
facilitated mostly by labour contractors (especially in Malda) while long term settled
migration is facilitated more by family members or relatives (Table 13). The dominating
pattern of out-migration through labour contractors is through an age-old process known as
Dadon. Originally it used to mean loan taken from local money lender (who most often was
also the local Zamindar) as advance payment for the purpose of agricultural activities before
the agricultural season. The repayment was through unpaid labour at the farm of the
zamindar. With land settlement during colonial rule the process had withered. That
pre-colonial practice has returned (or may have remained dormant all this time), and now the
local labour-contractor provides loan to poor rural households at the start of the agricultural
season. The debtors repay the amount by going away to mostly construction sites during the
lean agricultural season and working there – their wages chalking up the repayment back
home. They end up at faraway places – some 1500-2000 kilometres away from home,
changing trains at least twice, travelling by the general class coaches of Indian Railways.
They are mostly ill-educated, asset-less, with no vocational or skill training. They are like
Qurban, whose story we learned at Halna village of Malda.1
In Qurban’s village, Rintu is the main contractor and out of 700 households in the village, at
least 300 are in his payroll, working outside the state. Qurban had taken a loan of ` 60,000
for his ailing father from the local labour contractor. This would be repaid by working 300
days at a construction site near Hitec city, Hyderabad. On a cold January Sunday, when the
1
district was freezing, the contractors men collected 30 such men and put them on train. All of
them had taken advances from Rintu. The running wage receivable by the workers for
construction work in Telangana, Karnataka, and Kerala is ` 200 per day for a 10-12 hour job.
There are no leaves or other allowances. The labour contractor arranges for food and
accommodation, and deducts ` 45 each day for that. All medical expenses are deducted from
wages receivable. Incidentally, the actual wages in these states at construction sites is not less
than ` 450 per day, leaving a handsome profit for the contractor. You can call it exploitation
if you like but that does not change the ground reality. Men like Qurban spend on an average
8-10 months on site, returning home for 2-3 months in a year. Once work gets over at a given
site, the contractor shifts them to a new site in a new state perhaps. They earn about ` 60,000
for this or ` 5000 per month when averaged over the year. This amount is an attractive one
when compared to Malda’s current per capita DDP of ` 4245 per month and average MPCE
of ` 1550 for our sample households in the district. Thus there is no lack of able-bodied
males willing to go out and Rintu always has a que outside his shanty office in the local
haat-tola. The lure of this road out of squalor and poverty is so strong that peculiar transformations
are taking place at the country-side, unknown and un-recorded by the intelligentsia like us.
Average years of education among boys is coming down as school drop-out is going up in
lure of assured money income from such migratory work. With a stagnant local economy,
there is no incentive to continue general education and wait for local earning opportunities to
materialise. However, frequency and duration of girls going to formal schools is improving as
family income reaches stability through such assured income. On another front, there are now
increasing incidents of alcoholism, substance-abuse and spread of infectious diseases like
HIV as trans-state movement have increased and more & more unsupervised adolescents are
going out to work. Absence of male member in the household for a major part of the year
creates insecurity among the women and infirm who stay back – there are increasing
instances of land-grabbing, diversion of rightful benefits and a general rise of the henchmen.
But Qurban was unmindful of all such dangers. He was dreaming of his daughter’s marriage.
And then all dreams come to an end, often with a loud crash. The building on which he was
working collapsed due to poor material being used and Qurban was one of the two workers
who died under the rubble.1 After much bargaining the construction company agreed to pay `
2 lakh as compensation. By that time, Qurban’s father had expired and his wife did not have
a bank account in her name. A facilitator took ` 20 thousand for arranging things and his
1
dead-body finally arrived in his village after 10 days in an ambulance for the last rites. And
he is not alone in such tales of broken dreams. One of his friends was even less fortunate. He
died in a road mishap in Raipur. Since the death took place outside working hours and
off-site, the company did not spare even a rupee. Cost of bringing the body home was ` 70
thousand, which conventionally the labour contractor pays. The family agreed to perform the
last rites in Raipur and Rintu paid for the travel. He handed over ` 60k saved this way to the
family who clutched at it as a last straw to tide over the next few months of hunger staring at
the face. Last heard, Qurban’s 15 year old son left school and joined the growing river of
migrant workers moving across the country. Such is the life of a temporary migrant in India!
Not a conclusion by any name
We have nothing further to add – no grandstanding policy suggestion or cleverly thought
impromptu out-of-the-box solutions to such problems of human tragedy. Our only submission
to the readers would be to recognise these problems, to pay adequate attention to these issues,
to debate and discuss at all levels so that the complexities and human stories behind a country
on the move are brought on the table. It is too mammoth an issue and affects too many human
lives to shove it under the carpet, especially when it is migrant workers who lose their lives in
carpet factories!1
______________________________
[Acknowledgement: Parts of this study separately funded by ICSSR and UGC-SAP. This also forms part of PhD thesis of the second author. Comments received during a National Seminar organised by Department of Economics, Banaras Hindu University during March, 2018 have been most helpful.]
References
Antman, F. (2012), “Elderly care and intrafamily resource allocation when children migrate”, Journal
of Human Resources 47(2), 331–63.
Census of India (2001), Migration Tables, Office of the Registrar General & Census Commissioner, India, Ministry of Home Affairs, Government of India
Census of India (2011), Migration tables, Office of the Registrar General & Census Commissioner, India, Ministry of Home Affairs, Government of India
De Haan (1997), “A. Rural-urban migration and poverty: the case of India. IDS Bulletin 1997;Vol. 28(2): pp35-47.
Esipova, N., Pugliese, A. and Ray, J. (2013) “The Demographics of Global Internal Migration”,
Migration Policy Practice, Vol. 3 (2), p3-6, [Available from http://publications.iom.int /system/files/pdf/migrationpolicypracticejournal10_15may2013.pdf, accessed on 20-02-2019]
GoI (2014) State Specific Poverty Lines for 2011-12 [available from
https://community.data.gov.in/state-specific-poverty-lines-for-2011-12/ accessed on 16-08-2018]
1“9 from Malda among 11 dead in…….”, The Times of India, Kolkata, 24
Gordon E. (1981) An analysis of the impact of labour migration on the lives of women in Lesotho.
Journal of Development Studies 1981;17(3):59–76
GoWB (2015) State Domestic Product and District Domestic Product of West Bengal 2014-15, Bureau of Applied Economics and Statistics, Government of West Bengal
Gurung, Yogendra Bahadur (2012) "Migration from rural Nepal: A Social Exclusion Framework, "Himalaya, the Journal of the Association for Nepal and Himalayan Studies: Vol. 31:
No. 1, Article 12. [available from
http://digitalcommons.macalester.edu/himalaya/vol31/iss1/12 accessed on 24-02-2019]
IOM (2015), “World Migration Report 2015: Migrants and Cities: New Partnerships to Manage Mobility”, International Organisation for Migration, [available from
http://publications.iom.int/system/files/wmr2015_en.pdf accessed on 12-02-2019]
Kok, Pieter (1999); The definition of migration and it’s implication: Making sense of recent south
African census and survey data, available from https://www.commerce.uct.ac.za/
Organisations/Demography/SA_Journal_of_Demography/SAJD/Volume%207/SAJDe m_1999_7_1_Kok.pdf, accessed on 18.05.17]
Kothari, Uma, (2002), “Migration and Chronic Poverty, Chronic Poverty Research Centre”, Working Paper No 16, Institute for Development Policy and Management (Manchester: University of Manchester).
Kundu, A. (2007), Migration and Urbanisation in India in the Context of Poverty Alleviation, Conference Paper - International Conference and Workshop on Policy Perspectives on
Growth, Economic Structures and Poverty Reduction, [available from
http://networkideas.org/ideasact/jun07/Beijing_Conference_07/Amitabh_Kundu.pdf, accessed on 12-02-2018]
Kundu, A. and N. Sarangi (2007), “Migration, Employment Status and Poverty: An Analysis across
Urban Centres”, Economic and Political Weekly, Jan 27, 2007
Majumder, R; Mukherjee, Dipa (2012); Paternal Migration Child Labour and Education: A Study in Brickfield areas of West Bengal
Majumder, Rajarshi (2005) - India's Development Experience - A Regional Analysis, in S.K. Thorat,
Vinoj Abraham and Jaya Prakash Pradhan (eds.) Industrialization, Economic Reforms and Regional Development: Essays in Honour of Professor Ashok Mathur, Shipra Publications, New Delhi, 2005
Mathur, Ashok (1987), “Why Growth Rates Differ within India-An Alternative Approach”,
Journal of Development Studies, Vol. 23(2)
Mathur, Ashok (1992), “Regional Economic Change and Development Policy in India”, Indian
Journal of Applied Economics, Vol. 1(2)
Mathur, Ashok. (1983). Regional Development and Income Disparities in India: A Sectoral Analysis.
Economic Development and Cultural Change. Vol. 31(3). pp475-505.
Naaz, Farhat and Majumder, Rajarshi (2015); “Internal Migration in India: Trend, Causes and Determinants”, Rabindra Bharati University Journal of Economics, Vol. IX, pp30-62
Naaz, Farhat and R Majumder (2016) “Workers on the move: Migrated labour in India in early 21st
century,” The Indian Journal of Labour Economics, Vol. 59(3), p419-40, 2016, Springer, [DOI: https://doi.org/10.1007/s41027-017-0065-4]
NSSO (2008), National Sample Survey Organisation 2007-08 data, Ministry of Statistics and Programme Implementation, Government of India.
Ranis, G. & Fei, J.C.H. (1961), “A Theory of Economic Development; The American Economic
Review, 51(4), 533-565.
Ravenstein, E.G.(1885), “The Laws of Migration”; Journal of the Statistical Society of London, 48(2),
167-235.
Rele (1969), “Trends and Significance of Internal Migration in India”, Accessed from
http://www.jstor.org/discover/10.2307/25051701?uid=3737496&uid=2&uid=4&sid=21 103505391263 on 14.02.2014.
Rodgers, Gerry and Rodgers, Janine (2011), “Inclusive Development? Migration, Governance, and
Social Change in rural Bihar”, Economic & Political Weekly; June 4, 2011, [Accessed
Roy, Niranjan and Debnath, Avijit (2011),“Impact of Migration on Economic Development: A Study
of some selected State “,Paper presented at International Conference on Social Science
and Humanity 2011 held at Singapore, [Accessed from
http://www.ipedr.com/vol5/no1/42-H00092.pdf , on 18.08 2013]
Shryock, H. S. Jr., Siegel, J. S., and Stockwell, E. G.: 1976, The Methods and Materials of Demography (Academic Press, New York).
Singh, J. (1986). Marital Status Differentials in Rural to City Migration in India. Genus, 42(3/4), pp89-106. [available from http://www.jstor.org/stable/29788869, accessed on 12-05-2018]
Srivastava, Ravi (2005), “Internal Migration Links with Poverty and Development”, The paper was
presented at the Regional Conference on Migration and Development in Asia, Lanzhou, China, 14-15 March 2005.
Srivastava, Ravi and Sasikumar, S (2003), “An Overview Of migration in India, it’s impacts and key
“, The paper was presented at the Regional Conference on Migration, Development and
Pro- Poor Policy Choices in Asia 2003 held at Dhaka, Bangladesh, [Accessed from http://www.eldis.org/vfile/upload/1/document/0903/Dhaka_CP_2.pdf , on 27.08.2013]
Standing, G (1984), “Conceptualising territorial mobility”, In: Migration surveys in low income countries: guidelines for survey and questionnaire design, by Richard E. Bilsborrow, A.S. Oberai and Guy Standing. Dover, N.H., Croom Helm, 1984. 31-59.
Stark, O. and Bloom, D. E. (1985), “The new economics of labour migration”, American Economic
Review 75(2), 173–78.
Stark, Oded and Bloom, David E (1985), “The New Economics of Labour Migration”, Accessed from
http://www.ppge.ufrgs.br/giacomo/arquivos/eco02268/stark-bloom-1985.pdf on 24.02.2014.
Stewart, Ross & Carlos Moslares (2014) - Regional Disparities Across Indian States: Are the Trends
Reversing?; Journal of Economics and Development Studies, Vol. 2, No. 3, pp95-111
[available from http://jedsnet.com/journals/jeds/Vol_2_No_3_September_2014/7.pdf, accessed on 26.05.17]
Sundari, S. (2005), “Migration as a Livelihood Strategy: A gender perspective”, EPW Vol.40 Issue
no. 22-23 28 May 2005; [available from https://www.epw.in/system/files/
pdf/2005_40/22-23/Migration_as_a_Livelihood_Strategy.pdf, accessed on 12-02-2018
Taralekar, Radha, Prasad, Waingankar and Tathkar, Pandurang (2012), “A study to assess pattern of
migration across India based on Census data”, International Journal of Recent Trends in
science and Technology, 5(2), 2012.
Todaro, M. (1969), “A Model of Labour Migration and Urban Unemployment in Less Developed
Countries” The American Economic Review, 59 (March 1969): 138-148.
UN DESA (2013), “Cross-national comparisons of internal migration: An update on global patterns
and trends”, Technical Paper No. 2013/1, United Nations, available from
[http://www.un.org/en/development/desa/population/publications/pdf/technical/TP2013 -1.pdf, accessed on 12-02-2019].
Wouters, F.S, (2008), “Migration, Poverty and Inequality (Evidence from Burkino Faso)”, IFPRI
Discussion paper 00786
Yang, D. (2008), “International migration, remittances and household investment: Evidence from
Philippine migrants” exchange rate shocks. Economic Journal 118(528), 591–630.