Putting Sarcasm Detection into Context:
The Effects of Class Imbalance and Manual Labelling on Supervised
Machine Classification of Twitter Conversations
Gavin Abercrombie and Dirk Hovy Center for Language Technology University of Copenhagen, Denmark Njalsgade 140, DK-2300 Copenhagen S
[email protected], [email protected]
Abstract
Sarcasm can radically alter or invert a phrase’s meaning. Sarcasm detection can therefore help improve natural language processing (NLP) tasks. The majority of prior research has modeled sarcasm detec-tion as classificadetec-tion, with two important limitations: 1. Balanced datasets, when sarcasm is actually rather rare. 2. Us-ing Twitter users’ self-declarations in the form of hashtags to label data, when sar-casm can take many forms. To address these issues, we create an unbalanced cor-pus of manually annotated Twitter conver-sations. We compare human and machine ability to recognize sarcasm on this data under varying amounts of context. Our results indicate that both class imbalance and labelling method affect performance, and should both be considered when de-signing automatic sarcasm detection sys-tems. We conclude that for progress to be made in real-world sarcasm detection, we will require a new class labelling scheme that is able to access the ‘common ground’ held between conversational parties.
1 Introduction
Sarcasm, or verbal irony, is prevalent both in spo-ken and written communication, and can radically alter or invert a phrase’s meaning. Automatic sar-casm detection can therefore help improve natural language processing (NLP) tasks, such as senti-ment analysis, where failure to take ironic intent into account has been recognised as a major cause of errors.
However, automatic sarcasm detection is a non-trivial problem, and research into this subject is in its infancy. The majority of prior research has
treated sarcasm detection as a classification task, with two important limitations: 1. It focuses on balanced datasets, when sarcasm is actually rather rare. 2. In order to obtain labelled data for su-pervised learning, many studies relied on Twitter users’ supposed self-declarations of sarcasm in the form of hashtags such as#sarcasm, but sarcasm can take many forms.
Although reporting impressive results for sar-casm detection, even state-of-the-art systems fail to address the above issues. Research suggesting that verbal irony occurs in less than a fifth of con-versations (Gibbs, 2000) implies that, rather than using balanced datasets, a more realistic approach may be to view sarcasm recognition as a prob-lem of anomaly detection, in which positive ex-amples are scarce. While convenient, obtaining labelled data from hashtags has been found to in-troduce both noise, in the form of incorrectly la-belled examples, and bias to the datasets used – analysis suggests that only certain forms of sar-casm are likely to be tagged in this way (Davidov et al., 2010), and predominantly by certain types of Twitter users (Bamman and Smith, 2015).
To address these issues, we create a novel corpus of manually annotated Twitter conversa-tions and, using the feature classes of Bamman and Smith (2015), perform sarcasm classifica-tion experiments on both balanced and unbalanced datasets. We also compare model performance to a dataset of conversations automatically retrieved using hashtags.
Our contributions In this paper, we present a novel corpus of manually annotated two-part Twit-ter conversations for use in supervised classifi-cation of sarcastic and non-sarcastic text. We compare human vs. machine learning classifica-tion performance under varying amounts of con-textual information, and evaluate machine
mance on balanced and unbalanced, and manually labelled and automatically retrieved datasets.
2 Data
Most prior research into sarcasm detection has been conducted on Twitter. To make comparisons with other research, and because use of sarcasm seems to be prevalent on Twitter, we too make use of Twitter data for this study.
However, the collection of data using explicit markers of sarcasm (hashtags) has been shown to introduce bias to the datasets used in prior re-search (Davidov et al., 2010; Gonz´alez-Ib´anez et al., 2011; Maynard and Greenwood, 2014; Bam-man and Smith, 2015). We therefore create a novel hand-annotated corpus of contextualised sarcastic and non-sarcastic Twitter conversations. For com-parison, we also create an automatically collected dataset using hashtags.
Corpus creation The data set is taken from a Twitter corpus of 64 million tweets gathered in 2013. Matching tweet reply IDs to the status IDs of other tweets, and filtering by language, pro-duces 650,212 two-line English Twitter ‘conver-sations.’ We manually annotate these, finding 448 positive examples, to which we add 1,792 neg-atively labelled examples in which sarcasm was found not to be present. The resulting corpus con-tains 2,240 conversations in total. A second cor-pus, which is automatically retrieved using hash-tags, is created, producing 448 Twitter conversa-tion where the second tweet contains#sarcasm, and 1,792 without this feature. Following previous work, we remove usernames and web addresses. For the second corpus, we also remove the term
#sarcasm. We collect up to 3,200 historical tweets written by each user ID in the datasets.
Annotation We annotated the conversations manually with full access to the text of the con-versations and user profile information and tweet history of the users. Following prior work (Kreuz and Caucci, 2007), and because people have been found to conflate many forms of verbal irony un-der the termsarcasm(Gibbs, 1986), positive labels were not assigned according to any fixed criteria or definition, but according to our intuitive un-derstanding of whether or not examples contained verbal irony1
1This was also necessary because prior sarcasm detec-tion studies relied on self-annotadetec-tion of sarcasm by Twit-ter users applying their own judgements of sarcastic
mean-3 Human performance baseline study
This study was undertaken with the participation of 60 native English speaking volunteers. We ran-domly selected 300 Twitter conversations from the corpus and assigned them each one of five condi-tions:tweet only– the text of the reply tweet from the conversation, tweet + author – including ac-cess to the Twitter profile of the author, tweet + audience – including the profile of the writer of the original tweet in the conversation,tweet + en-vironment– the texts of both tweets, andtweet + author + audience + environment– access to all the above information. Each participant rated 10 conversations.
Procedure We asked two participants to rate the reply tweet of each conversation as either sarcas-ticornon-sarcastic. Again, following Kreuz and Caucci (2007), raters were not provided with a definition of sarcasm, but were asked to judge the tweets based on their intuitive understanding of the term.
Inter-rater agreement We use inter-rater agree-ment measures to assess both the difficulty of the sarcasm recognition task under different condi-tions and the reliability of the participants. We report both raw percentage agreement and – as in previous work on sarcasm annotation (Swanson et al., 2014) – Krippendorffsα, which takes into ac-count expected chance disagreement.
Contrary to expectations, annotators are not
more likely to agree if given access to more infor-mation. Agreement is highest for the tweet only
condition (% = 70.49, α = 0.35). Krippendorffs
α scores for tweet + audience (0.08) and tweet + original + author + audience (0.18) are very low, while tweet + audienceproduces a negative score (-0.10) which indicates that agreement is be-low chance levels.
Rater reliability Agreement scores are gener-ally low. Only two pairs obtain ‘good’ agree-ment scores.2 The majority (20 pairs) receive a
score between 0.0 and 0.67, while eight of the pairs achieve negative scores, indicating less than chance expected agreement. Two possible expla-nations for low rater agreement are (1) that sar-casm recognition is a difficult task for humans (Kreuz and Caucci, 2007; Gonz´alez-Ib´anez et al.,
ing e.g., Davidov et al. (2010) 2010, Gonz´alez-Ib´anez et al. (2011).
2011), especially without access to the surround-ing context (Filatova, 2012; Wallace et al., 2014), and (2) that people undertaking such tasks re-motely online are often guilty of ‘spamming,’ or providing careless or random responses (Hovy et al., 2013).
To mitigate the effects of unreliable raters and get an upper bound for human performance, we use two measures: (1) discard the results of the worst performing rater in each pair (in terms of F1) and use the vote of the higher scoring raters. (2) identify the least trustworthy raters and down-weight their votes using scores from an item-response model, MACE (Hovy et al., 2013).
The first requires access to the original anno-tated labels, the latter can be done with or without access to the gold standard. We compare both F1 and Area Under the Curve (AUC) scores of both raters in each pair, the better performing rater only, and the MACE most competent rater in each pair over all conditions.
For both measures, MACE competent rater scores (F1: 0.547; AUC: 0.731) are marginally higher than the mean of both raters (F1: 0.523; AUC: 0.729), while the best rater scores (F1: 0.641; AUC: 0.817) are highest of all, as might be expected.
3.1 Machine classification experiments
To compare human to machine performance, we fit binary classification models on both balanced and unbalanced splits of the two datasets.
Experimental setup We evaluate performance using a standard logistic regression model with
`2 regularization, evaluated via five-fold
cross-validation.
Features For the five conditions, we use the fol-lowing feature classes, as named and described by Bamman and Smith (2015):
Tweet features: Unigrams, bigrams, Brown clus-ter unigrams, Brown clusclus-ter bigrams, part-of-speech features, pronunciation features, and inten-sifier features.
Author features: Author historical salient terms, profile information, profile unigrams.
Audience features: Audience historical salient terms, profile unigrams, profile information, and historical communication features.
Environment features: Pairwise Brown features and unigram features of audience tweets.
Normalisation We convert all features to binary or numeric values and normalize them to the range between zero and one.
Procedure Following Bamman and Smith (2015), we evaluate classification performance on the above feature sets in the following combina-tions:tweet featuresonly,tweet + author features,
tweet + audience features, tweet + environment features, and tweet + author + audience + environment.
4 Results
Accuracy is commonly reported in classifica-tion tasks, but unsuitable for unbalanced datasets (L´opez et al., 2013), so we report two other met-rics frequently used with uneven class distribu-tions: F1 score, and Area Under the ROC Curve (AUC), which reflects the relationship between the true positive rate (TPR) and false positive rate (FPR). Unlike accuracy, these measures penalize predicting only the majority class. AUC is consid-ered to be more resistant to the skew of unbalanced data than F1 (Fawcett, 2004).
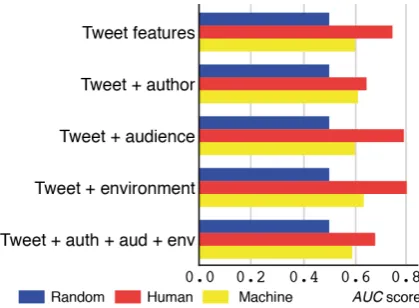
Comparison with baselines Figure 1 compares random performance, human raters,3and the
clas-sifier’s AUC scores. The scores of both the human raters and the machine classifier surpass random performance in all conditions, with the classifier attaining the lowest score of 0.615 ontweet + au-thor features. Machine classification is not, how-ever, able to match human performance. But there are parallels between human and machine perfor-mance: the classifier achieves its highest score us-ingtweet + environmentfeatures (human: 0.802; machine: 0.630). Interestingly, both humans and the classifier appear to suffer from an ‘information saturation’ effect, obtaining lowest scores when trained on a combination of all the possible fea-tures.
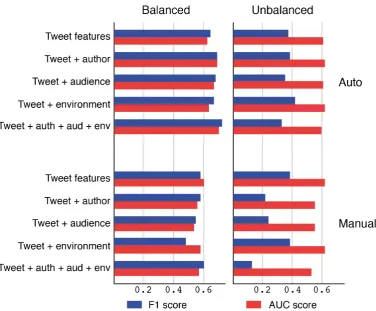
Machine classification performance across con-ditions We have two data-related factors that affect performance, namely (1) label prevalence (i.e., balanced vs. unbalanced splits), and (2) the labelling scheme (manual vs. automatically in-duced from#sarcasm). Figure 2 shows the ef-fects on F1 and AUC for each combination of these two factors under all five conditions.
Figure 1: AUC scores of random performance, the
most competent human raters, and machine clas-sification on an unbalanced split of the manually annotated data.
Class label balance
AUC scores are largely unaffected by change in label balance. We see broadly similar results on both balanced and unbalanced data splits across all the feature classes on both corpora. The small changes in performance that do occur can be at-tributed to the increase in size of the unbalanced datasets, which have more negative training exam-ples compared to the balanced sets.
However, for both corpora, and across all fea-ture classes, F1 scores suffer large drops on the unbalanced data compared to results on the bal-anced datasets. These results indicate that F1, known to be biased to the negative class and to ignore the effect oftrue negatives(Powers, 2015), may not be a suitable metric for this task, as it is very sensitive to the changes in class balance of the datasets. Nevertheless, even when measured with AUC score, in the majority of feature config-urations classifier performance drops on the unbal-anced datasets. Results therefore suggest that class balance (and dataset size) should be taken into ac-count when designing sarcasm detection systems. Labelling scheme
Overall, higher scores are achieved with the auto-matically collected corpus. All feature combina-tions obtain higher F1 and AUC scores on this data using the balanced split, as do tweet + auth and
tweet + audon the unbalanced data. This points to greater homogeneity in the data in the automat-ically collected corpus. This may be because it is often certain types of users, such as those who do not know their audience personally, who feel the need to label their sarcastic statements with
hash-tags (Bamman and Smith, 2015). Manually anno-tated data includes instances of sarcasm which the author has not deemed necessary to explicitly label as sarcastic. This may lead to greater variation in the features of the positive examples in the manu-ally annotated data, and hence lower classification scores.
The only feature category in which F1 and AUC scores for the manually annotated data are higher than those for the automatically collected data are on the unbalanced split fortweet features
(F1: +0.012, AUC: +0.08) and tweet + env (F1: +0.037, AUC: +0.015), whiletweet + auth + aud + env produces a higher F1 score (+0.275), but a slightly lower AUC score (-0.023). These fig-ures point to the fact that for the manually an-notated data, performance is best when linguistic features from both tweets in the conversations are included. Indeed, on both balanced and unbal-anced data splits of the manually annotated data, better results are generally produced using these textual features than using features related to the writers of those texts. It would therefore seem that the annotation process has introduced some biases to the data. This process, in which sarcasm, or the ambiguous possibility of sarcasm, is first recognised in the dialogues and then confirmed by scrutiny of users Twitter pages, heavily favours textual features. Twitter conversations automati-cally selected using hashtags on the other hand, are likely to be highly ambiguous once those hashtags are removed and, as discussed above, more likely to be predictable from information in the conversa-tional participants’ profile metadata than from lin-guistic features.
5 Related Work
Research in both cognitive psychology (Utsumi, 2000; Gibbs and Colston, 2007) and NLP (Fi-latova, 2012) has suggested that it may not be possible to produce an overarching definition of sarcasm. Kreuz (1996) noted that use of sar-casm often depends on the ‘common ground’ peo-ple share. Work on human sarcasm recognition (Kreuz and Caucci, 2007) and automatic sarcasm detection (Bamman and Smith, 2015) has relied on people’s intuitive understanding of the term ‘sar-casm’ for rating and data labelling purposes.
Figure 2: Effects of labeling method (top vs. bottom row) and label prevalance (left vs. right column) on F1 and AUC scores.
Addressing the wider context in which tweets are written, Rajadesingan et al. (2015) mapped infor-mation from the posting history of Twitter users to research on why, when, and how sarcasm tends to be used. They also tested their model on both balanced and unbalanced datasets. Bamman and Smith (2015) showed that a variety of contextual features can improve classification performance over use of textual features alone. However, like Gonz´alez-Ib´anez et al. (2011) and Maynard and Greenwood (2014), they concluded that the use of hashtags for data labelling introduced biases to their dataset.
6 Conclusions
We evaluated the performance of human raters and a machine learning algorithm on sarcasm detection under different information conditions. We find that humans generally benefit from con-text more than machines, but that machine per-formance is even more affected by the label-ing scheme (automatically induced vs. hand-annotated) and the prevalence of the target class. Our results indicate that sarcasm detection is far from solved, and that any results on the task need
to be viewed in the light of the two factors outlined here.
In automatic sarcasm detection, use of unbal-anced datasets led to large drops in F1 scores, due to this metric not taking into account true nega-tives. As the ratio of TNs is necessarily large for effective sarcasm detection on data in which posi-tive examples are rare, AUC seems a more appro-priate performance metric.
in-troducing other forms of bias. It seems that a gold standard sarcasm corpus would require labelling by the annotators who are party to the ‘common ground’ shared by the participants in the conversa-tions. It would also need to include those instances that they wouldnotnormally publicly mark as be-ing sarcastic with hashtags.
Future work will focus on improving the qual-ity and size of labelled corpora available for this task. It will also explore the use of features from the wider conversational context beyond the two-sentence dialogues examined here, and investigate the effects of data labelling method and class bal-ance on media other than Twitter.
Acknowledgements
We would like to thank the participants who vol-unteered their time and effort to make this study possible. We also thank the anonymous reviewers for their invaluable comments.
References
David Bamman and Noah A Smith. 2015. Contextual-ized sarcasm detection on twitter. InNinth Interna-tional AAAI Conference on Web and Social Media.
Paula Carvalho, Lu´ıs Sarmento, M´ario J Silva, and Eug´enio De Oliveira. 2009. Clues for detect-ing irony in user-generated contents: oh...!! it’s so easy;-). InProceedings of the 1st international CIKM workshop on Topic-sentiment analysis for mass opinion, pages 53–56. ACM.
Dmitry Davidov, Oren Tsur, and Ari Rappoport. 2010. Semi-supervised recognition of sarcastic sentences in twitter and amazon. InProceedings of the Four-teenth Conference on Computational Natural Lan-guage Learning, pages 107–116. Association for Computational Linguistics.
Tom Fawcett. 2004. Roc graphs: Notes and practical considerations for researchers. Machine learning, 31(1):1–38.
Elena Filatova. 2012. Irony and sarcasm: Corpus gen-eration and analysis using crowdsourcing. InLREC, pages 392–398.
Raymond Gibbs and Herbert Colston. 2007. The future of irony studies. Irony in Language and Thought, pages 339–360.
Raymond W Gibbs. 1986. On the psycholinguistics of sarcasm. Journal of Experimental Psychology: General, 115(1):3.
Raymond W Gibbs. 2000. Irony in talk among friends. Metaphor and symbol, 15(1-2):5–27.
Roberto Gonz´alez-Ib´anez, Smaranda Muresan, and Nina Wacholder. 2011. Identifying sarcasm in twit-ter: a closer look. InProceedings of the 49th An-nual Meeting of the Association for Computational Linguistics: Human Language Technologies: short papers-Volume 2, pages 581–586. Association for Computational Linguistics.
Dirk Hovy, Taylor Berg-Kirkpatrick, Ashish Vaswani, and Eduard H Hovy. 2013. Learning whom to trust with mace. InHLT-NAACL, pages 1120–1130.
Roger J Kreuz and Gina M Caucci. 2007. Lexical in-fluences on the perception of sarcasm. In Proceed-ings of the Workshop on computational approaches to Figurative Language, pages 1–4. Association for Computational Linguistics.
Roger J Kreuz. 1996. The use of verbal irony: Cues and constraints. Metaphor: Implications and appli-cations, pages 23–38.
Klaus Krippendorff. 2012.Content analysis: An intro-duction to its methodology. Sage.
Victoria L´opez, Alberto Fern´andez, Salvador Garc´ıa, Vasile Palade, and Francisco Herrera. 2013. An in-sight into classification with imbalanced data: Em-pirical results and current trends on using data intrin-sic characteristics. Information Sciences, 250:113– 141.
Diana Maynard and Mark A Greenwood. 2014. Who cares about sarcastic tweets? investigating the im-pact of sarcasm on sentiment analysis. In Proceed-ings of LREC.
D. M. W. Powers. 2015. What the F-measure doesn’t measure: Features, Flaws, Fallacies and Fixes. ArXiv e-prints, March.
Ashwin Rajadesingan, Reza Zafarani, and Huan Liu. 2015. Sarcasm detection on twitter: A behavioral modeling approach. In Proceedings of the Eighth ACM International Conference on Web Search and Data Mining, pages 97–106. ACM.
Reid Swanson, Stephanie M Lukin, Luke Eisenberg, Thomas Corcoran, and Marilyn A Walker. 2014. Getting reliable annotations for sarcasm in online di-alogues. InLREC, pages 4250–4257.
Oren Tsur, Dmitry Davidov, and Ari Rappoport. 2010. Icwsm-a great catchy name: Semi-supervised recog-nition of sarcastic sentences in online product re-views. InICWSM.
Akira Utsumi. 2000. Verbal irony as implicit dis-play of ironic environment: Distinguishing ironic utterances from nonirony. Journal of Pragmatics, 32(12):1777–1806.