Munich Personal RePEc Archive
Hidden Schooling: Repeated Grades and
the Returns to Education and Experience
Kennedy, Kendall
Mississippi State University
31 October 2018
Hidden Schooling: Repeated Grades and the Returns to
Education and Experience
Kendall J. Kennedy
∗October 31, 2018
Abstract
Over the past four decades, nearly 25% of all American public school students re-peated at least one grade in primary or secondary school, and ninth grade repeating increased four-fold. Despite its prevalence, few economists have attempted to account for grade repeating when estimating the returns to education and experience. I show that 10% of the increase in ninth grade repeating was caused by changes in compulsory schooling laws (CSLs). Because CSLs increase both grade repeating and educational attainment, compulsory education-based IV estimates of the returns to education are positively biased by up to 38%. Additionally, grade repeating causes endogenous mea-surement error in labor market experience. Solely through this meamea-surement error, I show that the residual black-white wage gap is overstated by 10%, the wage return to a high school diploma is overstated by 11% relative to dropouts, and the labor supply gap between dropouts and high school graduates is overstated by 23%. Controlling for age instead of experience reduces this bias, suggesting age should be a standard control variable for reduced-form analysis, not experience.
∗[email protected]; The author thanks Philip Oreopoulos for providing a list of compulsory
1
Introduction
Grade repeating in elementary and secondary school is surprisingly common in the United States; the NLSY97 reports that 23% of Americans born in the early 1980s repeated at least one grade at some point in their academic career. Even more surprising is which grades are being repeated. 50 years ago, grade repeating was almost exclusive to Kindergarten and the 1st grade, but from the 1980s to today, researchers (Haney et al., 2004; Heubert and Hauser, 1998; Planty et al., 2009) estimate the annual 9th grade retention rate at between 5 and 15% per year in each year.
This sudden rise in 9th grade retention has largely been ignored by the economics lit-erature, but its effects are potentially quite problematic. 9th grade retention, and grade retention in general, is unobserved in many popular microdata sets, and not reported by de-fault in any popular microdata set. This means that estimation of the returns to education is incomplete, omitting any effects of repeated grades. Instrumental variables estimation using compulsory schooling instruments is particularly affected by this issue, as compulsory school-ing laws are one of the primary causes behind the rise in 9th grade repeatschool-ing. In addition, the typical measures of labor market experience face large and potentially endogenous mea-surement error when failing to account for grade repeating in any grade. The most common measure of labor market experience is a simple proxy, Age−Educational Attainment−6. For grade repeaters, however, this measure does not correctly state the number of years a person has been out of school, because educational attainment does not include repeated grades. Thus, failure to account for repeated grades in calculating experience can create bias in other estimates, if repeating rates are correlated with the variable of interest.
instrumental variables estimates using quarter of birth and/or compulsory schooling law instruments are biased by up to 38% when failing to account for 9th grade repeating. Fur-thermore, I show that estimates of the residual black-white wage gap are overstated by 10% when failing to account for repeated grades in the measure of labor market experience. The wage gap between GED recipients and high school graduates is overstated by 18% and the employment gap is overstated by 34% when failing to account for repeated grades.
I first construct a set of 9th grade repeating rate estimates using state-level enrollment data from the National Center for Education Statistics (NCES), and compare these esti-mates to administrative data on repeating rates, as well as to another potential repeating rate estimate from the Current Population Survey (CPS) October Supplement. I then move to an examination of compulsory schooling laws. Compulsory schooling laws (CSLs) have been both directly (Acemoglu and Angrist, 2000; Lochner and Moretti, 2004) and indirectly (e.g. quarter of birth as in Angrist and Krueger 1991) used as exogenous sources of variation in estimating the returns to education. I demonstrate that increases in CSLs from 1965 to 2014 caused a 0.7 percentage point increase in the annual 9th grade retention rate; changes in CSLs are responsible for approximately 11% of 9th grade retention in the United States over the past 50 years.
upward bias in the corrected IV estimates.
Education and experience are two of the most popular controls in studies using individual-level data, but both of these are mismeasured in the presence of repeated grades and can introduce considerable bias. By default, nearly all popular datasets define “Education” as
educational attainment, which is the highest level of education an individual completed.1
Failing to account for repeated grades in measurement of education has the potential to create bias if repeated grades have a non-zero return. More concerning, however, is the measurement of experience; typically, experience is replaced by a proxy “Potential Experi-ence” variable, calculated as Age−Educational Attainment−6.2 This experience measure
overstates the true level of “potential experience” for grade repeaters, meaning that if the primary variable of interest is correlated with grade repeating, the inclusion of “potential experience” as a control introduces endogeneity into the model.
Using the NLSY97, I estimate the bias caused by mismeasurement of potential labor market experience in two areas of interest – estimation of the residual black-white wage gap (as in Bound and Freeman 1992) and estimation of the returns to a GED (as in Cameron and Heckman 1993). Black students are 2.5 times as likely as white students to repeat grades; I show that for early career male workers, the residual black-white wage gap is overstated by 10% when failing to account for repeated grades. GED recipients are 3.5 times as likely as high school graduates to repeat grades; I show that the wage return to a GED is understated by 18%, relative to a high school diploma, and the employment gap, measured by annual hours worked, for GED recipients is overstated by 34%, relative to a high school diploma when failing to account for repeated grades.
1
The US Census, the American Community Survey (ACS), the Current Population Survey (CPS), the National Longitudinal Survey of Youth (NLSY), the Panel Study of Income Dynamics (PSID), and many others report educational attainment as the default education variable.
2
These findings have wide-reaching implications. 9th grade repeating is endogenous with compulsory schooling instruments, suggesting a need to revisit previous IV estimation of the returns of education, both for labor market outcomes such as wages and employment and for non-labor market outcomes such as crime and health. Studies controlling for education, and particularly for experience, need to be cognizant of the prevalence of grade repeating in the United States. The typical measure of experience used in the economics literature faces substantial measurement error, that has an incredibly high potential to introduce endogene-ity.
The remainder of the paper proceeds as follows. Section 2 explains how repeated grades bias estimation of the returns to education and experience. Section 3 discusses the data sources used in this study. Section 4 describes the construction of estimates and presents stylized facts for the 9th grade repeating rate over the past 50 years. Section 5 presents theory and results regarding 9th grade repeating and compulsory schooling instruments. Section 6 presents results from estimation of the residual black-white wage gap and returns to the GED using a corrected measure of potential labor market experience, and provides a discussion of potential solutions to mismeasurement of labor market experience. Section 7 provides concluding remarks.
2
Repeated Grades Bias
2.1
Compulsory Schooling as Instrumental Variables
an IV in the estimation of the private and external wage returns to education. In addition, they use quarter of birth as an alternate set of instruments, similar to Angrist and Krueger (1991), which operate on the same margin; both CSLs and quarter of birth affect the age and grade at which a teenager can legally drop out of school. A teenager facing a minimum dropout age of 16 would historically be expected to drop out around the 10th grade; de-pending on their quarter of birth, this teenager may drop out before, during, or after the 10th grade. Both of the aforementioned studies estimated the effects of education on wages; other studies have used CSLs as instruments in estimating the effects of education on crime (Lochner and Moretti, 2004), health and happiness (Oreopoulos, 2007a), employment and poverty status (Oreopoulos, 2007b), and many other outcomes.
9th grade repeating causes two issues with the IV estimate of the returns to education: first, the IV’s effect on educational attainment is weakened by 9th grade repeating. CSLs may not cause 9th grade repeaters to increase their educational attainment; they instead repeat the 9th grade, meaning that CSLs are more likely to face weak instrument bias in the presence of 9th grade repeating. Second, and more concerning, if there is any return to repeating the 9th grade, CSLs are invalid instruments. To illustrate this, consider the following simple form of a 2SLS estimation of the returns to education:
Ed Attainmenti =α0+α1CSLi+λXi+ui (1)
Yi =β0+β1Ed Attainmentid + ΓXi+εi (2)
Ed Attainmenti =α0+α1CSLi+λXi+ui
Repeat 9thi =δ0+δ1CSLi+ ΩXi+vi
(3)
Yi =β0 +β1Ed Attainmentid +β2Repeatd9thi+ ΓXi+εi (4)
If the IV is exogenous to 9th grade repeating, then 2SLS estimation of equations 1 and 2 will return a consistent estimate of the return to educational attainment, even if 9th grade repeating has a return to the outcome being tested. However, in Section 5.1 I demonstrate that changes in compulsory education cause a 0.7 percentage point increase in 9th grade repeating. This may appear to be a small change, but the 1st stage regression in equation 1 typically returns an estimate in the range of 0.07 to 0.1. This suggests that no more than 7-10% of the population increases their educational attainment as a result of CSLs, and that the effect on 9th grade repeating is within an order of magnitude of the effect on educational attainment.3
In IV estimation, the bias caused by omission of an endogenous variable has the potential to be quite large, particularly if the 1st stage estimate is weak or small. The IV estimate of the returns to education in the presence of endogenous 9th grade repeating, as in equations 1 and 2, can be expressed as:
ˆ
βIV1 =
ddY dCSL d dEdAttainment dCSL p
−→β1
dEdAttainment dCSL +β2
dRepeat9th dCSL dEdAttainment
dCSL
= β1∗α1+β2
dRepeat9th dCSL
α1 (5)
Equation 5 provides a clear illustration of the selection bias caused by 9th grade repeating; given that the 1st stage point estimate ˆα1 is only between 0.07 and 0.1, even a small effect
3
of repeating the 9th grade (β2) would cause massive selection bias – 10-14 times as large
as β2 × dRepeat9thdCSL . This bias is entirely unique from the typical concerns with CSLs as IVs
– that they are weak instruments (Bound et al., 1995) and that they are only estimating a local average treatment effect (LATE) (Imbens and Angrist, 1994). Instead, 9th grade repeating causes selection bias due to the CSL instrument being endogenous in the second stage regression. In Section 4 I show that 9th grade repeating did not become prevalent until the mid-1980s. Thus, this is less of a concern for studies using older data. However, any modern study is susceptible to CSLs being invalid instruments.
2.2
Repeated Grades and Potential Labor Market Experience
Repeating any grade, not just the 9th grade, can cause severe, endogenous measurement error in estimating the returns to experience. Labor market experience, strictly defined, should be measured as the lifetime number of hours or weeks worked. However, this measure is highly endogenous, as selection into labor force participation and employment is correlated with numerous unobservable characteristics (e.g. Eckstein and Wolpin 1989). Most economic studies are not interested in a precise estimate of the returns to experience, instead wishing to control for potential endogeneity of labor market experience with the other variables of interest in the model. To control for experience without introducing the selection bias from labor force participation and employment, conventionally researchers use a “potential expe-rience” proxy variable, calculated as Age−Educational Attainment−6.
as having 12 years of potential labor market experience, but in reality they only have 11 years of their adult life that they were not in school, having graduated from high school a year later than their peers.4 If grade repeating is correlated with the variable of interest,
then measurement error in this potential experience proxy variable biases the primary es-timate of interest, as labor market experience is systematically overstated for grade repeaters.
3
Data
3.1
Aggregate Repeating Rate Analysis
I compile a dataset of state-level 9th grade retention rates for analyzing recent trends in repeating and for demonstrating the endogeneity of compulsory schooling laws with 9th grade repeating. For this, my main data source is the National Center for Education Statistics’ (NCES) Annual Reports Program Historical Tables on elementary and secondary enrollment. This provides enrollment counts in each grade, Kindergarten to 12th grade, from 1965 to 2003. I link this with the NCES’s Elementary/Secondary Information System (ELSi) from 2003 to 2014 to form a complete panel of state-level enrollment by grade from the 1965-66 school year to the 2013-14 school year. For analysis on compulsory schooling, I use a list of compuslory schooling law changes from 1965 to 2005 from Oreopoulos (2006). This is combined with changes from 2003-2014 taken from Mackey and Duncan (2013), and verified with information from The Education Commission of the States.
Data directly measuring repeating rates are generally nonexistent. However, there are two incomplete sources of data that I use to verify the validity of my repeating rate estimates.
4
First is a list of repeating rates reported in Heubert and Hauser (1998). These repeating rates are reported for 27 states in various years from 1979 to 1997 – there are only 81 obser-vations in this dataset, meaning each state reports repeating rates an average of 3 times. I combine this with data from the Massachusetts Department of Elementary and Secondary Education from 1998-2012 to form a dataset of 97 observations of state-reported 9th grade repeating rates with which I can compare my estimates. I additionally compare my estimated repeating rates with the Current Population Survey’s (CPS) October Education Supplement.
3.2
Returns to Education and Experience
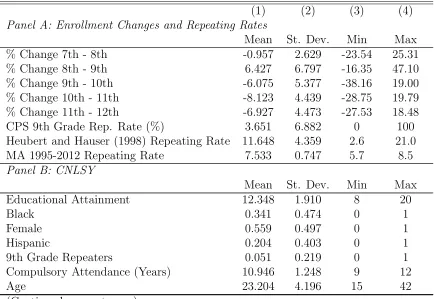
Panel A of Table 1 shows summary statistics for enrollment changes. My preferred estimates of the annual 9th grade retention rate, the 8th to 9th grade enrollment change and the 9th to 10th grade enrollment change, are on average 6% across states and years, 1965-2013. In less than 5% of the sample, the 8th to 9th grade enrollment change is negative and the 9th to 10th grade enrollment change is positive – these are omitted from my analysis. Panel B describes the CNLSY used in analysis of compulsory schooling laws. The CNLSY oversamples black individuals; they account for 34% of the observations. The average level of compulsory attendance is about 11 years, and the average educational attainment is 12.3 years. The CNLSY only identifies which individuals ever repeated the 9th grade; as a result, I am unable to identify individuals who repeated more than once. Panel C describes the NLSY97 sample used in analysis of black-white gaps and the returns to the GED. Here, I can observe all grade repeating, as well as individuals who repeated multiple grades. About 4% of the sample repeated the 9th grade at least once, and 24% of the sample repeated any grade.5 Finally, Panel D describes the frequency of different minimum dropout ages from
1965 to 2014. Dropout ages below 16 are extremely rare, only occurring in two states (MS from 1979-93, AR from 1977-80). The most common minimum dropout age is 16, with 18 becoming more popular; 24 states had a minimum dropout age of 18 in 2014, compared with only 4 in 1965.
4
9th Grade Repeating Rates
4.1
Estimation
Administrative and nationally representative survey data on grade repeating rates are generally quite rare. At the national level, Haney et al. (2004) use enrollment data from the National Center for Education Statistics (NCES) to examine attrition between grades,
5
that is, students who do not proceed normally to the next grade due to retention or drop-ping out, from the 1960s to 2000s. They show that the average attrition rate between the 9th and 10th grades grew from about 3% in the late 1960s to 12% in 2000. The attrition rate between the 9th and 10th grades can be approximated as 9th grade retention rate+ 9th grade dropout rate−10th grade retention rate.6 They do not directly compare the
attrition rate to 9th grade retention rates, but suggest a rise in 9th grade retention as the predominant cause of this attrition change. In contrast, Hauser et al. (2007) use the Current Population Survey (CPS) to assemble annual repeating rate estimates for the United States – they claim that annual 9th grade retention rates were only between 2.2% and 4.2% from 1995 to 2005. State-level retention rates are rarely available, with administrative data coming from a study by the National Research Council (NRC) in 1999, as well as from the Mas-sachusetts Department of Education (MADoE). In this section, I fill this gap in the literature by assembling a state-level panel dataset of 9th grade repeating rate estimates, and testing their accuracy against the highly incomplete, but otherwise accurate administrative data to determine the proper dataset for use in this study and in future work on 9th grade repeating.7
I assemble state-level repeating estimates from the two sources used in Haney et al. (2004) and Hauser et al. (2007): the NCES enrollment data and the CPS October Education sup-plement. The NCES data come from two programs – enrollment by grade (1st-12th) and state from 1965-2003 is from the NCES Annual Reports Program Historical Tables, and en-rollment by grade and state from 2004-2014 is from the NCES Common Core of Data. These enrollment counts only cover public schools, which make up over 90% of all students in the United States. Although these enrollment data do not directly measure 9th grade retention
6
The 9th to 10th grade attrition rate can also be affected by movement between private and public schools, death rates, and immigration, but these are have much smaller effects than retention and dropouts.
7
rates, the growth in enrollment between 8th and 9th grades and the attrition between 9th and 10th grades may be reasonable estimates of retention.
Due to the repeated survey structure of the CPS, it provides a direct measure of 9th grade repeating rates. I first restrict my sample to only include individuals enrolled in the 9th grade in the first year they were surveyed. I then observed their grade in the second year they are surveyed; 9th grade repeaters are enrolled in the 9th grade in both years.8 I
then average these 9th grade repeating rates within each state-year pair to assemble a panel dataset of 9th grade repeating rates from 1976-2016.
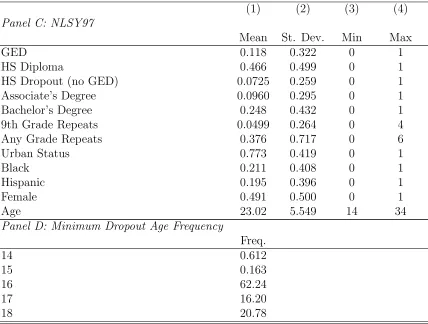
For the NCES and CPS estimates to be valid estimates of the true 9th grade repeating rate, they should be highly correlated with and similar in magnitude to the true rate. To begin, I examine the correlations between the NCES and CPS estimates of the 9th grade repeating rates and the true 9th grade repeating rates from the NRC and Massachusetts DoE. Correlations and p-values from the testH0 :ρ= 0 are shown in Table 2.9
Table 2 clearly shows a weak correlation between the CPS estimate and the true re-peating rates from the NRC and MA, while showing strong correlations for the enrollment change estimates from the NCES, particularly for the 9th-10th grade enrollment change. While none of these estimates show perfect correlation with the 9th grade repeating rate, the NCES estimates are potentially valid, but noisy, measures of the true 9th grade repeating rate. However, these correlation tests do not verify that these estimates are comparable in magnitude to the true 9th grade repeating rate, only that annual and between-state
varia-8
Some 9th graders observed for the first time may already be repeaters. However, if the CPS is a valid dataset for 9th grade repeating analysis, the proportion of individuals who were already 9th grade repeaters in the first year surveyed would represent the proportion of the 9th grade population who are repeaters for a given state-year pair. Those who repeat the 9th grade for a 2nd time should be representative of the population that repeats the 9th grade more than once.
9
tion is proportionate. To test similarity in magnitude, I perform a series of OLS regressions without constants. A valid estimate of the 9th grade repeating rate will have a high R2 and a coefficient estimate near 1.10
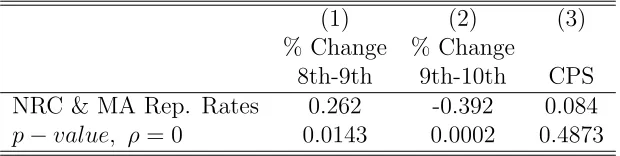
Table 3 shows results from regressions of the true 9th grade repeating rates from the NRC and MA on my 9th grade repeating rate estimates. Columns (1) and (2) show similar results – the NCES estimate is 12-14% larger than the true 9th grade repeating rate on average, but shows a high R2, the 9th grade to 10th grade change explains nearly 75% of the variation in the true 9th grade repeating rate. Column (3) shows the CPS estimate is 24% smaller than the true 9th grade repeating rate on average, and explains substantially less variation in the true repeating rate than the enrollment change estimates. Column (4) presents an alternative way to rank these estimates – the 9th-10th grade enrollment change explains the majority of the variation in the true repeating rates, the 8th-9th grade change explains a smaller portion of the variation, and the CPS estimate has no explanatory power in comparison to the other two estimates.11 Given that theR2 in column (4) is only slightly
larger than in column (1), the 9th-10th grade enrollment change appears to be a strong estimate of the true 9th grade repeating rate, while the 8th-9th grade enrollment change is a still a meaningful, but noisier estimate.
4.2
Stylized Facts
From Table 1, the average 9th grade repeating rate in a US state from 1965-2014 was about 8% per year. However, the 9th grade repeating rate has not been stable over time. Figure 1 shows enrollment by grade for the 1977 and 2014 graduation cohorts, for all public
10
TheR2
from a regression without a constant is not directly comparable to theR2
from regressions with a constant, as imposing the point (0,0) in the regression modifies the interpretation of residuals. Nevertheless, in comparing three models without constants,R2
provides a meaningful basis on which I can rank the validity of my estimates.
11
school students in the United States.12 The 1977 cohort in Graph (a), who entered the 1st
grade in 1965 and were in the 9th grade in the 1973-74 academic year, is representative of historical enrollment patterns in the United States. The 1st grade is substantially larger than the 2nd grade, as many students are retained in early elementary education for non-academic reasons, i.e. to aid in their social and behavioral development. Enrollment is relatively stable from the 2nd grade until high school, with minor fluctuations between grades and a small increase in 9th grade enrollment relative to 8th grade enrollment. Then, enrollment drops from the 9th to 12th grades, as students are legally allowed to drop out of school – usually, around age 16 in the mid-1970s.
The 2014 cohort in Graph (b) shows a markedly different pattern. 1st grade enrollment is no longer substantially larger than 2nd grade – this is likely due to the growing popularity of Kindergarten; socially and behaviorally underdeveloped children now are likely to repeat Kindergarten, not the 1st grade. As in the 1970s, enrollment is stable in elementary and middle school. However, the 9th grade is substantially larger than the 8th grade, or any other grade for the 2014 cohort; There are over 350,000 more 9th graders in the 2010-11 academic year than 8th graders in the 2009-10 academic year (9.7% larger), and over 250,000 more 9th graders in 2010-11 than 10th graders in 2011-12 (6.8% larger). The decline in high school is not as steep for the 2014 cohort as for the 1977 cohort, due to higher compulsory schooling requirements and increased graduation rates over the past 50 years.
Figure 2 shows the 9th grade repeating rate estimates calculated in Section 4.1 from 1965-2014. The top line shows the 8th-9th grade enrollment change estimate, and the bot-tom line shows the 9th-10th grade enrollment change estimate. These two estimates are not exactly equal in magnitude, the 8th-9th grade change is generally 1 to 2 percentage points larger than the 9th to 10th grade change, but the pattern is highly symmetric. Taking the
12
9th-10th grade change as the preferred estimate of the 9th grade repeating rate, from 1965 to the early 1980s the 9th grade repeating rate was 2-5% per year. In the 1980s, the rate grew dramatically, reaching a peak of 11.4% in 1998, then rapidly declined after 2003. The center line shows the enrollment change from 8th to 10th grade; this shows no discernible trend and is generally near 0, verifying that the estimated growth in 9th grade repeating is not caused by immigration, moving from private to public school, or changes in dropouts in the 9th or 10th grades. If the estimated growth in 9th grade repeating were caused by immigration or moving from private to public school, we would see an increase in the 8th to 10th grade enrollment change. If it were driven by an increase in the 9th grade dropout rate or a decrease in the 10th grade dropout rate, we would see a decrease in the 8th to 10th grade enrollment change. Overall, these estimates show that 9th grade repeating more than tripled from the 1960s to the late 1990s; the growth in 9th grade repeating is one of the greatest educational trends of the past 50 years, and yet it has been largely ignored by the economics literature.
5
Compulsory Schooling
5.1
Compulsory Schooling Law Effects on 9th Grade Repeating
promotion to performance on annual standardized tests.13
I argue that these institutional changes may have been the driving force behind the growth in 9th grade retention, but that none of these changes would have caused such a dramatic increase in retention without an external force preventing students from dropping out of school. A 9th grader who is told he or she will be retained in the 9th grade for an additional year would have a strong incentive to drop out of school, as they would be forced to forgo an extra year in the labor market to achieve the same educational attainment as their non-retained peers. Compulsory schooling laws make it illegal for these students to leave school in the 9th grade – from 1965 to today, only two states (Arkansas and Missis-sippi) ever had a minimum dropout age below 16, and after 1994 no state had a minimum dropout age below 16.
A first-time 9th grader will typically enter the 9th grade at age 14, so a minimum dropout age of 16 creates a binding enforcement mechanism that causes a retained 9th grader to ac-tually repeat the 9th grade instead of dropping out of school. Although no on-track 9th grader was legally allowed to drop out of school, in the 2004-2005 school year 9th grade dropouts made up over 23% of all dropouts in the country (Sable et al., 2007). The existing literature has ignored the role of compulsory schooling laws (CSLs) on 9th grade retention; this is especially surprising, since there were many compulsory schooling law increases across the country from the mid-1980s to mid-2000s, when the majority of the rise in 9th grade retention occurred. Figure 3 shows the average minimum dropout age faced by an American high school student from 1965 to 2014, calculated as the average dropout age across states, weighted by state enrollment in grades 9-12.
13
Figure 3 shows that the typical high schooler faced a minimum dropout age of 16.3-16.5 from 1965 to the mid-1980s. Over the next 20 years, the dropout age grew by about 1 year, peaking at 17.2 in 2005, then falling slightly to an average minimum dropout age of 17.1 today. Overall, states changed their minimum dropout age a total of 61 times in this time period. The minimum dropout age is likely to continue to rise, as in President Barack Obama’s 2012 State of the Union Address, he “call[ed] on every state to require that all students stay in high school until they graduate or turn eighteen.”
I estimate the causal effect of changes in compulsory schooling laws on the 9th grade retention rate using difference-in-differences estimation with the estimating equation below:
% Changes,t=β0+β1M in Drop Ages,t+γt+λs+εs,t (6)
In equation 6, the % Changes,t refers to the 9th grade repeating rate estimate in state
s and year t, M in Drop Ages,t refers to the minimum dropout age in a state-year pair, and
λs and γt are state and year fixed effects, respectively. β1 is the coefficient of interest, the
causal effect of an increase in the minimum dropout age on 9th grade retention.14 This
specification has the advantage of being immune to between-cohort population changes. For example, the large population growth in the West and South over the past 50 years does not affect the level of the outcome variable. Given the regression specification, the standard identifying assumption for difference-in-differences estimation applies: states not changing their minimum dropout age have parallel trends in 9th grade retention to states changing their minimum dropout age prior to the law change.
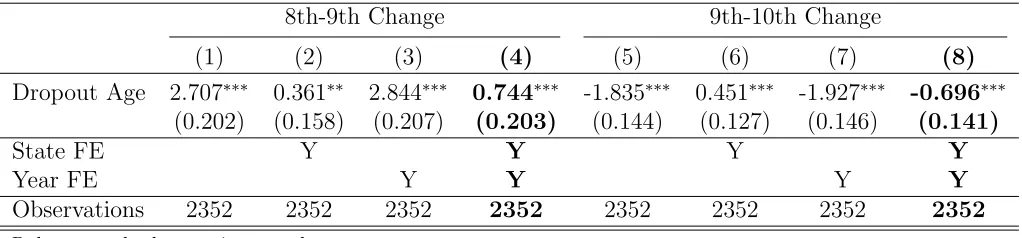
Table 4 shows the results from estimating equation 6. Columns (1) and (5) of Table 4 show that states with higher minimum dropout ages have greater 9th grade retention. In the
14
difference-in-differences specifications in columns (4) and (8), one extra year of compulsory education increases the 9th grade retention rate by approximately 0.7 percentage points – an 11.5% increase relative to the mean 9th grade retention rate of 6.1%.15 This suggests
that while the expansion of compulsory schooling laws is not entirely responsible for the rise in 9th grade retention, compulsory schooling law changes still played an important role. Continuing to raise the minimum dropout age may additionally erase the recent reductions in 9th grade retention rates (from 11.4% in 1998 to 5.3% in 2012).
To test the identifying assumptions of the difference-in-differences model, I perform the conventional event study-style test of lags and leads of compulsory schooling law changes. I estimate the following model:
% Changes,t =α+
5
X
k=−5
βk 1(CSL Increaset+k) +γt+λs+εs,t (7)
In equation 7, the term 1(CSL Changet+k) is an indicator for an increase in the min-imum dropout age in year t+k – states that change their minimum dropout age multiple times within 5 years are omitted, as it is not possible to assign treatment status in this event study structure for these states. This leaves 33 minimum dropout ages changes used to verify the parallel trends assumption. The endpoints 1(CSL Increaset−5), 1(CSL Increaset+5)
are cumulative, meaning that all observations 5 or more years away from a CSL change are assigned the same treatment status. Finally, βt−3 is normalized to 0. Figure 4 shows the
coefficient estimates {β−5, ..., β5} from the regression in equation 7.
Figure 4 shows no discernible pre-existing trends in the 9th grade retention rate, aside from possibly a small deviation at (t −5). Looking at the preferred 9th grade retention
15
rate in Graph (b), Figure 4b shows a small, but noticeable increase in 9th grade retention, corresponding to a reduction in the 9th-10th grade enrollment change, immediately upon changing the minimum dropout age. This effect may only be temporary, as the coefficient estimate reverts to its plaw change level within 3-4 years, but if so, this temporary re-duction is strong enough to cause a 0.7 percentage point increase in the 9th grade retention rate on average.16
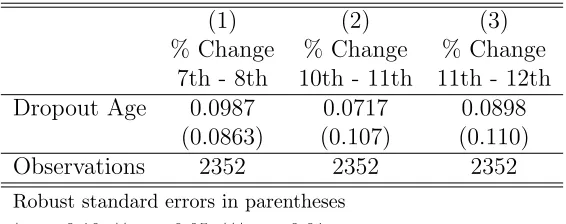
Next, I perform the same analysis to test for CSL effects on the change from 7th to 8th grade, from 10th to 11th grade, and from 11th to 12th grade. Table 5 shows results from estimation of equation 6 on these three outcomes. The change from 7th to 8th grade is a placebo test, as CSLs should not have any effect on promotion from 7th to 8th grade. I would see positive effects on the changes from 10th to 11th and from 11th to 12th grades if CSLs prevent on-track high schoolers – that is, those who are promoted to the next grade – from dropping out of school.
All 3 of the outcomes in Table 5 are unaffected by CSL changes. This is unsurprising for the 7th to 8th grade enrollment change, but is somewhat unexpected for the other two outcomes. CSLs are generally thought of as dropout prevention tools, and their use as instruments in IV regressions of the returns to education hinges on the idea that CSLs, by preventing teenagers from dropping out of school, increase educational attainment. Given these findings, it is crucial to reexamine the validity of CSLs as instruments in the modern era using data that allows observation of both educational attainment and grade repeating.
5.2
Correcting IV Estimates of the Returns to Education
Most publicly available microdata do not allow the researcher to observe repeated grades in any form. However, some longitudinal surveys track each individual’s grade enrollment
16
in each year, allowing the observation of repeated grades. Other surveys ask a detailed his-tory of grade repeating. For this analysis, I use the National Longitudinal Survey of Youth 1979 Children and Young Adults (CNLSY), which provides a wide time horizon, covering individuals born between 1970 and 1999. In this period I observe a large number of CSL changes – 28 states change their CSL in this time period. The CNLSY surveys individuals biennially, but in each survey asks a history of grade repeating. Each individual who ever reports having repeated the 9th grade is coded as a 9th grade repeater.17
Angrist and Krueger (1991) use quarter of birth as an instrument in their well-known estimation of the effects of education on wages. Acemoglu and Angrist (2000) modify this instrument, using quarter of birth interacted with year of birth, and supplement this by directly including compulsory education as an instrument.18 I replicate their methodology
in the CNLSY, estimating the private returns to education, beginning with the following OLS estimating equation:
log(W agei) =β0+β1Ed Attainmenti +β2Rep 9thi+β3Blacki+
β4Hispanici+β5F emalei+λit+γis+εi
(8)
In equation 8, I modified Acemoglu and Angrist’s OLS estimation in two ways: first, I included black, hispanic, and female individuals in the sample. This analyzes a different population, thus resulting in a different local average treatment effect than that found by Acemoglu and Angrist, but inclusion of these groups will estimate a LATE that is closer to the population-level average treatment effect. Second, I control for whether an individual repeated the 9th grade. In OLS estimation, this is unlikely to change the estimate ofβ1 by
17
A small number of individuals may have repeated the 9th grade more than once; however, the question asked in the CNLSY does not permit the observation of these multi-time repeaters.
18
a significant amount. Selection bias caused by correlation between educational attainment and grade repeating may exist, but the effect of grade repeating on wages is likely to be quite small. I also control for state of residence γis and birth year λit, as in Acemoglu and Angrist (2000).
OLS regressions provide a comparison for the 2SLS estimation of the effects of educational attainment on wages. As 9th grade repeating is likely endogenous in equation 8, as is educational attainment, I use compulsory schooling and/or quarter of birth as instruments for both of these endogenous variables. Compulsory education instruments are three indicators for each level of compulsory education, defined as CEis = M inimum Dropout Ages −
School Entry Ages for state s, with a minimum of CE = 9 and a maximum of CE = 12. Quarter of birth is as in Acemoglu and Angrist (2000), with an indicator for quarter of birth interacted with a year of birth fixed effect. The three 2SLS regression equations are given below:
Ed Attainmenti =α0+α1CEis+α2QOBi×λit+ηXi+ui
Rep 9thi =δ0 +δ1CEis+δ2QOBi×λit+ψXi+vi
(9)
log(W agei) =β0+β1Ed Attainmentid +β2Repd9thi+ ΓXi +εi (10)
The controls in Xi are identical to those in equation 8, except regressions with quarter of birth instruments do not contain separate year of birth fixed effects due to collinearity. I estimate the selection bias caused by CSL instruments by comparing ˆβIV when correctly
accounting for 9th grade repeating to ˆβIV when not accounting for 9th grade repeating.
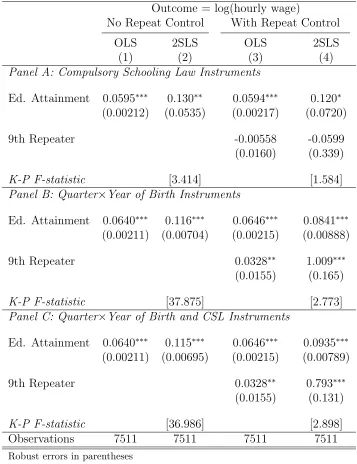
Table 6 presents results from these regressions.
grade repeating. Panel A shows results for compulsory schooling law instruments – binary indicators of the number of compulsory years of education in each state-year pair. Column (2) shows a much larger effect of education on wages than the OLS estimate, typical for com-pulsory schooling instruments as the local average treatment effect (LATE) is larger than the average treatment effect, even with selection bias in the OLS case (see Imbens and Angrist 1994 for details). Columns (3) and (4) show comparisons of OLS to IV regressions accounting for 9th grade repeating. Unfortunately, the 1st stage shows that these compulsory schooling instruments are weak, with an F-statistic of only 3.4 when not accounting for 9th grade repeating and 1.584 when accounting for 9th grade repeating. A comparison of column (2), omitting 9th grade repeating, to column (4), including 9th grade repeating, shows that the omission of 9th grade repeating from the model specification causes approximately 8% bias in the returns to education.19
Panels B and C of Table 6 show results using quarter of birth instruments. I show that quarter of birth instruments are strong as predictors of educational attainment, as asserted by Imbens and Angrist (1994) and Acemoglu and Angrist (2000). This results in a slightly smaller estimate than in Panel A, as weak instruments positively bias the IV estimate of the returns to education. Including 9th grade repeating in the estimation, however, results in a markedly lower estimate of the wage return to education. Although the instruments in column (4) are weak, with an F-statistic of only 2.7, this should bias the return to education
upward, in the direction of OLS selection bias (Bound et al., 1995). Omission of 9th grade repeating thus causesat least 38% bias in the estimate of the private wage return to educa-tion when using quarter of birth instruments.
Inclusion of compulsory schooling law and quarter of birth instruments in Panel C reveals a similar pattern – omission of 9th grade repeating in this specification causes 23% upward
19
bias in estimation of the returns to education. Although the returns to repeating the 9th grade are unbelievably high – it is unreasonable to think that repeating the 9th grade causes wages to increase by 80-100% – this is the result of instrument weakness in predicting 9th grade repeating, and suggests that, if anything, the estimate of the return to education is still too large after accounting for 9th grade repeating. Weak instrument bias is in the direction of OLS selection bias. OLS estimates of the returns to education face positive selection bias from endogenous variables such as ability and household income, so IV estimates using weak instruments will be positively biased. Overall, unless accounting for 9th grade repeating, compulsory schooling instruments are invalid and create severe bias.
6
Repeated Grades and Experience
6.1
Black-White Wage and Hours Gaps
In this section, I consider how poor measurement of potential labor market experience biases estimates of the black-white wage and employment gaps. To understand the channel by which measurement error in experience biases these estimates, consider the regression model estimated by Bound and Freeman (1992):
log(W agei) = β0+β1Blacki+αEd Attainmenti+γExperiencei+ηU rbani+εi (11)
be biased.
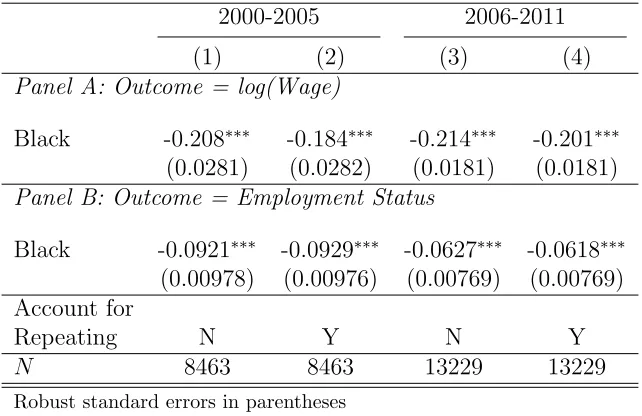
I use the NLSY97 to reexamine the early career black-white wage gap, accounting for repeated grades. In the NLSY97, blacks are almost twice as likely as whites to have their po-tential labor market experience misstated due to grade repeating; in 2010, 16% of whites and 31% of blacks had repeated at least one grade, causingAge−Ed Attainment−6 to overstate their experience. Since experience has a positive effect on wages, systematically overstating the level of experience for black workers more than for white workers will result in a residual black-white wage gap that is too large. Some of the residual black-white wage gap estimated by Bound and Freeman can likely be attributed to differences in repeating rates by race, not to labor market discrimination. I replicate their regression model, but remeasure experience asmin(Age−Ed Attainment−Repeated Grades−6, Age−Repeated Grades−18) to ac-curately measure potential labor market experience: that is, the number of years since each individual completed their schooling. Table 7 reports results from estimating equation 11 and an analogous returns to employment regression for early career (2000-2005, ages 18-25) and slightly later career (2006-2011, ages 22-31) workers.
in column (3) is because mismeasurement in experience is less important for older workers. In column (1), most individuals who repeated grades have their experience overstated by 25-100%. In column (3), since these workers now have 5-10 years of experience, experience is overstated by only 10-20%. The bias caused by misstating experience is less important for older workers, as it constitutes a smaller portion of their overall experience level.
Panel B shows no bias in the black-white employment gap caused by mismeasurement of experience. This is because experience appears to have little effect on employment status. The full set of experience indicators for the black-white wage gap and black-white employ-ment gap are shown in Tables A2 and A3 – only two of the experience level indicators in columns (1) or (3) are significantly different from the baseline level of 0 in Table A3. While experience has large wage returns (8-10% per year), it has small employment returns (0.5% per year), causing little to no bias in the black-white employment gap regressions. Repeated grades are an important consideration in future estimation of black-white wage differentials. The substantial correlation between grade repeating and race cause grade repeating to be key in ensuring an unbiased estimate of the residual black-white wage gap.
6.2
Returns to GED
Grade repeating, as one might expect, is highly correlated with education. Table 8 shows the proportion of individuals in the NLSY97 with each level of education who repeated at least one grade in elementary and secondary school.
are 3.5 times as large as the repeating rates for high school graduates. The incredibly high grade repeating rates of non-high school graduates cause substantial measurement error of potential labor market experience when estimating wage and annual hours worked returns, whether comparing high school graduates to GED recipients or to high school dropouts. I estimate the bias caused by this measurement error in the NLSY97 by replicating the OLS estimation of Cameron and Heckman (1993) as below:
log(W agei) =β0+β1GEDi+β2Dropouti+β3HS Diplomai+β4Associatesi
+β5Experiencei+β6U rbani+β7Blacki+β8Hispanici+β9ASV ABi+εi
(12)
In equation 12, the primary variables of interest are the coefficients on educational at-tainment, β1, β2, β3, and β4. I have set the baseline level of educational attainment as a bachelor’s degree; this is unconventional, but is done to make coefficient estimates compara-ble across specifications, regardless of whether I account for grade repeating or not. Since the overall grade repeating rate is quite low for bachelor’s degree recipients (6.1%), the baseline return to education will be largely unaffected by accounting for grade repeating. If I had instead followed Cameron and Heckman (1993) and set high school dropouts as the base-line, the coefficient estimates on high school diplomas and bachelor’s degrees would appear biased, not the coefficient estimate on the GED. Here I follow the conventional potential labor market experience measure, Experience = Age −Ed Attainment−6, and correct for grade repeating by letting Experience = Age−Ed Attainment−Grade Reps−6.20
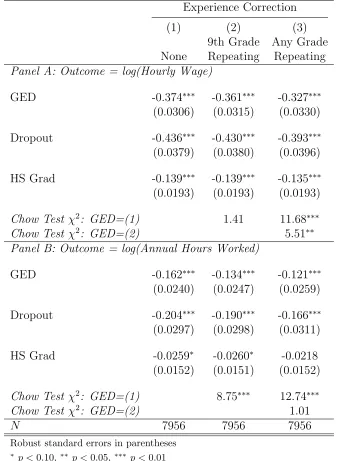
This regression only includes men, and has controls for urban status, race, and standardized ASVAB score. Table 9 presents results from this estimation, with wages and hours worked as outcomes.
20
Panel A of Table 9 shows the effects of educational attainment on hourly wages. Column (1) presents estimates with the conventional experience measure; high school graduates earn 14% less than college graduates, while GED recipients earn 37% less than college graduates – a GED recipient earns 27% less than a high school diploma recipient, similar to the earnings of a high school dropout. Column (2) shows the difference when only accounting for 9th grade repeating – the wage penalty from a GED is reduced by 1 percentage point, but a Chow test shows this difference is not significant. Column (3) shows the returns to a GED when properly accounting for all repeated grades. The GED is still far less valuable than a college degree and high school diploma, but the gap is smaller than in column (1). GED recipients earn 32.7% less than college graduates, while high school graduates still earn 14% less than college graduates; this makes the wage gap between GED recipients and high school graduates only 22.2%, not 27% as suggested in column (1). A similar bias is present for high school dropouts; estimates of the wage return to a GED are biased by 10.4% and estimates of the wage return to dropping out of high school are biased by 10.9% when failing to account for repeated grades. As a result, studies where the baseline educational attainment is chosen as less than a high school diploma overstate the wage returns to completing high school.
Panel B shows the effects of educational attainment on annual hours worked. Cameron and Heckman test annual hours worked to demonstrate that GED recipients are similar to high school dropouts in their labor supply decisions on the intensive margin (hours worked while employed).21 College graduates and high school graduates work similar hours; high
school graduates work only 2-3% fewer hours than college graduates in all 3 specifications. However, GED recipients work far fewer hours than college and high school graduates. Col-umn (1) shows a 16.2% labor supply gap between GED recipients and college graduates and
21
a 20.4% gap between high school dropouts and college graduates. This translates to a 14% gap between GED recipients and high school graduates and a 18.3% gap between high school dropouts and high school graduates. However, accounting for repeated grades changes these gaps substantially; accounting for 9th grade repeating reduces the labor supply gap for GED recipients by 21%, and accounting for any repeated grade reduces the hours gap by an addi-tional 10.7%. Overall, failure to account for repeated grades causes no bias in labor supply estimation for high school graduates, but causes 33.9% bias in labor supply estimation for GED recipients and 22.9% bias for high school dropouts. These findings suggest that while the bias caused by grade repeating in OLS estimation of the returns to education may be smaller than in IV estimation, it is still crucial to account for repeated grades in any estimate of the returns to education.
6.3
Age as an Alternative Experience Measure
My results on the black-white wage gap and the returns to the GED demonstrate that the conventional measure of potential labor market experience may bias estimates in the presence of grade repeating. However, the ideal solution of directly accounting for repeated grades in the construction of potential labor market experience is impossible in many datasets. The Census, ACS, CPS, and other data sources do not measure grade repeating, so an alternative measure of labor market experience is needed that is not affected by grade repeating.
I propose that researchers should simply control for age. Age is highly related to the conventional measure of potential labor market experience (as it is perfectly collinear with potential experience and educational attainment), but does not suffer from endogenous mea-surement error. As a result, it can serve as a proxy variable for labor market experience without being affected by repeated grades.
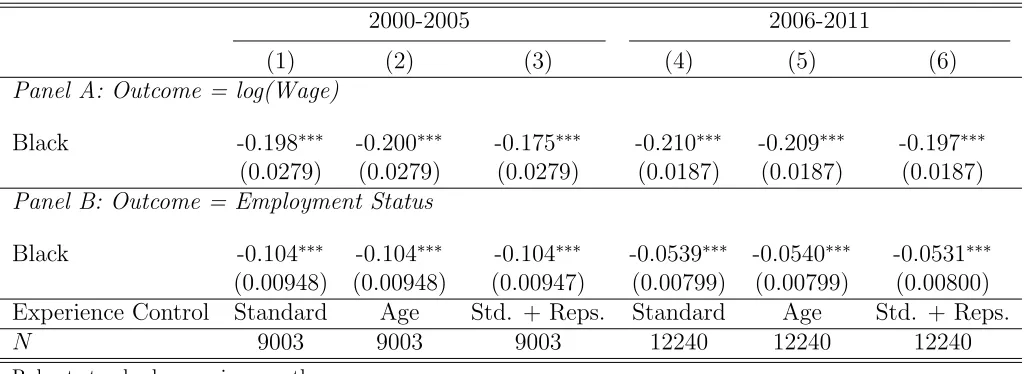
unknown by comparing my previous estimates to estimates controlling for age in lieu of a more conventional experience measure. Table 10 shows results from the black-white wage and employment gaps. Here, rather than using the experience measure in Bound and Free-man (1992), I useAge−Educational Attainment−6 andAge−Educational Attainment−
Repeated Grades−6.22 I compare these estimates to estimates when only controlling for age.
Columns (1) and (4) in Table 10 show the black-white wage and employment gaps us-ing the conventional experience measure, and columns (3) and (6) show the gaps correctus-ing for repeated grades. Columns (2) and (5) control for age instead of potential labor mar-ket experience. Controlling for age does not affect the estimate of the black-white wage or employment gaps, relative to the conventional experience measure. None of the experience measures cause statistically significant changes in the residual black-white wage gap esti-mate, although the 13 to 14% difference between the wage gap in column (3) compared to the gaps in columns (1) and (2) has economic significance. In estimation of the residual black-white wage and employment gaps, age is no worse as a control than potential labor market experience.
In Table 11, I test whether age reduces the bias in estimating the returns to the GED. Columns (1) and (3) of Table 11 are identical to columns (1) and (3) of Table 9, except for the pairwise test statistics. Column (2) shows results controlling for age instead of a conventional labor market experience measure. The wage return to the GED in Panel A is significantly greater when controlling for age than when controlling for the conventional labor market experience measure. Controlling for age results in a slightly greater estimate of the wage return to the GED than controlling for experience and repeated grades, but this different is not significant. Age improves the accuracy of the estimate of the wage return to the GED, compared to the conventional measure of potential experience. Panel B shows a
22
similar pattern to Panel A; controlling for age in estimating the labor supply gap between GED recipients and high school graduates results in extremely low bias (6%), while control-ling for potential labor market experience results in substantially greater bias (34%).
My findings suggest that researchers concerned about bias from repeated grades should, at minimum, test whether the use of age in lieu of labor market experience affects point estimates. When repeated grades cause small (e.g. white wage gaps) or no (e.g. black-white employment gaps) bias, the use of age as a control variable should not affect the estimate of interest. However, when repeated grades cause substantial bias (e.g. returns to GED), the use of age improves the accuracy of the estimate of interest, and should be the preferred proxy variable for labor market experience.
7
Conclusion
Repeated grades are an important, yet widely overlooked issue in the economics of edu-cation. The tripling of 9th grade repeating rates from the 1970s to the late 1990s is of critical importance to any researcher attempting to measure educational attainment or labor market experience, but a lack of detailed data on grade repeating has caused much of the contem-porary literature in labor economics to inadvertently introduce bias into their estimates. Compulsory schooling instruments in particular have become less valid for individuals born in the past 40 years. Efforts need to be made to circumvent their endogeneity with 9th grade repeating. IV estimation of the returns to schooling can cause bias of at least 38% when failing to account for the simultaneous effects of CSLs and/or quarter of birth on 9th grade retention.
Similarly, a modification of the common experience measure, Experience = Age −
endoge-nous measurement error into related estimates. Failing to correctly measure potential labor market experience causes 13% bias in the black-white wage gap for young workers, 10-11% bias in the wage return to a GED or dropping out of high school, and 23-34% bias in the labor supply gap for GED recipients and high school dropouts. All in all, these findings sug-gest that solving this measurement error problem is crucial for future work, as any research investigating people who finished their schooling in the 1980s, 1990s, or 2000s is subject to this repeated grades problem.
Applied researchers must be cognizant of this measurement error problem and modify their measure of experience to avoid bias. When using longitudinal data, such as the PSID or NLSY, the solution is simple – grade repeating can be explicitly accounted for in the measure of labor market experience and can be controlled for in the primary regression model. However, when using cross-sectional data, the solution is more complicated. Age is likely a better proxy for labor market experience than the conventional measure of Age−
References
Elementary/Secondary Information System. U.S. Department of Education. Institute of Education Sciences, National Center for Education Statistics.
Historical Tables & Reports: Elementary and Secondary Enrollment. U.S. Department of Education. Institute of Education Sciences, National Center for Education Statistics.
Statistical Reports: Grade Retention. Massachusetts Department of Elementary & Secondary Education, Information Services.
Acemoglu, D. and Angrist, J. (2000). How Large are Human-Capital Externalities? Evidence from Compulsory Schooling Laws. NBER macroeconomics annual, 15:9–59.
Allensworth, E. M. and Easton, J. Q. (2005). The On-Track Indicator as a Predictor of High School Graduation. Consortium on Chicago School Research, University of Chicago Chicago, IL.
Angrist, J. D. and Krueger, A. B. (1991). Does Compulsory School Attendance Affect Schooling and Earnings? The Quarterly Journal of Economics, 106(4):979–1014.
Aragon, S. (2015). Free and Compulsory School Age Requirements. The Education Com-mission of the States.
Bound, J. and Freeman, R. B. (1992). What Went Wrong? The Erosion of Relative Earn-ings and Employment Among Young Black Men in the 1980s. The Quarterly Journal of Economics, 107(1):201–232.
Bureau of Labor Statistics, U.S. Department of Labor. National Longitudinal Survey of Youth 1997 cohort, 1997-2013 (rounds 1-16). Produced by the National Opinion Research Center, the University of Chicago and distributed by the Center for Human Resource Research, The Ohio State University. Columbus, OH: 2015.
Bureau of Labor Statistics, U.S. Department of Labor, and National Institute for Child Health and Human Development. Children of the NLSY79, 1979-2014. Produced and dis-tributed by the Center for Human Resourse Research, The Ohio State University. Colum-bus, OH: 2015.
Cameron, A. C., Gelbach, J. B., and Miller, D. L. (2011). Robust Inference with Multiway Clustering. Journal of Business & Economic Statistics, 29(2):238–249.
Cameron, S. V. and Heckman, J. J. (1993). The Nonequivalence of High School Equivalents.
Journal of labor economics, 11(1, Part 1):1–47.
Eckstein, Z. and Wolpin, K. I. (1989). Dynamic Labour Force Participation of Married Women and Endogenous Work Experience. The Review of Economic Studies, 56(3):375– 390.
Haney, W., Madaus, G., Abrams, L., Wheelock, A., Miao, J., Gruia, I., and Gruia, I. (2004). The Education Pipeline in the United States, 1970-2000.
Hauser, R. M., Frederick, C. B., and Andrew, M. (2007). Grade Retention in the Age of Standards-Based Reform. Center for Demography and Ecology, University of Wisconsin.
Heubert, J. P. and Hauser, R. M. (1998). High Stakes: Testing for Tracking, Promotion, and Graduation. National Research Council Committee on Appropriate Test Use, National Academies Press.
Kena, G., Hussar, W., McFarland, J., de Brey, C., Musu-Gillette, L., Wang, X., Zhang, J., Rathbun, A., Wilkinson-Flicker, S., Diliberti, M., et al. (2016). The Condition of Education 2016. NCES 2016-144. National Center for Education Statistics.
Kreitzer, A. E., Madaus, G. F., and Haney, W. (1989). Competency Testing and Dropouts.
Lochner, L. and Moretti, E. (2004). The Effect of Education on Crime: Evidence from Prison Inmates, Arrests, and Self-Reports. The American Economic Review, 94(1):155–189.
Mackey, P. E. and Duncan, T. G. (2013). Does Raising the State Compulsory School Atten-dance Age Achieve the Intended Outcomes.
Oreopoulos, P. (2006). Estimating Average and Local Average Treatment Effects of Educa-tion when Compulsory Schooling Laws Really Matter. The American Economic Review, 96(1):152–175.
Oreopoulos, P. (2007a). Do Dropouts Drop Out Too Soon? Wealth, Health and Happiness from Compulsory Schooling. Journal of public Economics, 91(11):2213–2229.
Oreopoulos, P. (2007b). Would More Compulsory Schooling Help Disadvantaged Youth? Evidence from Recent Changes to School-Leaving Laws. InThe problems of disadvantaged youth: An economic perspective, pages 85–112. University of Chicago Press.
Planty, M., Hussar, W. J., and Snyder, T. D. (2009). Condition of Education 2009. Govern-ment Printing Office.
Sable, J., Gaviola, N., and Hoffman, L. (2007). Numbers and Rates of Public High School Dropouts: School Year 2004-05. First Look (NCES 2008-305). National Center for Edu-cation Statistics.
Table 1: Summary Statistics
(1) (2) (3) (4)
Panel A: Enrollment Changes and Repeating Rates
Mean St. Dev. Min Max % Change 7th - 8th -0.957 2.629 -23.54 25.31 % Change 8th - 9th 6.427 6.797 -16.35 47.10 % Change 9th - 10th -6.075 5.377 -38.16 19.00 % Change 10th - 11th -8.123 4.439 -28.75 19.79 % Change 11th - 12th -6.927 4.473 -27.53 18.48 CPS 9th Grade Rep. Rate (%) 3.651 6.882 0 100 Heubert and Hauser (1998) Repeating Rate 11.648 4.359 2.6 21.0 MA 1995-2012 Repeating Rate 7.533 0.747 5.7 8.5
Panel B: CNLSY
Mean St. Dev. Min Max Educational Attainment 12.348 1.910 8 20
Black 0.341 0.474 0 1
Female 0.559 0.497 0 1
Hispanic 0.204 0.403 0 1 9th Grade Repeaters 0.051 0.219 0 1 Compulsory Attendance (Years) 10.946 1.248 9 12
Age 23.204 4.196 15 42
Table 1: (Continued)
(1) (2) (3) (4)
Panel C: NLSY97
Mean St. Dev. Min Max
GED 0.118 0.322 0 1
HS Diploma 0.466 0.499 0 1 HS Dropout (no GED) 0.0725 0.259 0 1 Associate’s Degree 0.0960 0.295 0 1 Bachelor’s Degree 0.248 0.432 0 1 9th Grade Repeats 0.0499 0.264 0 4 Any Grade Repeats 0.376 0.717 0 6 Urban Status 0.773 0.419 0 1
Black 0.211 0.408 0 1
Hispanic 0.195 0.396 0 1
Female 0.491 0.500 0 1
Age 23.02 5.549 14 34
Panel D: Minimum Dropout Age Frequency
Freq.
14 0.612
15 0.163
16 62.24
17 16.20
18 20.78
Notes: Enrollment changes in Panel A include all states and years from the 1965-66 academic year to the 2013-14
[image:38.612.77.505.107.431.2]Table 2: Pairwise Correlations, Repeating Rate Estimates
(1) (2) (3) % Change % Change
8th-9th 9th-10th CPS NRC & MA Rep. Rates 0.262 -0.392 0.084
p−value, ρ= 0 0.0143 0.0002 0.4873
Notes: P-values are shown forH0:ρ= 0. The CPS correlation in column (3) has 24 fewer observations, due to the existence
Table 3: Repeating Rate Estimates and True Repeating Rates
NRC & MA Repeating Rates (1) (2) (3) (4) 9th-10th −0.877∗∗ −0.635∗∗
(0.0528) (0.156)
8th-9th 0.889∗ 0.214∗∗∗
(0.0662) (0.152)
CPS 1.31∗ 0.0166∗∗∗
(0.174) (0.164)
N 97 97 73 73
R2 0.74 0.65 0.44 0.79
∗ p <0.10,∗∗ p <0.05, ∗∗∗ p <0.01
Notes: Significance stars testH0:β= 1 orH0:β=−1 for the appropriate estimate. The CPS regressions in columns (3) and
Table 4: CSL Effects on 9th Grade Retention
8th-9th Change 9th-10th Change
(1) (2) (3) (4) (5) (6) (7) (8)
Dropout Age 2.707∗∗∗ 0.361∗∗ 2.844∗∗∗ 0.744∗∗∗ -1.835∗∗∗ 0.451∗∗∗ -1.927∗∗∗ -0.696∗∗∗
(0.202) (0.158) (0.207) (0.203) (0.144) (0.127) (0.146) (0.141)
State FE Y Y Y Y
Year FE Y Y Y Y
Observations 2352 2352 2352 2352 2352 2352 2352 2352
Robust standard errors in parentheses
∗ p <0.10,∗∗ p <0.05,∗∗∗ p <0.01
Notes: Data on enrollment changes are from the NCES Annual Reports Program Historical Tables and CCD. All specifications
Table 5: CSL Effects on Non-9th Grade Promotion
(1) (2) (3) % Change % Change % Change
7th - 8th 10th - 11th 11th - 12th Dropout Age 0.0987 0.0717 0.0898
(0.0863) (0.107) (0.110) Observations 2352 2352 2352 Robust standard errors in parentheses
∗ p <0.10,∗∗ p <0.05,∗∗∗ p <0.01
Notes: Data on enrollment changes are from the NCES Annual Reports Program Historical Tables and CCD. All specifications
Table 6: Compulsory Schooling Instruments with 9th Grade Repeating
Outcome = log(hourly wage)
No Repeat Control With Repeat Control OLS 2SLS OLS 2SLS (1) (2) (3) (4)
Panel A: Compulsory Schooling Law Instruments
Ed. Attainment 0.0595∗∗∗ 0.130∗∗ 0.0594∗∗∗ 0.120∗
(0.00212) (0.0535) (0.00217) (0.0720)
9th Repeater -0.00558 -0.0599 (0.0160) (0.339)
K-P F-statistic [3.414] [1.584]
Panel B: Quarter×Year of Birth Instruments
Ed. Attainment 0.0640∗∗∗ 0.116∗∗∗ 0.0646∗∗∗ 0.0841∗∗∗
(0.00211) (0.00704) (0.00215) (0.00888)
9th Repeater 0.0328∗∗ 1.009∗∗∗
(0.0155) (0.165)
K-P F-statistic [37.875] [2.773]
Panel C: Quarter×Year of Birth and CSL Instruments
Ed. Attainment 0.0640∗∗∗ 0.115∗∗∗ 0.0646∗∗∗ 0.0935∗∗∗
(0.00211) (0.00695) (0.00215) (0.00789)
9th Repeater 0.0328∗∗ 0.793∗∗∗
(0.0155) (0.131)
K-P F-statistic [36.986] [2.898]
Observations 7511 7511 7511 7511 Robust errors in parentheses
∗ p <0.10,∗∗ p <0.05,∗∗∗ p <0.01
Notes: Data source is the CNLSY. All regressions include controls for sex, race, and state of residence at age 16. Estimates
Table 7: Black-White Wage and Employment Gaps, Corrected for Repeating
2000-2005 2006-2011 (1) (2) (3) (4)
Panel A: Outcome = log(Wage)
Black -0.208∗∗∗ -0.184∗∗∗ -0.214∗∗∗ -0.201∗∗∗
(0.0281) (0.0282) (0.0181) (0.0181)
Panel B: Outcome = Employment Status
Black -0.0921∗∗∗ -0.0929∗∗∗ -0.0627∗∗∗ -0.0618∗∗∗
(0.00978) (0.00976) (0.00769) (0.00769) Account for
Repeating N Y N Y
N 8463 8463 13229 13229 Robust standard errors in parentheses
∗ p <0.10,∗∗ p <0.05,∗∗∗ p <0.01
Notes: Data source is the NLSY97. All regressions include controls for educational attainment and urban status. Experience in
Table 8: Grade Repeating Rates by Educational Attainment
Repeating Rates in NLSY97 (%)
Dropouts GED HS Grads Associate’s Bachelor’s 9th Grade 16.4 18.4 1.3 1.5 <1 All Grades 72.6 73.6 21.1 16.8 6.1
Notes: Grade repeating rates by educational attainment are shown. Many individuals repeated multiple grades in their
Table 9: Wage and Labor Supply Returns to GED and HS Diploma, Corrected for Repeating
Experience Correction (1) (2) (3)
9th Grade Any Grade None Repeating Repeating
Panel A: Outcome = log(Hourly Wage)
GED -0.374∗∗∗ -0.361∗∗∗ -0.327∗∗∗
(0.0306) (0.0315) (0.0330)
Dropout -0.436∗∗∗ -0.430∗∗∗ -0.393∗∗∗
(0.0379) (0.0380) (0.0396)
HS Grad -0.139∗∗∗ -0.139∗∗∗ -0.135∗∗∗
(0.0193) (0.0193) (0.0193)
Chow Test χ2: GED=(1) 1.41 11.68∗∗∗ Chow Test χ2: GED=(2) 5.51∗∗ Panel B: Outcome = log(Annual Hours Worked)
GED -0.162∗∗∗ -0.134∗∗∗ -0.121∗∗∗
(0.0240) (0.0247) (0.0259)
Dropout -0.204∗∗∗ -0.190∗∗∗ -0.166∗∗∗
(0.0297) (0.0298) (0.0311)
HS Grad -0.0259∗ -0.0260∗ -0.0218
(0.0152) (0.0151) (0.0152)
Chow Test χ2: GED=(1) 8.75∗∗∗ 12.74∗∗∗
Chow Test χ2: GED=(2) 1.01
N 7956 7956 7956
Robust standard errors in parentheses
∗p <0.10,∗∗ p <0.05,∗∗∗ p <0.01
Notes: Baseline educational attainment is a college diploma, as repeating rates are lowest (6%) for college graduates – this
Table 10: Black-White Wage and Employment Gaps, Experience and Age
2000-2005 2006-2011
(1) (2) (3) (4) (5) (6)
Panel A: Outcome = log(Wage)
Black -0.198∗∗∗ -0.200∗∗∗ -0.175∗∗∗ -0.210∗∗∗ -0.209∗∗∗ -0.197∗∗∗
(0.0279) (0.0279) (0.0279) (0.0187) (0.0187) (0.0187)
Panel B: Outcome = Employment Status
Black -0.104∗∗∗ -0.104∗∗∗ -0.104∗∗∗ -0.0539∗∗∗ -0.0540∗∗∗ -0.0531∗∗∗
(0.00948) (0.00948) (0.00947) (0.00799) (0.00799) (0.00800) Experience Control Standard Age Std. + Reps. Standard Age Std. + Reps.
N 9003 9003 9003 12240 12240 12240 Robust standard errors in parentheses
∗ p <0.10,∗∗ p <0.05,∗∗∗ p <0.01
Notes: Data source is the NLSY97. All regressions include controls for educational attainment and urban status. Experience
Table 11: Wage and Labor Supply Returns to GED and HS Diploma, Experience and Age
Experience Control (1) (2) (3)
Standard Standard Age + Reps.
Panel A: Outcome = log(Hourly Wage)
GED -0.374∗∗∗ -0.300∗∗∗ -0.327∗∗∗
(0.0306) (0.0285) (0.0330)
Dropout -0.436∗∗∗ -0.349∗∗∗ -0.393∗∗∗
(0.0379) (0.0357) (0.0396)
HS Grad -0.139∗∗∗ -0.140∗∗∗ -0.135∗∗∗
(0.0193) (0.0193) (0.0193)
Chow Test χ2: GED=(1) 44.00∗∗∗ 11.68∗∗∗
Chow Test χ2: GED=(2) 2.37
Panel B: Outcome = log(Annual Hours Worked)
GED -0.162∗∗∗ -0.128∗∗∗ -0.121∗∗∗
(0.0240) (0.0224) (0.0259)
Dropout -0.204∗∗∗ -0.164∗∗∗ -0.166∗∗∗
(0.0297) (0.0281) (0.0311)
HS Grad -0.0259∗ -0.0263∗ -0.0218
(0.0152) (0.0151) (0.0152)
Chow Test χ2: GED=(1) 14.24∗∗∗ 12.74∗∗∗
Chow Test χ2: GED=(2) 0.22
N 7956 7956 7956
Robust standard errors in parentheses
∗ p <0.10,∗∗ p <0.05,∗∗∗ p <0.01
Notes: Baseline educational attainment is a college diploma, as repeating rates are lowest (6%) for college graduates – this
Figure 1: US Total Enrollment by Grade, 1977 & 2014 Graduation Cohorts
(a) 1977 Graduation Cohort
(b) 2014 Graduation Cohort
Notes: Enrollment data are from the NCES Annual Reports Historical Tables (a) and the NCES Common Core of Data (b).
Figure 2: 9th Grade Repeating Rate Changes, 1965-2014
Notes: Enrollment data are from the NCES Annual Reports Historical Tables (1965-2003) and the NCES Common Core of
Figure 3: Minimum Dropout Age, 1965-2014
Notes: Average minimum dropout age, weighted by state high school enrollment (9th-12th grades) is shown from 1965-2014.