Munich Personal RePEc Archive
‘Waste culture’ assessment using
Hofstede’s and Schwartz’s cultural
dimensions – an EU case study
Halkos, George and Petrou, Kleoniki Natalia
Department of Economics, University of Thessaly
December 2018
‘Waste culture’ assessment using Hofstede’s and
Schwartz’s cultural dimensions – an EU case study
George Halkos* and Kleoniki Natalia Petrou
Laboratory of Operations Research,
Department of Economics, University of Thessaly
Abstract
The issue of municipal solid waste (MSW) arisings has received great attention recently as it is a by-product of economic activity but also serves as an input to the economy through material or energy recovery. In relation to that, the main focus of this study is cultural formation and especially the current picture of waste culture and public perception across European Union (EU) Member States. Thus this study will first evaluate environmental efficiency with Data Envelopment Analysis (DEA) based on five parameters: waste, gross domestic product (GDP), labour, capital, and population density for 22 EU Member States and for the years 2005, 2010 and 2015 in order to evaluate which Member States are more efficient. Then the results from the efficiency analysis are contrasted to Hofstede’s and Schwartz’s cultural dimensions on STATA with the use of regression modelling. Results show that for year 2005 no significant relationship is noticed between the efficiency scores and the cultural dimensions’ data from both researchers, whereas for years 2010 and 2015 there appears to be a significant connection with changes in the predictors also affecting the response variable. The above mentioned findings can be associated with the financial crisis that has hit Europe after 2008 making people more skeptical on environmental issues and how waste is best to be managed making sense financially but also environmentally. At the same time EU legislations have laid out some important Directives in the field of waste management. Finally, along with the factors above, EU has faced severe environmental challenges due to waste arisings, as well as accidents and injuries for people working in this sector which in turn have widely modified EU’s waste culture as supported by this study’s results.
Keywords: Environmental efficiency; waste culture; Hofstede; Schwartz; DEA;
environmental policy; regression analysis; cultural dimensions.
JEL Codes: O44; Q53; Q56; Z1
Acknowledgement
1. Introduction
The issue of municipal solid waste (MSW) arisings has received great attention
recently as it is a by-product of economic activity but also serves as an input to the economy
through material or energy recovery (Defra, 2011). Increasing population, urbanisation and
changing lifestyle patterns have affected MSW production (Aini et al., 2002). About 600
million tons of MSW are produced per year, meaning a daily production of 1.6 kg per capita
in the countries of the Organization for Economic Cooperation and Development (OECD)
(De Feo and Napoli, 2005).
The main issue with waste generation nowadays is that although the legislations are in
place in order to help get resources back, these tend to be overlooked as not much importance
is given to the protection of the environment despite the financial contribution it may have. In
those regards, the word “waste” can either be seen as a noun or a verb, whereas the noun
“waste” attributes the fault to the item itself, the verb “to waste” attributes the fault to the
party who neglects to appreciate the value of the item (Lee, 2017).
Arguments prioritising culture as a prominent development factor exist for many
years now, namely in 1905 Max Weber was the first one to raise awareness on the
importance of a set of values to explain the success of industrial capitalism vis-a-vis
pre-capitalist agrarian societies across Europe (El Leithy, 2017). The main focus of the present
study is cultural formation and especially the current picture of ‘waste culture’ and public
perception across European Union (EU) member states. At this point it is essential to make
the distinction between culture and society.
Culture is defined as the way of life, especially the general customs and beliefs, of a
particular group of people at a particular time based on the Cambridge Dictionary. Cultural
values are shared and constitute the broad goals that members of a society are encouraged to
programming of the mind which distinguishes the members of one human group from
another’. Society on the other hand is a group of people sharing a common culture and social
system (Parsons, 1951).
There are three sources of influence in those regards: the value culture in the
surrounding society, the personal value priorities of organisational members and the nature of
the organisation’s primary tasks (Sagiv and Schwartz, 2007). Hence it stands to reason that
people’s perceptions, beliefs and values regarding the environment will be different among
countries based on national culture characteristics which will result to different levels of
countries’ environmental performance as well (Hofstede et al., 2010). In relation to that there
are different environmental policies which are reflected on their environmental performance
levels (Halkos and Tzeremes, 2013a).
Thus this study will first evaluate environmental efficiency based on five parameters:
waste, gross domestic product (GDP), labour, capital, and population density for 22 EU
Member States and for the years 2005, 2010 and 2015. These parameters have been chosen as
they are related to MSW arisings and their relevant efficiency. Then the results from the
efficiency analysis through Data Envelopment Analysis (DEA) are contrasted to Hofstede’s
and Schwartz’s cultural dimensions as the aim of this study is to define the waste culture
across the selected EU member states. This study’s contribution is that by following and
building on previous other studies, it helps develop an improved resource and environmental
efficiency evaluation approach regarding EU member states’ ‘waste culture’.
The structure of the paper is as follows. Section 2 reviews the main models that
provide the cultural dimension indicators while section 3 presents the proposed methodology
together with the data used and the environmental production frameworks applied in the
analysis. Section 4 presents the empirical findings with section 5 discussing the results and
2. Background
Many studies of cultural values have focused extensively on nations. These include
but are not limited to the following: 1. Hofstede’s dimensions of national cultures, 2.
Trompenaars’ and Hampden-Turner’s cultural factors, 3. Schwartz’s cultural values, 4.
Inglehart’s World Values Survey, 5. GLOBE’S (Global Leadership and Organizational
Behavior Effectiveness) cultural dimensions and 6. Lewis Model. As the empirical analysis
of this paper will focus on cultural dimensions’ data from the Hofstede and Schwartz models,
these will be analysed in greater detail below. Furthermore a comparison between these two
models is presented and a description of ‘waste culture’ and what this includes.
2.1 Hofstede’s cultural dimensions
Hofstede's cultural dimensions’ theory is a framework for cross-cultural
communication, developed by Geert Hofstede. Hofstede (1980) conducted an employee
attitude survey from 1967 to 1973 within IBM’s subsidiaries in 66 countries. The responses
comprise of 117,000 questionnaires trying to investigate the respondents' ‘values’, which he
defines as ‘broad tendencies to prefer certain states of affairs over others’ and which are
according to him the ‘core element in culture’ (Hofstede, 1980; Halkos and Tzeremes,
2013b). Then he statistically analysed the collected data and constructed four national
cultural indexes and found that there are four central and ‘largely independent’ (Hofstede,
1983) dimensions of a national culture. Then he gave a comparative score on each of these
dimensions.
As mentioned the original theory proposed four dimensions along which cultural
values could be analysed: individualism-collectivism; uncertainty avoidance; power distance
(strength of social hierarchy) and masculinity-femininity (task orientation versus
conducted in Hong Kong, long-term orientation, this would then cover aspects of values not
included in the original paradigm, then in 2010, Hofstede added a sixth dimension,
indulgence versus self-restraint.
Even though Hofstede’s work has been widely criticised, the size of the sample and
the dimensions’ stability over time have provided credibility and reliability (Hofstede, 2001;
Kogut and Singh, 1988). His theory has been widely used in several fields as a paradigm for
research, particularly in cultural psychology, international management and
cross-cultural communication. It continues to be a major resource in cross-cross-cultural fields and has
inspired a number of other major cross-cultural studies of values, as well as research on other
aspects of culture, such as social beliefs (Halkos and Tzeremes, 2010).
A lot of criticism has been done on the empirical validity of Hofstede’s framework
(Shackleton and Ali, 1990; Sondergaard, 1994; Triandis, 1982; Yoo and Donthu, 1998).
Based on the generalisation of the research findings the main disadvantage presented is the
fact that the sample used, only focused on one large multinational company (Triandis, 1982;
Yoo and Donthu, 1998). Furthermore Yoo and Donthu (1998) suggest that the dimensions of
national culture could only refer to that period of study. Despite this criticism Hofstede’s
framework is generally accepted as the most inclusive framework of national cultural values
(Kogut and Singh, 1988; Sondergaard, 1994; Yoo and Donthu, 1998). Thus it is of great
value and shows significant correlations with economic, social and geographic indicators
(Kogut and Singh, 1988). Furthermore, Hofstede’s dimensions of national culture have been
found to be valid, reliable and stable over time (Bond, 1988; Kogut and Singh, 1988; Yoo
2.2 Schwartz’s cultural dimensions
Schwartz (1994) was actually one of those researchers who has raised several serious
concerns regarding Hofstede’s cultural dimensions. First, he suggests that Hofstede’s
dimensions are not thorough enough as the original survey’s goal was not to analyse
societies’ cultures and thus may not show the complete picture. Secondly Hofstede’s sample
of countries is not a complete reflection of national cultures and if more were added to the
sample results could have been different. Finally as the sample was drawn from IBM
employees it is not representative of the population of the relevant country in terms of
education and background for instance.
According to Schwartz (1999) cultural dimensions need to be analysed and clarified
in order to understand the value people place on them. Many scholars support Schwartz’s
opinion and approach, but for instance Steenkamp (2001) although recognising the value of
Schwartz’s model, he still doesn’t give up on using Hofstede’s model as it is not fully tested
like Hofstede’s one.
Schwartz (1992) created a comprehensive set of 56 individual values recognised
across cultures, thus covering all value dimensions. He also examined the relevant meaning
of these values across different countries and reduced them to 45. Following that he surveyed
school teachers and college students from 67 countries as of 1988, averaged the scores on
each of the 45 value items for each country, and used smallest-space analysis to find out if
these values differ in the various countries (Drogendijka and Slangen, 2006). This procedure
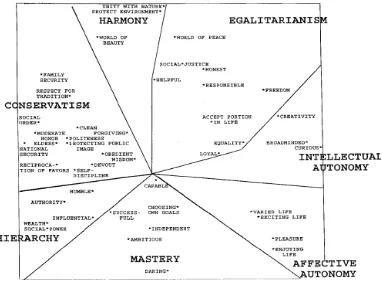
concluded with the creation of seven dimensions, namely ‘conservatism’, ‘intellectual
autonomy’, ‘affective autonomy’, ‘hierarchy’, ‘egalitarian commitment’, ‘mastery’, and
‘harmony’ (Schwartz, 1994, 1999). As explained by Schwartz (1999), certain pairs of cultural
orientations yield the following coherent circular order of orientations: embeddedness,
hierarchy, mastery, autonomy, egalitarianism, harmony and return to embeddedness.
[image:8.595.123.505.161.444.2]Schwartz’s cultural values are presented in Figure 1.
Figure 1: Schwartz’s cultural values (Schwartz, 1994)
2.3 Comparison of the two models
These two models have been widely discussed in academic literature and both have
been criticised as well. He also suggested that his framework included Hofstede’s dimensions
either way. Both Hofstede (1980) and Schwartz (1994) identified national cultural
dimensions that could be used to compare cultures. Hofstede prepared his framework
empirically, while Schwartz developed his theoretically while both scholars empirically
examining their frameworks using large-scale multi-country samples and finding greater
cultural differences between countries than within countries, suggesting the frameworks
Brett and Okumura (1998) believe that Schwartz’s framework is superior to
Hofstede’s because it is based on a conceptualisation of values, it was developed with
systematic sampling and analysis techniques and its data are more recent. In addition to that
the strong theoretical foundations of Schwartz’s model are stressed by Steenkamp (2001),
although he raises some concerns with regards to its few empirical applications.
2.4 Cultural dimensions and waste – ‘waste culture’ formation
Culture maintains a balance between humans, society and the physical environment
and provides the context within which human activities take place (Roberts and Okereke,
2017). It is essential to integrate culture within the sustainability programmes as culture can
greatly impact most societal functions, including waste management (Schneider, 1972).
Many studies suggest that cultural values mainly influence the formation of green purchase
intentions (Chekima et al., 2016). Therefore, the above mentioned cultural dimensions can
serve as a valuable tool to analyse and evaluate the public’s approach towards certain societal
issues and in this case towards waste arisings in order to get the complete picture of the waste
culture across these 22 EU Member States. Waste could be considered as the final product of
a specific production chain: wealth, consumption, waste (De Feo and De Gisi, 2010). ‘Waste
culture’ can be examined through various perspectives such as moral, philosophical, societal
etc., but what is important to note is that waste is everywhere and it is essential to understand
our mentality towards it (Lee, 2017). What is generally noticed is that in today’s fast moving
consumer – especially western – societies an unsustainable convenience culture has been
formed (Hall, 2017).
What is more this convenience culture is mainly output-oriented and brings with it
waste arisings from all production processes (Lee, 2017). To overcome this culture of waste it
production process one would start with the resources available, appreciate them and work
forward to use them most effectively to generate value (Lee, 2017).
An important part of ‘waste culture’ formation also has to do with the availability of
environmental information and the use of information as a policy tool. Thus this information
will increase environmental awareness and concern leading to more sustainable consumption
practices (Aini et al., 2002). Information also has the potential to persuade and create positive
attitudes towards for instance the recycling system among the public (Petty and Cacioppo,
1986; Bator and Cialdini, 2000). Moreover environmental psychologists stress the fact that
personal norms serve as moral obligations in environmental behaviour, which may be
internalised social norms or norms deriving from higher order values (Schwartz, 1977;
Hopper and Nielsen, 1991; Bratt, 1999).
3. Research method, data and production frameworks for the analysis
3.1 The proposed methodology
3.1.1 Data Envelopment Analysis
Environmental efficiency has been gaining a lot of attention and has both theoretical
value and practical meaning (Song et al., 2012). With the help of DEA one can measure the
efficiency performances of comparable Decision Making Units (DMUs) which have multiple
inputs and likewise outputs in conditions where there is accurate information on their values
and no knowledge about the production or cost function (Rogge and De Jaeger, 2012). DEA
was initially designed to be used in microeconomic research, but can equally be used in
macroeconomic analysis too (Honma and Hu, 2009). DEA is s a non-parametric approach
applied to assess the efficiency of the DMUs into consideration with the use of linear
programming techniques (Boussofiane et al., 1991). It compares each DMU with all others
scenarios (Sherman and Zhu, 2006). One important benefit of DEA is that one does not need
to make any assumptions regarding the relationship between inputs and outputs (Seiford and
Thrall, 1990). DEA models are either input-oriented minimizing inputs while at least
achieving the given output levels or output-oriented models maximizing outputs without
requiring more inputs.
Farrell’s (1957) input measure operationalization of efficiency for multiple inputs /outputs
assuming free disposability and convexity of the production set was introduced via linear
programming estimators by Charnes et al. (1978). Therefore for a given DMU operating at a
point it can be defined as:
,
1 1 1 1ˆ , ; ,for ,...,
s.t. 1; 0, 1,..., .
n n
p q
DEA i i i i n
i i
n
i i i
x y R y Y x X
i n
Simar and Wilson (1998, 2000, 2008) stress that DEA estimators are shown to be
biased by construction, thus developed an approach based on bootstrap techniques to correct
and estimate the bias of the DEA efficiency indicators. Bootstrap is based on the idea of
simulating the data generating process (DGP) and applying the original estimator to copy the
sampling distribution of the original estimator (Efron, 1979). Moreover bootstrap procedures
produce confidence limits on the efficiencies of the units in order to capture the true efficient
frontier within the specified interval (Dyson and Shale, 2010). Then the bootstrap bias
estimate for the original DEA estimator θ DEA (x, y) can be calculated as:
The biased corrected estimator of (x, y) can be calculated as:
Finally, the (1−α) x 100 - percent bootstrap confidence intervals can be obtained for θ(x, y)
as:
Furthermore, in DEA it is required to specify whether the use of constant returns to
scale (CRS) or variable returns to scale (VRS) is more appropriate. Charnes et al. (1978)
were the first to propose the measurement of DMUs’ efficiency under constant returns to
scale (CRS), provided that all DMUs operate at their optimal level. Then Banker et al. (1984)
employed VRS in their model, thus accounting for the use of technical and scale efficiencies
in DEA. To test this approach and following Simar and Wilson (1998) bootstrap approach we
compare between CRS and VRS according to these hypotheses: Ho : Ψθ is globally CRS
against H1 :Ψθ is VRS. The test statistic mean of the ratios of the efficiency scores is then
provided by:
Then the p-value of the null-hypothesis can be obtained:
where Tobs is the value of T computed on the original observed sample Xn and B is the
number of bootstrap reputations. Then the p-value can be approximated by the proportion of
Following the results from the tests described in the above equations the paper
identifies that for the problem in hand the Charnes et al. model which allows constant returns
to scale is more appropriate as the results obtained are higher than 0.05 thus accepting the
null hypothesis (B = 999). In more details in this application there are two models as shown
in table 1.
Table 1: Results on testing CRS vs VRS in this study’s three models for all examined years
Frameworks 2005 2010 2015
M1 0.2442 0.1051 0.4124
M2 0.7157 0.4164 0.8418
In terms of methodology, the bad output (pollutant) in question, MSW generation, is
modelled as a regular bad output by applying the transformation introduced by Seiford and
Zhu (2002, 2005). In the two proposed models, different inputs are taken into account and
MSW (bad output) and GDP (good output) form the two outputs examined.
For all 22 countries in the DEA analysis a radial model was used, which is output
oriented and under CRS as mentioned above. The above described frameworks of
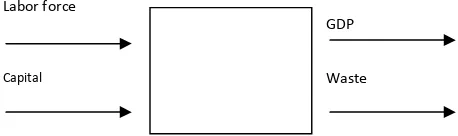
inputs/outputs are presented in Figures 2 and 3.
M1: inputs – labour, capital Outputs – GDP, waste
[image:13.595.87.316.585.653.2]
Figure 2: Description of environmental production framework (M1 indicator)
Labor force
Capital
GDP
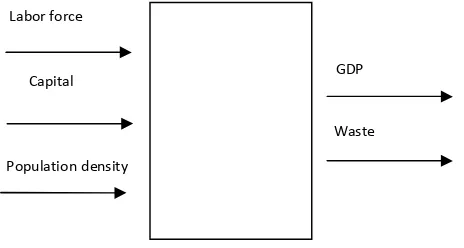
M2: inputs – capital, labor, population density Outputs – GDP, waste
Figure 3: Description of environmental production framework (M2 indicator)
3.1.2 Regression analysis
The efficiency scores obtained through the DEA analysis as described above have
then been analysed in comparison to Hofstede’s and Schwartz’s cultural dimensions. This has
been done on STATA with the use of multiple regression models. Multiple regression is used
to predict the value of a dependent variable based on the value of two or more independent
variables. Therefore, regression analysis is a mathematical and statistical tool used to sort out
which of the independent variables in question do have an impact on the dependent variable
(Gallo, 2015). The regression model that is formed is as follows:
y(efficiency scores) = f (cultural indexes)
Various assumptions need to be accounted for before using linear regression models
(Halkos 2006, 2011; Nau, 2018):
a. Linearity and additivity of the relationship between the variables: (1) the expected value
of the dependent variable is a straight-line function of each independent variable, (2) the
slope of that line does not depend on the values of the other variables and (3) the effects
of different independent variables on the expected value of the dependent variable are
additive.
Labor force
Capital GDP
Population density
generation
b. Statistical independence of the errors (in particular, no correlation between consecutive
errors in the case of time series data)
c. Homoscedasticity (constant variance) of the errors: (1) versus time (in the case of time
series data), (2) versus the predictions, (3) versus any independent variable and
d. Normality of the error distribution.
In the presentation of the results and for simplicity we will refer to just some of the
main outputs provided in the regression output like the coefficient of determination (R2)
showing the proportion of the variance in the dependent variable explained by the
independent variables, though without reflecting the extent to which any particular
independent variable is associated with the dependent variable; the F statistic and its P-value
referring the overall statistical significance of each model and the individual significance as
indicated by the t statistic: and the associated P-value (Halkos 2006, 2011; The Trustees of
Princeton University, 2007):
3.2 Data used
In this DEA application the following variables are used: waste, GDP, labour, capital,
population density with data obtained from Eurostat1. In total 22 EU Member States are
studied for the years 2005, 2010 and 2015. The parameters are counted in the following units
for this analysis:
Waste: waste generated by households (tonnes)
GDP: current prices (million €)
Labour: number of people (in thousand)
Gross fixed capital formation: current prices (million €)
Population density: persons per km2
Following the DEA analysis, the efficiency scores are contrasted to Hofstede’s
cultural dimensions, which include as already mentioned: Power distance index, Invidualism
vs Collectivism, Masculinity vs Feminity, Uncertainty Avoidance index, Long term vs short
term orientation and Indulgence versus Restraint. Moreover they are contrasted to Schwartz’s
cultural dimensions which are comprised of: Harmony, Conservatism, Hierarchy, Mastery,
Affective autonomy, Intellectual autonomy and Egalitarianism. According to Hofstede (1983)
individualism is positively related to economic development and some of the psychological
features that define modern society, such as low integration of relatives, independence and
future orientation, etc. (Yang, 1988). In this analysis it is assumed that cultural dimensions’
data do not change over this examined period as it takes a longer time for a change of
behaviour to be established.
4. Empirical findings
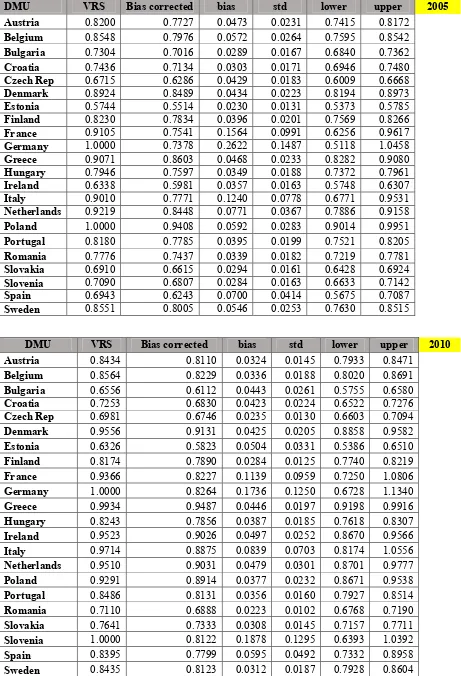
According to the bias corrected efficiency measures the countries with the higher
environmental efficiency scores (i.e. > 0.80) over the years are reported to be:
• Framework M1: Denmark, Greece, Italy, Netherlands and Poland.
• Framework M2: Denmark, Finland, Greece, Italy, Netherlands, Poland and Sweden.
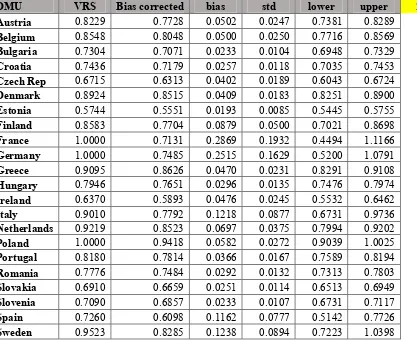
Tables 2 and 3 present the efficiency scores of the 22 countries, the bias corrected
efficiency scores and the 95-percent confidence intervals: lower and upper bound obtained by
Table 2: Bias corrected efficiency scores of the 22 countries for modelling framework M1
DMU VRS Bias corrected bias std lower upper 2005
Austria 0.8200 0.7727 0.0473 0.0231 0.7415 0.8172
Belgium 0.8548 0.7976 0.0572 0.0264 0.7595 0.8542
Bulgaria 0.7304 0.7016 0.0289 0.0167 0.6840 0.7362
Croatia 0.7436 0.7134 0.0303 0.0171 0.6946 0.7480
Czech Rep 0.6715 0.6286 0.0429 0.0183 0.6009 0.6668
Denmark 0.8924 0.8489 0.0434 0.0223 0.8194 0.8973
Estonia 0.5744 0.5514 0.0230 0.0131 0.5373 0.5785
Finland 0.8230 0.7834 0.0396 0.0201 0.7569 0.8266
France 0.9105 0.7541 0.1564 0.0991 0.6256 0.9617
Germany 1.0000 0.7378 0.2622 0.1487 0.5118 1.0458
Greece 0.9071 0.8603 0.0468 0.0233 0.8282 0.9080
Hungary 0.7946 0.7597 0.0349 0.0188 0.7372 0.7961
Ireland 0.6338 0.5981 0.0357 0.0163 0.5748 0.6307
Italy 0.9010 0.7771 0.1240 0.0778 0.6771 0.9531
Netherlands 0.9219 0.8448 0.0771 0.0367 0.7886 0.9158
Poland 1.0000 0.9408 0.0592 0.0283 0.9014 0.9951
Portugal 0.8180 0.7785 0.0395 0.0199 0.7521 0.8205
Romania 0.7776 0.7437 0.0339 0.0182 0.7219 0.7781
Slovakia 0.6910 0.6615 0.0294 0.0161 0.6428 0.6924
Slovenia 0.7090 0.6807 0.0284 0.0163 0.6633 0.7142
Spain 0.6943 0.6243 0.0700 0.0414 0.5675 0.7087
Sweden 0.8551 0.8005 0.0546 0.0253 0.7630 0.8515
DMU VRS Bias corrected bias std lower upper 2010
Austria 0.8434 0.8110 0.0324 0.0145 0.7933 0.8471
Belgium 0.8564 0.8229 0.0336 0.0188 0.8020 0.8691
Bulgaria 0.6556 0.6112 0.0443 0.0261 0.5755 0.6580
Croatia 0.7253 0.6830 0.0423 0.0224 0.6522 0.7276
Czech Rep 0.6981 0.6746 0.0235 0.0130 0.6603 0.7094
Denmark 0.9556 0.9131 0.0425 0.0205 0.8858 0.9582
Estonia 0.6326 0.5823 0.0504 0.0331 0.5386 0.6510
Finland 0.8174 0.7890 0.0284 0.0125 0.7740 0.8219
France 0.9366 0.8227 0.1139 0.0959 0.7250 1.0806
Germany 1.0000 0.8264 0.1736 0.1250 0.6728 1.1340
Greece 0.9934 0.9487 0.0446 0.0197 0.9198 0.9916
Hungary 0.8243 0.7856 0.0387 0.0185 0.7618 0.8307
Ireland 0.9523 0.9026 0.0497 0.0252 0.8670 0.9566
Italy 0.9714 0.8875 0.0839 0.0703 0.8174 1.0556
Netherlands 0.9510 0.9031 0.0479 0.0301 0.8701 0.9777
Poland 0.9291 0.8914 0.0377 0.0232 0.8671 0.9538
Portugal 0.8486 0.8131 0.0356 0.0160 0.7927 0.8514
Romania 0.7110 0.6888 0.0223 0.0102 0.6768 0.7190
Slovakia 0.7641 0.7333 0.0308 0.0145 0.7157 0.7711
Slovenia 1.0000 0.8122 0.1878 0.1295 0.6393 1.0392
DMU VRS Bias corrected bias std lower upper 2015
Austria 0.7128 0.6559 0.0569 0.0308 0.6177 0.7361
Belgium 0.7164 0.6475 0.0689 0.0435 0.5960 0.7548
Bulgaria 0.6149 0.5453 0.0696 0.0380 0.4877 0.6392
Croatia 0.6336 0.5489 0.0848 0.0469 0.4759 0.6643
Czech Rep 0.6250 0.5795 0.0454 0.0276 0.5477 0.6531
Denmark 0.8186 0.7577 0.0609 0.0327 0.7178 0.8442
Estonia 0.5571 0.5099 0.0472 0.0300 0.4702 0.5896
Finland 0.7395 0.6783 0.0611 0.0271 0.6377 0.7408
France 0.9406 0.7115 0.2292 0.1713 0.5143 1.0921
Germany 1.0000 0.6685 0.3315 0.2073 0.3733 1.0800
Greece 1.0000 0.7352 0.2648 0.1208 0.4954 0.9224
Hungary 0.6794 0.6281 0.0513 0.0229 0.5941 0.6843
Ireland 0.7482 0.6800 0.0682 0.0296 0.6328 0.7422
Italy 1.0000 0.7685 0.2316 0.1459 0.5759 1.0693
Netherlands 0.8465 0.7524 0.0941 0.0573 0.6808 0.8772
Poland 0.8270 0.7440 0.0830 0.0547 0.6799 0.8803
Portugal 0.8707 0.7525 0.1183 0.0563 0.6577 0.8494
Romania 0.6649 0.6154 0.0495 0.0302 0.5814 0.6971
Slovakia 0.6326 0.5902 0.0424 0.0189 0.5628 0.6348
Slovenia 0.6173 0.5110 0.1063 0.0583 0.4138 0.6495
Spain 0.8527 0.7086 0.1441 0.1039 0.5851 0.9325
[image:18.595.76.493.421.764.2]Sweden 0.7071 0.6390 0.0681 0.0434 0.5878 0.7437
Table 3: Bias corrected efficiency scores of the 22 countries for modelling framework M2
DMU VRS Bias corrected bias std lower upper 2005
Austria 0.8229 0.7728 0.0502 0.0247 0.7381 0.8289
Belgium 0.8548 0.8048 0.0500 0.0250 0.7716 0.8569
Bulgaria 0.7304 0.7071 0.0233 0.0104 0.6948 0.7329
Croatia 0.7436 0.7179 0.0257 0.0118 0.7035 0.7453
Czech Rep 0.6715 0.6313 0.0402 0.0189 0.6043 0.6724
Denmark 0.8924 0.8515 0.0409 0.0183 0.8251 0.8900
Estonia 0.5744 0.5551 0.0193 0.0085 0.5445 0.5755
Finland 0.8583 0.7704 0.0879 0.0500 0.7021 0.8698
France 1.0000 0.7131 0.2869 0.1932 0.4494 1.1166
Germany 1.0000 0.7485 0.2515 0.1629 0.5200 1.0791
Greece 0.9095 0.8626 0.0470 0.0231 0.8291 0.9108
Hungary 0.7946 0.7651 0.0296 0.0135 0.7476 0.7974
Ireland 0.6370 0.5893 0.0476 0.0245 0.5532 0.6462
Italy 0.9010 0.7792 0.1218 0.0877 0.6731 0.9736
Netherlands 0.9219 0.8523 0.0697 0.0375 0.7994 0.9202
Poland 1.0000 0.9418 0.0582 0.0272 0.9039 1.0025
Portugal 0.8180 0.7814 0.0366 0.0167 0.7589 0.8194
Romania 0.7776 0.7484 0.0292 0.0132 0.7313 0.7803
Slovakia 0.6910 0.6659 0.0251 0.0114 0.6513 0.6949
Slovenia 0.7090 0.6857 0.0233 0.0107 0.6731 0.7117
Spain 0.7260 0.6098 0.1162 0.0777 0.5142 0.7726
DMU VRS Bias corrected bias std lower upper 2010
Austria 0.8459 0.8048 0.0410 0.0204 0.7754 0.8523
Belgium 0.8564 0.8235 0.0330 0.0191 0.8020 0.8674
Bulgaria 0.6556 0.6145 0.0411 0.0240 0.5804 0.6646
Croatia 0.7253 0.6862 0.0391 0.0204 0.6561 0.7310
Czech Rep 0.6981 0.6721 0.0260 0.0147 0.6542 0.7054
Denmark 0.9556 0.9101 0.0455 0.0209 0.8770 0.9562
Estonia 0.6326 0.5867 0.0459 0.0306 0.5462 0.6538
Finland 0.9012 0.8482 0.0529 0.0320 0.8070 0.9223
France 1.0000 0.8017 0.1983 0.1805 0.6206 1.2255
Germany 1.0000 0.8369 0.1631 0.1342 0.6876 1.1654
Greece 1.0000 0.9474 0.0526 0.0210 0.9139 0.9974
Hungary 0.8243 0.7867 0.0376 0.0171 0.7609 0.8203
Ireland 0.9943 0.9486 0.0456 0.0218 0.9141 0.9962
Italy 0.9714 0.8947 0.0767 0.0700 0.8292 1.0803
Netherlands 0.9510 0.9047 0.0463 0.0271 0.8718 0.9694
Poland 0.9291 0.8841 0.0450 0.0303 0.8505 0.9576
Portugal 0.8486 0.8105 0.0382 0.0167 0.7838 0.8439
Romania 0.7110 0.6854 0.0256 0.0126 0.6680 0.7166
Slovakia 0.7641 0.7344 0.0297 0.0137 0.7149 0.7608
Slovenia 1.0000 0.8296 0.1704 0.1259 0.6688 1.0670
Spain 0.8832 0.8014 0.0817 0.0597 0.7362 0.9422
Sweden 0.9646 0.8783 0.0863 0.0726 0.8056 1.0642
DMU VRS Bias corrected bias std lower upper 2015
Austria 0.7128 0.6417 0.0711 0.0363 0.5962 0.7311
Belgium 0.7164 0.6510 0.0654 0.0376 0.6067 0.7413
Bulgaria 0.6149 0.5600 0.0548 0.0307 0.5157 0.6330
Croatia 0.6336 0.5675 0.0662 0.0376 0.5114 0.6583
Czech Rep 0.6250 0.5813 0.0436 0.0227 0.5518 0.6389
Denmark 0.8186 0.7599 0.0588 0.0283 0.7232 0.8290
Estonia 0.5571 0.5188 0.0383 0.0256 0.4869 0.5870
Finland 0.9534 0.8691 0.0843 0.0685 0.8021 1.0451
France 1.0000 0.6754 0.3246 0.2557 0.3770 1.2250
Germany 1.0000 0.7138 0.2862 0.2222 0.4497 1.1529
Greece 1.0000 0.7666 0.2334 0.1288 0.5556 0.9724
Hungary 0.6794 0.6345 0.0450 0.0188 0.6057 0.6797
Ireland 0.7699 0.6836 0.0863 0.0450 0.6196 0.7961
Italy 1.0000 0.7812 0.2189 0.1483 0.5978 1.1233
Netherlands 0.8465 0.7576 0.0889 0.0522 0.6923 0.8656
Poland 0.8270 0.7369 0.0900 0.0538 0.6700 0.8556
Portugal 0.8707 0.7682 0.1025 0.0558 0.6873 0.8815
Romania 0.6649 0.6128 0.0521 0.0265 0.5767 0.6740
Slovakia 0.6326 0.5955 0.0372 0.0156 0.5725 0.6340
Slovenia 0.6173 0.5345 0.0828 0.0482 0.4593 0.6526
Spain 0.9744 0.8512 0.1232 0.1010 0.7475 1.1284
Multiple regression analysis was used to test if the bias corrected efficiency scores
can significantly be predicted by Hofstede’s and Schwartz’s cultural dimensions for both
frameworks and for all the years examined. The regression results are presented in summary
[image:20.595.66.535.193.459.2]in Table 4 for Hofstede’s cultural dimensions and Table 5 for Schwartz’s ones.
Table 4: Multiple regression analysis results for Hofstede’s cultural dimensions
Results per year/
modelling framework M1 M2
2005 R2=0.3551 – Low predictability
indicating only 35.51% of variation in efficiency scores is explained
p-value of F stat = 0.2862 indicating no significant overall statistical relationship between the variables
R2=0.2930 - Low predictability
indicating only 29.3% of variation in efficiency scores is explained
p-value of F stat = 0.4406 indicating no significant overall statistical relationship between the variables 2010 R2=0.7426 – High predictability
indicating that 74.26% of variation in efficiency scores is explained model
p-value of F stat = 0.0006 statistically significant suggesting that changes in predictors affect the
response variable
R2=0.7845 - High predictability
indicating that 78.45% of variation in efficiency scores is explained model
p-value of F stat = 0.0003 statistically significant suggesting that changes in predictors affect the
response variable 2015 R2=0.5828 – Moderate predictability
indicating that 58.28% of variation in efficiency scores is explained
p-value of F stat = 0.023 < 0.05 statistically significant suggesting that changes in predictors affect the
response variable
R2=0.5086 - Moderate predictability
indicating that 50.86% of variation in efficiency scores is explained model
p-value of F stat = 0.00633 statistically significant suggesting
changes in predictors affect the response variable
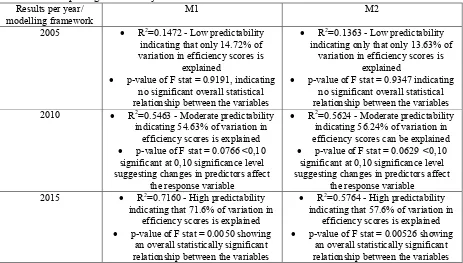
Table 5: Multiple regression analysis results for Schwartz’s cultural dimensions
Results per year/
modelling framework M1 M2
2005 R2=0.1472 - Low predictability
indicating that only 14.72% of variation in efficiency scores is
explained
p-value of F stat = 0.9191, indicating no significant overall statistical relationship between the variables
R2=0.1363 - Low predictability
indicating only that only 13.63% of variation in efficiency scores is
explained
p-value of F stat = 0.9347 indicating no significant overall statistical relationship between the variables 2010 R2=0.5463 - Moderate predictability
indicating 54.63% of variation in efficiency scores is explained
p-value of F stat = 0.0766 <0,10 significant at 0,10 significance level suggesting changes in predictors affect
the response variable
R2=0.5624 - Moderate predictability
indicating 56.24% of variation in efficiency scores can be explained
p-value of F stat = 0.0629 <0,10 significant at 0,10 significance level suggesting changes in predictors affect
the response variable 2015 R2=0.7160 - High predictability
indicating that 71.6% of variation in efficiency scores is explained
p-value of F stat = 0.0050 showing an overall statistically significant relationship between the variables
R2=0.5764 - High predictability
indicating that 57.6% of variation in efficiency scores is explained
[image:20.595.69.532.490.753.2]Results show that for the year 2005 no significant relationship is noticed between the
efficiency scores and the cultural dimensions’ data from both researchers, whereas for years
2010 and 2015 there appears to be a significant connection with changes in the predictors
also affecting the response variable. Moreover for years 2010 and 2015, the R2 provides
support for the assumed relationship between culture and environmental efficiency in EU
member states.
5. Discussion
Sometimes factors may be correlated but it’s not obvious to see the cause and effect
relationship between them so it’s important to evaluate also what is happening in the real
world (Redman, 2008). Sustainability requires substantial change in our conception of natural
resources (de Kadt, 1994). The analysis results presented above show that although in 2005
the cultural characteristics do not seem to have a significant relationship with the efficiency
scores of each country, in 2010 and 2015 the picture is completely different. Thus this
implies that people’s attitudes towards waste management have changed based on the cultural
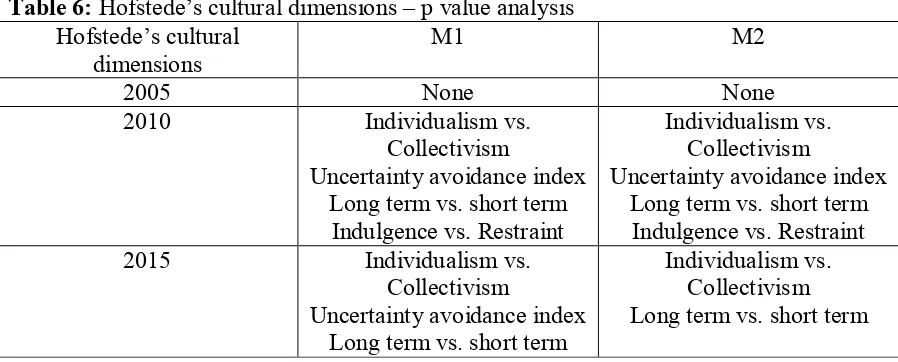
dimensions’ data provided. In more detail it is possible to evaluate which specific cultural
dimensions influence people’s attitudes more (p-value from regression analysis < 0.05),
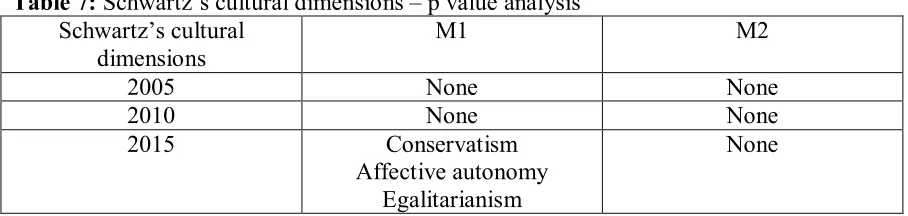
which can be seen in summary in table 6 for Hofstede’s dimensions and table 7 for
[image:21.595.68.517.572.753.2]Schwartz’s ones.
Table 6: Hofstede’s cultural dimensions – p value analysis Hofstede’s cultural
dimensions M1 M2
2005 None None
2010 Individualism vs. Collectivism
Uncertainty avoidance index Long term vs. short term
Indulgence vs. Restraint
Individualism vs. Collectivism
Uncertainty avoidance index Long term vs. short term
Indulgence vs. Restraint 2015 Individualism vs.
Collectivism
Uncertainty avoidance index Long term vs. short term
Table 7: Schwartz’s cultural dimensions – p value analysis Schwartz’s cultural
dimensions M1 M2
2005 None None
2010 None None
2015 Conservatism Affective autonomy
Egalitarianism
None
Among Hofstede’s dimensions, individualism, uncertainty avoidance, long term
orientation and indulgence were positively associated with the efficiency scores regarding
waste arisings for 2010 and 2015. The relationship between Schwartz’s cultural values and
the DEA efficiency scores was not found to be significant apart from conservatism, affective
autonomy and egalitarianism but only for year 2015. Overall findings suggest that Hofstede’s
cultural dimensions would be best to be considered when developing national level strategies
and campaigns to manage waste arisings.
A complete cultural change towards waste management of course won’t be achieved
very quickly, but behavioural change can be achieved when faced with an imminent crisis
(Oosthuizen, 2018). In those regards the above mentioned findings can be associated with the
financial crisis that has hit Europe after 2008 making people more skeptical on environmental
issues and how waste is best to be managed that will make sense financially but also
environmentally. At the same time EU jurisdiction has laid out some important Directives in
the field of waste management with regards to ways of disposal, special requirements,
restrictions and potential sustainable solutions (Oosthuizen, 2018). Finally along with the
factors above, EU has been faced with severe environmental challenges due to waste arisings,
as well as accidents and injuries for people working in this sector.
All in all, it comes forward that the current economic and environmental situation
symbiosis laid out in EU legislation, have led to fostering innovation and long-term culture
change.
6. Conclusions
This study evaluated environmental efficiency with DEA based on five parameters:
waste, GDP, labour, capital, and population density for 22 EU Member States and for the
years 2005, 2010 and 2015 in order to evaluate which Member States are more efficient.
Then the results from the efficiency analysis are contrasted to Hofstede’s and Schwartz’s
cultural dimensions on STATA with the use of regression modelling. Results show that for
year 2005 no significant relationship is noticed between the efficiency scores and the cultural
dimensions’ data from both researchers, whereas for years 2010 and 2015 there appears to be
a significant connection with changes in the predictors also affecting the response variable.
Among Hofstede’s dimensions, individualism, uncertainty avoidance, long term
orientation and indulgence were positively associated with the efficiency scores regarding
waste arisings for 2010 and 2015. The relationship between Schwartz’s cultural values and
the DEA efficiency scores was not found to be significant. Findings suggest that Hofstede’s
cultural dimensions would be best to be considered when developing national level strategies
and campaigns to manage waste arisings.
These findings can be associated with the financial crisis that has hit Europe after
2008 making people more sceptical on environmental issues and how waste is best to be
managed making sense financially but also environmentally. At the same time EU
legislations have laid out some important Directives in the field of waste management.
Finally, along with the factors above, EU has been faced with severe environmental
challenges due to waste arisings, as well as accidents and injuries for people working in this
sector. All these factors have widely modified waste culture and public’s approach towards
References
Aini, M.S., Fakhru’I-Razi, A., Lad, S.M. and Hashim, A.H. (2002) Practices, attitudes and motives for domestic waste recycling. International Journal of Sustainable Development & World Ecology, 9(3), 232-238.
Banker, R. D., Charnes, A. and Cooper, W.W. (1984) Some models for estimating technical and scale inefficiencies in data envelopment analysis. Management Science, 30, 1078– 1092.
Bator, R.J. and Cialdini, R.B. (2000) The application of persuasion theory to the development of effective pro-environmental public service announcements. Journal of Social Issues, 56, 527–541.
Bond, M. H. (1988) Finding universal dimensions of individual variation in multicultural studies of values: The Rokeach and Chinese value surveys. Journal of Personality and Social Psychology, 55(6), 1009-1015.
Boussofiane, A., Dyson, R.G. and Thanassoulis, E. (1991) Applied data envelopment analysis. European Journal of Operational Research, 52, 1–15.
Bratt, C. (1999) The impact of norms and assumed consequences on recycling behavior.
Environmental Behaviour, 31, 630–656.
Brett, J. M. and Okumura, T. (1998) Inter- and intracultural negotiation: US and Japanese negotiators. Academy of Management Journal, 41(5), 495–510.
Charnes, A., Cooper, W.W. and Rhodes, E. (1978) Measuring the efficiency of decision making units. European Journal of Operational Research, 2, 429–444.
Chekima, B., Chekima, S., Syed Khalid Wafa, A.W., Igau, O.A., Sondoh, S.L. (2016) Sustainable consumption: the effects of knowledge, cultural values, environmental advertising, and demographics. International Journal of Sustainable Development & World Ecology, 23(2), 210-220.
De Feo, G. and De Gisi, S. (2010) Domestic Separation and Collection of Municipal Solid Waste: Opinion and Awareness of Citizens and Workers. Sustainability, 2(5), 1297-1326.
De Feo, G. and Napoli, R.M.A. (2005) New and old paradigms on production and management of municipal solid waste. In Proceedings of Sardinia 2005, Tenth International Waste Management and Landfill Symposium, Cagliari, Italy, 3–7 October 2005; CISA: Cagliari, Italy.
Defra (2011) The Economics of Waste and Waste Policy, Waste Economics Team, Environment and Growth Economics, Department for Environment, Food and Rural Affairs. This document is available on the Defra website.
De Kadt, M. (1994) Garbage Culture and The Culture of Garbage: The Solid Waste Management Quagmire. Organization and Environment, 8(4), 345-379.
Drogendijka, R. and Slangen, A. (2006) Hofstede, Schwartz, or managerial perceptions? The effects of different cultural distance measures on establishment mode choices by multinational enterprises. International Business Review, 15, 361–380.
Dyson, R.G. and Shale, E.A. (2010). Data envelopment analysis, operational research and Uncertainty. Journal of the Operational Research Society, 61, 25—34.
Efron, B. (1979) Bootstrap methods: another look at the jackknife. Annals of Statistics, 7, 1-26.
El Leithy, W. (2017) A Review of the Impact of National Culture on Economic Growth. International Journal of Economics & Management Science, 6(4), 1-4.
Farrell, M. J. (1957) The measurement of productive efficiency. Journal of the Royal Statistical Society. Series A (General), 120(3), 253–290.
Gallo, A. (2015) A Refresher on Regression Analysis. Harvard Business Review. Available at: https://hbr.org/2015/11/a-refresher-on-regression-analysis
Halkos G (2006). Econometrics: Theory and practice. Giourdas Publications.
Halkos G. (2011). Econometrics: Theory and practice: Instructions in using Eviews, Minitab, SPSS and excel. Gutenberg: Athens.
Halkos, G. and Tzeremes, N. (2013a) National culture and eco-efficiency: an application of conditional partial nonparametric frontiers. Environmental and Economic Policy Studies, 15, 423–441.
Halkos, G. and Tzeremes, N. (2013b) Modelling the effect of national culture on countries’ innovation performances: A conditional full frontier approach. International Review of Applied Economics, 27(5), 656-678.
Hall, D. (2017) Throwaway culture has spread packaging waste worldwide: here's what to do about it. The Guardian, 13 March 2017. Available at:https://www.theguardian.com/ nvironment/2017/mar/13/waste-plastic-food-packaging-recycling-throwaway-culture-dave-hall
Hofstede, G. (1980) Cultures consequences: international differences in work-related values. Sage Press, Beverly Hills.
Hofstede, G. (1983) The cultural relativity of organizational practices and theories. Journal of International Business Studies Fall: 75–90.
Hofstede, G. (2001) Culture’s Consequences: Comparing Values, Behaviors, Institutions, and Organizations Across Nations. 2nd ed., Sage, Beverly Hills CA.
Hofstede, G. (2011) Dimensionalizing Cultures: The Hofstede Model in Context. Online Readings in Psychology and Culture, 2(1), 1-26.
Hofstede, G. (2018) The 6-D model of national culture. Available at:
http://geerthofstede.com/culture-geert-hofstede-gert-jan-hofstede/6d-model-of-national-culture/ [Accessed: 15 January 2018]
Hofstede, G., Hofstede, G.J. and Minkov, M. (2010) Cultures and organizations: software of the mind, 3rd edn. McGraw-Hill, New York.
Honma, S. and Hu, J.-L. (2009) Efficient waste and pollution abatements for regions in Japan. International Journal of Sustainable Development & World Ecology, 16(4), 270-285.
Hopper, J.R. and Nielsen, J.M. (1991) Recycling as altruistic behavior: Normative and behavioral strategies to expand participation in community recycling programs.
Environment and Behaviour, 23, 195–220.
Inglehart, R. (1997) Modernization and Postmodernization: Cultural, Economic and Political Change in 43 Societies. Princeton University Press, Princeton, NJ.
Lee, D. (2017) Overcoming the culture of waste. MIT Sloane Experts. Available at:
http://mitsloanexperts.mit.edu/overcoming-the-culture-of-waste-deishin-lee/
Nau, R. (2018) Notes on linear regression analysis. Available at:http://people.duke.edu/~ nau/Notes_on_linear_regression_analysis--Robert_Nau.pdf
Ng, S.I., Lee, J.A. and Soutar, G.N. (2006) Are Hofstede’s and Schwartz’s value frameworks congruent?. International Marketing Review, 24(2), 164-180.
Oosthuizen, J. (2018) Behavioural change a hurdle across industries. Engineering News. Available at: http://www.engineeringnews.co.za/article/behavioural-change-a-hurdle-waste-management-company-2018-09-28/rep_id:4136
Parsons, T. (1951) The social system, Free Press, Glencoe, IL.
Petty, R.E. and Cacioppo, J.T. (1986) Communication and Persuasion: Central and Peripheral Routes to Attitude Change; Springer-Verlag: New York, NY, USA.
Redman, T.C. (2008) Data Driven: Profiting from Your Most Important Business Asset.
Harvard Business Review Press.
Rogge, N. and De Jaeger, S. (2012) Evaluating the efficiency of municipalities in collecting and processing municipal solid waste: A shared input DEA-model. Waste Management, 32, 1968–1978.
Schneider, D. (1972) What is kinship all about? In Kinship studies in the Morgan Memorial Year, P. Reinig (Ed.), Anthropological Society of Washington, Wash., DC.
Schwartz, S.H. (1977) Normative influence on altruism. In Advances in Experimental Social Psychology; Berkowitz, L., Ed.; Academic Press: New York, NY, USA, 221–279.
Schwartz, S.H. (1992) Universals in the content and structure of values: Theoretical advances and empirical tests in 20 countries. In M. P. Zanna (Ed.), Advances in Experimental SocialPsychology 25, 1–66.
Schwartz, S. H. (1994) Beyond individualism/collectivism: New cultural dimensions of values. In U. Kim, H. C. Triandis, C. Kagitcibasi, S. C. Choi and G. Yoon (Eds.), Individualism and collectivism: Theory, methods, and applications (pp. 85–119). Thousand Oaks: Sage Publications.
Schwartz, S.H. (1999) Cultural value differences: some implications for work. Applied Psychology: An International Review, 48, 23–47.
Schwartz, S.H. (2004) Mapping and interpreting cultural differences around the world. In Vinken, H., Soeters, J. and Ester, P. (Eds.): Comparing Cultures, Dimensions of Culture in a Comparative Perspective, Brill, Leiden, The Netherlands, 43–73.
Sagiv, L. and Schwartz, S.H. (2007) Cultural values in organisations: insights for Europe.
European Journal of International Management, 1(3), 176-190.
Seiford, L.M. and Thrall, R.M. (1990) Recent developments in DEA: The mathematical programming approach to frontier analysis. Journal of Econometrics, 46, 7–38.
Seiford, L.M. and Zhu, J. (2002) Modeling undesirable factors in efficiency evaluation.
European Journal of Operational Research, 142, 16-20.
Seiford, L.M. and Zhu, J. (2005) A response to comments on modeling undesirable factors in efficiency evaluation. European Journal of Operational Research, 161, 579-581.
Shackleton, V. J. and Ali, A. H. (1990) Work-related values of managers: A test of the Hofstede model. Journal of Cross-cultural Psychology, 21(1), 109-118.
Sherman, H.D. and Zhu, J. (2006) Chapter 2: Data Envelopment Analysis explained. In: Service Productivity Management, Improving Service Performance using Data Envelopment Analysis (DEA), Springer.
Simar, L. and Wilson, P.W. (1998). Sensitivity analysis of efficiency scores: how to bootstrap in non parametric frontier models. Management Science, 44, 49-61.
Simar, L. and Wilson, P.W. (2002). Non parametric tests of return to scale. European Journal of Operational Research, 139, 115-132.Simões, P., De Witte, K. and Marques, R.C. (2010) Regulatory structures and operational environment in the Portuguese waste sector. Waste Management, 30, 1130–1137.
Sondergaard, M. (1994) Hofstede’s consequences: A study of reviews, citations and replications. Organization Studies, 15(3), 447-456.
Song, M., An, Q., Zhang, W., Wanga, Z. and Wub, J. (2012) Environmental efficiency evaluation based on data envelopment analysis: A review. Renewable and Sustainable Energy Reviews, 16, 4465–4469.
Sordo, A.I. (2015) Beyond Hofstede’s Cultural Dimensions Theory: Approaching a Multicultural Audience. Available at: https://www.skyword.com/contentstandard/ arketing/beyond-hofstedes-cultural-dimensions-theory-approaching-a-multicultural-audience/ [Accessed: 11 November 2017]
Steenkamp, J.B.E.M. (2001) The role of national culture in international marketing research.
International Marketing Review, 18(1), 30–44.
The Trustees of Princeton University (2007) Interpreting Regression Output. Available at:
https://dss.princeton.edu/online_help/analysis/interpreting_regression.htm
Triandis, H. C. (1982) Culture’s consequences. Human Organization, 41(1), 86-90.
Watkins, E. (2015). A case study on illegal localised pollution incidents in the EU. A study compiled as part of the EFFACE project. London: IEEP.
Yang, K.-S. (1988) Will societal modernization eventually eliminate cross-cultural psychological differences? In M. H. Bond (Ed.). The cross-cultural challenge to social psychology (pp. 67-85). Newbury Park, CA: Sage Publications.