13
BinLin: A Simple Method of Dependency Tree Linearization
Yevgeniy Puzikov and Iryna Gurevych Ubiquitous Knowledge Processing Lab (UKP-TUDA)
Department of Computer Science, Technische Universit¨at Darmstadt Research Training Group AIPHES
{puzikov,gurevych}@ukp.informatik.tu-darmstadt.de
Abstract
Surface Realization Shared Task 2018 is a workshop on generating sentences from lemmatized sets of dependency triples. This paper describes the results of our par-ticipation in the challenge. We develop a data-driven pipeline system which first or-ders the lemmas and then conjugates the words to finish the surface realization pro-cess. Our contribution is a novel sequential method of ordering lemmas, which, despite its simplicity, achieves promising results. We demonstrate the effectiveness of the proposed approach, describe its limitations and outline ways to improve it.
1 Introduction
Natural Language generation (NLG) is the task of generating natural language utterances from tex-tual inputs or structured data representations. For many years one of the research foci in the NLG community has been Surface Realization (SR) – the process of transforming a sentence plan into a linearly-ordered, grammatical string of morpholog-ically inflected words (Langkilde-Geary,2002).
The SR Shared Task is aimed at developing a common input representation that could be used by a variety of NLG systems to generate realiza-tions from (Belz et al.,2011). In the case of the Surface Realization Shared Task 2018 (Mille et al.,
2018) there are two different representations the
contestants can use, depending on the track they participate in:
Shallow Track: unordered dependency trees
con-sisting of lemmatized nodes with part-of-speech (POS) tags and morphological infor-mation as found in the Universal Dependen-cies (UD) annotations (version 2.0).1
1http://universaldependencies.org/
Deep Track: same as above, but having functional words and morphological features removed.
We participated in the shallow track, and there-fore our task was to generate a sentence by order-ing the lemmas and inflectorder-ing them to the correct surface forms. The outputs of the participating sys-tems are assessed using both automatic and manual evaluation. The former is performed by computing BLEU (Papineni et al.,2002), NIST (Doddington,
2002), CIDEr (Vedantam et al.,2015) scores and
normalized string edit distance (EDIST) between the reference sentence and a system output. Man-ual evaluation is based on preference judgments: third-year undergraduate students from Cambridge, Oxford and Edinburgh rate pairs of candidate out-puts (including the target sentence), scoring them forClarity,FluencyandMeaning Similarity.
The data used for the task is the UD treebanks
distributed in the 10-column CoNLL-U format.2
The data is available for Arabic, Czech, Dutch, En-glish, Finnish, French, Italian, Portuguese, Russian and Spanish. According to the requirements of the Shallow Track, the information on word order was removed by randomized scrambling of the token sequence; the words were also replaced by their lemmas.
Our contribution is a simple method of depen-dency tree linearization which orders a bag of lem-mas based on the available syntactic information. The major limitation of the method is its input or-der sensitivity; solving this problem is reserved for future work.
Our paper has the following structure. Section2
describes related work done in the past. Section3
presents the results of the exploratory data analy-sis conducted prior to system development. The details of our system architecture are specified in
2http://universaldependencies.org/
Section4which is followed by the description of
the experimental setup and evaluation (Section5).
Section6mentions the limitations of the proposed
surface realization method and outlines future work directions.
2 Related Work
As mentioned in Section1, the task at hand is to
generate a sentence by ordering the lemmas and inflecting them to the correct surface forms. Past research work proposed both joint and pipeline so-lutions for the problem. Taking into consideration the pipeline nature of our system, we separate the related work stage-wise.
2.1 Syntactic Ordering
Given a bag of input words, a syntactic ordering algorithm constructs an output sentence. Prior work explored a range of approaches to
syntac-tic ordering: grammar-based methods (Elhadad
and Robin,1992;Carroll et al.,1999;White et al.,
2007), generate-and-rerank approaches (
Banga-lore and Rambow,2000;Langkilde-Geary,2002), tree linearization using probabilistic language
mod-els (Guo et al., 2008), inter alia. Depending on
how much syntactic information is available as input, the research on syntactic ordering can be categorized into (1) free word ordering, (2) full tree linearization and (3) partial tree linearization (Liu et al.,2015). The setup of the Surface Realization Task corresponds to the full tree linearization case, since the dependency tree information is provided. Conceptually, the problem of tree linearization
is simple. However, given no constraints, the
search space is exponential in the number of to-kens, which makes exhaustive search intractable. This stimulated the line of research focusing on the development of approximate search methods. Current state-of-the-art (evaluated on the English
data only) belongs to the system of Puduppully
et al.(2016) who extended the work ofLiu et al.
(2015) on developing a transition-based generator. The authors treated language generation process as a generalized form of dependency parsing with unordered token sequences, and used a learning
and search framework ofZhang and Clark(2011)
to keep the decoding process tractable. A similar approach to dependency tree linearization was ex-plored in (Bohnet et al.,2010), who approximated exact decoding with a beam search. Our method of syntactic ordering is also based on search
ap-proximation, but follows a different approach: we use a greedy search strategy, but restrict the scoring procedure to a smaller set of plausible candidate pairs, which speeds up the search procedure and reduces the number of mistakes the system might make.
2.2 Word Inflection
Word inflection in the context of the Surface Real-ization Task can be defined as the subtask of
gen-erating a surface form (was) from a given source
lemma (be) and additional morphological/syntactic
attributes (Number=Sing,Person=3,Tense=Past).
Early work proposed to approach the task with
finite state transducers (Koskenniemi,1983;
Ka-plan and Kay,1994). While being accurate, these systems require a lot of time and linguistic exper-tise to construct and maintain. With the advance of machine learning, the community mostly shifted towards data-driven methods of automatic morpho-logical paradigm induction and string transduction as the method of morphological inflection
gener-ation (Yarowsky and Wicentowski,2000;
Wicen-towski, 2004; Dreyer and Eisner, 2011; Durrett and DeNero,2013;Ahlberg et al.,2015). In com-parison with their rule-based counterparts, these approaches scale better across languages and do-mains, but require manually-defined comprehen-sive feature representation of the inputs.
Current research focuses on data-driven mod-els which learn a high-dimensional feature repre-sentation of the input data during the optimiza-tion procedure in an end-to-end fashion. Recent work (Faruqui et al.,2016) proposed to model the problem as a sequence-to-sequence learning task, using the encoder-decoder neural network archi-tecture developed in the machine translation com-munity (Cho et al.,2014;Sutskever et al.,2014). This approach showed an improvement over con-ventional machine learning models, but failed to ad-dress the issue of poor sample complexity of com-plex neural networks – in practice, the approach did not perform well on low-resource or morpho-logically rich languages.
An attempt to address this issue was made by
Language
Property ar cs en es fi fr it nl pt ru
unique features 37 112 36 56 89 35 41 66 48 40
OOV lemmas 1056 3299 1180 1368 1598 1895 439 973 535 2723
OOV forms 1745 8070 1313 2131 3666 2387 683 1131 785 8190
[image:3.595.137.461.67.137.2]OOV chars 0 2 3 1 5 12 2 0 0 0
Table 1: Cross-lingual data analysis.
each step. The authors proposed to utilize indepen-dently learned character-level alignments instead of the weighted sum of representations (as done in the soft attention models). Experimental results demonstrated better sample efficiency of the mod-els trained according to the proposed method, and considerable improvements over the previous ap-proaches.
3 Data Analysis
For the input to the shallow track, the organizers separated the reference sentences from the respec-tive structures. Although the one-to-one correspon-dence between sentences and dependency trees was preserved, the alignment between the lemmas in the trees and the word forms in the sentences was lost. To circumvent this issue and ease the burden of aligning lemmas with the corresponding surface forms, we decided to use the original UD data files for all our experiments – they contain the same dependency trees as the shared task data, but the or-der of the tokens is not scrambled and each surface form is aligned with the respective lemma.
Prior to system development, we analyzed the data along the dimensions which we deemed rele-vant for the task. Due to space constraints here we show figures and numbers mainly for English; the analysis results for other languages can be found in
AppendixA.1.
First, we examined the lemma-to-form ratio
(Figure 1). The majority of lemmas have only
one surface form, which suggests a strong major-ity baseline for the morphological inflection sub-task. However, languages with rich morphology (Czech, Finnish, Russian) pose a challenge in this regard and call for a more elaborate approach which takes into account complex grammar inflection paradigms. The number of unique features (val-ues in the FEAT column of the input data) served as a rough estimate of the latter (Table1). We have not performed any language-specific engineering to address these linguistic properties, but took them
min = 1, max = 18 mean = 1.24, std = 0.64
len(lemma) == 1 len(lemma) == 2 len(lemma) == 3 len(lemma) == 4 len(lemma) > 4
Figure 1: Lemma-to-form ratio (English).
into consideration for future work.
Another important data property is the length dis-tribution of lemmas, surface forms and sentences. We computed the training data statistics and used the obtained estimates to establish cut-off thresh-olds for filtering out outlier lemmas and forms from the training data.
The number of out-of-vocabulary (OOV) lan-guage units can be viewed as a crude measure of the expected difference between training and
de-velopment data distributions. Table1shows the
number of OOV lemmas, surface forms and charac-ters for each of the languages. Some of the datasets included foreign names and terms which are used in their original language forms. For example, out of 356464 French data tokens, 419 include characters that are not digits, punctuation signs or letters of the French alphabet. Since such words are usually not conjugated, but copied verbatim, we consider them as outliers and exclude them from the training procedure. Finally, tokens defined in the UD anno-tation guidelines as multi-word expressions (MWE) and empty nodes were excluded from the training data, because they require language-specific
treat-ment (e.g., the French data includes 9750 tokens
which were identified as MWE; out of 870033 to-kens in the Russian dataset, 1092 correspond to empty nodes).
[image:3.595.314.521.183.323.2]min = 0, max = 19 mean = 0.94, std = 1.67
[image:4.595.75.292.65.205.2]# children: 0-1 # children: 2-3 # children: 4-5 # children: 6-7 # children: 8-9 # children: > 10
Figure 2: Branching factor of the dependency trees (English).
one needs to take into account the complexity of the tree structures. We found the branching factor to be very informative in this regard: for each node in each tree we counted the number of children the node has. Most nodes in the dependency trees of all examined languages have one to three children (Figure2shows the distribution of branching factor values for English). This solicits decomposition of the syntactic ordering procedure over subtrees, similar to what was done in (He et al.,2009).
4 Our Approach
This section describes the approach we developed for the shared task.
Given a dependency tree, we first decompose it into subtrees each having one head and an ar-bitrary number of children. Each subtree is being linearized as follows: for each of the children nodes we predict whether it should be positioned to the left or to the right of the head node, and store this positional information in a binary tree structure. We move up the original tree, linearizing subtrees until we reach the root node. At this point we have processed all nodes from the original depen-dency tree – it can be now completely linearized by traversing the binary tree with the root as a head node.
Since each dependency node is labeled with the corresponding lemma, it is trivial to obtain a lemma sequence from the linearized dependency tree. We further use the morphological inflection genera-tor component to predict a surface form for each lemma in the sequence and in this way generate a sentence.
like
I apples
Egle fresh juicy
(a) Dependency tree
like
I juicy
fresh apples
Egle
[image:4.595.321.493.65.222.2](b) Binary tree
Figure 3: A dependency tree and a binary tree,
constructed according to Algorithm1. Reference
sentence: “I like fresh juicy Egle apples”.
4.1 Syntactic Component
The first step of the proposed pipeline orders the nodes of the dependency tree into a sequence which ideally mirrors the order of words in the reference sentence. The main difficulty of this step is finding a sorting or ranking method which avoids making many node comparisons or scoring decisions. We propose an ordering procedure which uses a given dependency tree and constructs a binary tree storing the original dependency nodes (lemmas) in a sorted order (Algorithm1) .
As input, the algorithm takes a dependency tree and a classifier trained to make binary decisions of positioning child nodes to the right/left of the head node. First, we decompose the tree into local
sub-trees, represented by(head, children)node groups.
This is achieved by running a breadth-first search (BFS) algorithm on the input dependency tree (line
4 of the pseudocode). For each (head, children)
group, we further apply the following steps:
• initialize a binary tree with the head node (line 5)
• iterate over the child nodes and use the
clas-sifier to predict whether the child should be inserted to the left or to the right of the head node (lines 6-7)
When the binary tree construction is finished, we can obtain a sorted lemma sequence by performing in-order traversal on the resulting binary tree.
The core of the procedure is the insertion of a
new node into the binary tree (Algorithm2). Given
a node pair (ni,nj), a classifier is used to predict
Algorithm 1: Given a dependency tree dg and a binary classifierclf, construct a binary tree and traverse it to order dependency nodes. BFS denotes the breadth-first search procedure.
1: functionORDERNODES(clf, dg)
2: root←dg.root
3: decisions← {}
4: forhead, children∈BF S(dg)do
5: bt←BinT ree(head)
6: forchild∈childrendo
7: InsertN ode(bt, child,clf)
8: end for
9: decisions[head] =T raverse(bt) 10: end for
11: order=OrderDec(root, decisions)
12: returnorder 13: end function
the right ofni. The decision is made based on the
feature representation of the two nodes.
Algorithm 2: A recursive procedure of inserting a new nodechild into a binary treebt, using a binary classifierclf.
1: procedureINSERTNODE(bt, child,clf)
2: bf ←GetF eat(bt) 3: cf ←GetF eat(child)
4: label←M akeDecision(clf, cf, bf)
5: iflabelisLEF T then
6: ifbt.lef tisN onethen
7: bt.lef t←BinT ree(child)
8: else
9: InsertN ode(bt.lef t, child,clf)
10: end if
11: else
12: ifbt.rightisN onethen
13: bt.right←BinT ree(child)
14: else
15: InsertN ode(bt.right, child,clf)
16: end if
17: end if
18: end procedure
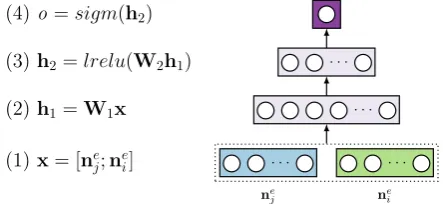
For simplicity, we decided to use a multi-layer perceptron as a classifier (Figure4).
Given a pair of nodes (ni,nj), we first extract
their features. We consider the node itself, it’s head and one (any) child in the dependency tree as the neighborhood elements and extract the correspond-ing lemmas, POS-tags (both XPOS and UPOS), and dependency edge labels. Thus, the feature set
. . .
ne j
. . .
ne i
. . . . . .
[image:5.595.307.529.63.165.2](1)x= [ne j;nei] (2)h1=W1x (3)h2=lrelu(W2h1) (4)o=sigm(h2)
Figure 4: Schematic view of the neural network architecture used as a classifier in the syntactic ordering component of our system.
for one node in the node pair consists of N =
3 (neighborhood elements) ×4 (features) = 12
components.
Each component is represented as a d
-dimensional embedding vector. The embedding matrix which contains all such vectors is denoted as
E ∈Rd×|V|, whereV is the vocabulary of unique
lemmas, XPOS, UPOS and dependency edge la-bels, observed in the training data.
The embedding vectors for the two nodes un-der consiun-deration are (1) concatenated to form the input to the classifier, (2) projected onto a lower-dimensional space via a linear transformation, (3) squeezed further via another linear transforma-tion followed by applying the Leaky ReLu func-tion (Maas et al.,2013). The last layer of the net-work consists of one node, followed by the sigmoid function. The decision of whether to insert node
nj to the right or to the left of node ni is made
according to the following rule:
decision= (
right, ifo ≥0.5,
left, otherwise.
The neural network components were
imple-mented using PyTorch (Paszke et al.,2017). No
pretrained embedding vectors or other external re-sources were used for the experiments.
4.2 Morphological Component
Language
Accuracy (nocase) ar cs en es fi fr it nl pt ru
LEMMA 13.47 56.43 85.47 71.45 44.43 70.44 67.88 79.35 74.19 50.06
MAJOR 69.15 63.50 86.80 76.13 51.04 74.02 72.48 82.74 75.85 55.64
MORPHMLP 86.63±0.507 94.40±0.052 96.41±0.053 96.72±0.151 78.26±0.217 92.73±0.094 94.09±0.062 91.05±0.110 94.12±0.198 90.43±0.122 MORPHRNNSOFT 88.48±2.409 96.61±0.598 93.57±1.370 97.20±0.801 81.05±7.405 92.30±0.797 92.54±3.721 85.82±1.993 94.27±3.424 93.65±2.980 MORPHRNNHARD 93.07±0.515 99.53±0.031 98.11±0.054 99.59±0.027 95.46±0.923 95.56±0.066 97.44±0.240 95.68±0.115 99.30±0.035 98.22±0.056 Accuracy (case)
[image:6.595.75.525.63.151.2]MORPHMLP 86.63±0.507 87.31±0.083 88.79±0.169 93.52±0.195 71.90±0.286 88.17±0.128 89.54±0.085 85.79±0.236 89.90±0.171 83.32±0.152 MORPHRNNSOFT 88.48±2.409 89.98±0.638 86.32±1.446 94.15±0.823 75.65±6.869 87.90±0.803 88.05±3.524 80.69±1.903 90.06±3.379 87.70±2.763 MORPHRNNHARD 93.07±0.515 93.07±0.047 90.76±0.186 96.60±0.037 89.32±0.861 91.24±0.099 93.08±0.296 90.58±0.219 95.19±0.119 92.32±0.079
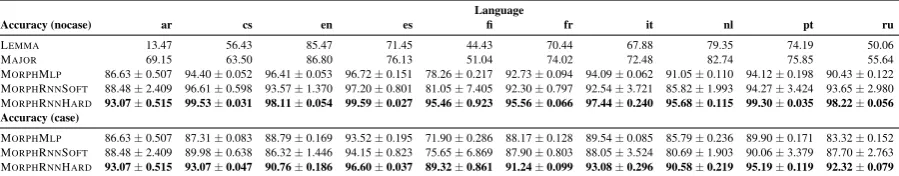
Table 2: Evaluation of the morphological inflection system component on the original UD development set using the percentage of exact string matches as a metric. For the neural architectures, we report both case-sensitive and case-insensitive mean scores and standard deviation (averaged across ten random seed values).
• a simple multi-layer perceptron similar to the
one employed for the syntactic component
(MORHPMLP)
• an encoder-decoder architecture with an
at-tention mechanism ofBahdanau et al.(2014)
(MORHRNNSOFT)
• an encoder-decoder model with a hard
mono-tonic attention (Aharoni and Goldberg,2017)
(MORPHRNNHARD)
OOV lemmas and characters during decoding were copied without any changes.
5 Experimental Setup and Evaluation
Training data was filtered to exclude outliers ac-cording to the results of the data analysis (Section
3). The system components were trained separately
ten times with different random seeds. In this sec-tion, we report mean scores and standard deviation for each model evaluated on the development data and averaged across the random seed values. The evaluation of the proposed approach was done both independently for each of the single components and as a whole in the pipeline mode. All the results are computed on the tokenized data instances.
Morphological component. We start with the evaluation of the morphological inflection genera-tor, and report the exact string match accuracy for
each of the tested approaches (Table2). Two
sim-ple baselines were developed for the experiment:
given a lemma, LEMMAcopies the lemma itself
as a prediction of the surface form, MAJOR
out-puts the most frequent surface form if the lemma is not an OOV item, or the lemma itself, otherwise. Lemma-form frequencies were computed on the training data. For the baselines, we report case-insensitive scores only; the results can be easily extrapolated to the case-sensitive scenario.
As expected, the baselines are outperformed by all data-driven methods examined. Strong perfor-mance of the majority baseline for English and Dutch data can be attributed to the simpler mor-phology of the languages.
The best results are achieved by the
model of Aharoni and Goldberg (2017)
(MORPHRNNHARD), which outperforms all
other methods across all languages. Despite
the fact that the approach has a bias towards languages with concatenative morphology (due to the assumption of the monotonic alignment between the input and output character sequences), it also performs well on Arabic. This model was chosen for our further pipeline experiments.
Bad sample complexity of the soft attention model (MORPHRNNSOFT) explains its inferior per-formance compared to the hard attention model.
MORPHRNNSOFTmodel seems to be highly
sen-sitive to the different values of hyperparameters; its performance has the highest standard devia-tion among all models, which is most likely due to the same sample complexity issue. Interest-ingly enough, on English, French, Italian and Dutch data the multi-layer perceptron architecture
(MORPHMLP) achieves better results. The latter
has a considerably simpler, but less flexible struc-ture, which prohibits the usage of such networks for languages with rich morphology – the number of parameters needed to account for various forms and morphological features grows rapidly until the model can no longer fit into the memory. This also highlights the importance of cross-lingual evalua-tion of morphological analyzers and generators.
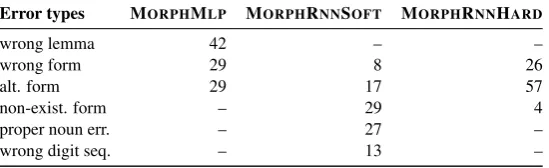
Error types MORPHMLP MORPHRNNSOFT MORPHRNNHARD
wrong lemma 42 – –
wrong form 29 8 26
alt. form 29 17 57
non-exist. form – 29 4
proper noun err. – 27 –
[image:7.595.163.438.64.148.2]wrong digit seq. – 13 –
Table 3: Major error types made by each of the tested morphological component models.
the first letter of the word, because these cases are ignored by the official evaluation protocol. After the filtering, we randomly sampled one hundred er-roneous predictions and manually examined them; the results are shown in Table3.
Unlike character-based models, MORPHMLP
treats each surface form as an atomic unit and is therefore prone to errors caused by the data sparsity issues, failing to predict correct forms for unseen
lemmas or unseen grammar patterns (wrong lemma
error type). If the model correctly identifies the base form and still makes a mistake, in half of the cases it is an incorrect prediction of verb tenses, singular/plural noun forms or indefinite English ar-ticles (wrong form). The latter cases are caused by the fact that our model does not use any informa-tion about the next token when predicting the form of the current lemma. This limitation is inherent to the pipeline architecture we employed and can be accounted for in a joint morphology/syntax model-ing scenario. Finally, there are also cases where a model predicts an alternative surface form which does not match the ground truth, but is grammati-cally correct (alt. form): “not” vs. “n’t”, “are” vs. “’re”, “have” vs. “’ve”). Strictly speaking, the latter cases are not errors, but for simplicity we will treat them as such in this section.
MORPHRNNSOFTmodel predicts fewer wrong
morphological variants, but suffers from another problem – hallucinating non-existing surface forms: “singed” instead of “sung”, “dened” instead of “de-nied”, “siaseme” vs. “siamese”. This is not sur-prising, given the sequential nature of the model; usually this happens in cases with flat probability distributions over a number of possible characters following the already predicted character sequence. A large portion of such errors includes incorrect spellings of proper nouns (proper noun err): “Jer-sualm” vs. “Jerusalem”, “Mconal” instead of “Mc-Donal”. Finally, one prominent group of errors is
that of incorrect digit sequences. MORPHMLPdoes
not make these mistakes, because it uses a heuristic:
OOV lemmas are copied verbatim as predictions of the surface forms.
The majority of erroneous cases for MOR
-PHRNNHARDmodel constitute the group of
alter-native forms. Compared to other models, there are considerably fewer cases of predicting non-existent
forms (“allergys”, “goining”). The wrong form
error type is mainly represented by incorrect pre-dictions of verb forms: “sing” instead of “sung”, “got” instead of “gotten”, “are” instead of “’m”, etc. The results of the error analysis suggest that there is still a large room for improvement of the morphological inflection generation component. A principled approach to handling unseen tokens and a way to constrain the predictions to well-formed outputs would be interesting directions to investi-gate further.
Syntactic component. The syntactic compo-nent has been evaluated by computing system-level
BLEU, NIST and edit distance scores (Table4).
Following the official evaluation protocol, output texts were normalized prior to computing metrics by lower-casing all tokens.
To the best of our knowledge, surface realization systems have not been evaluated on all the data
used in the shared task. A simple baseline (RAND)
which outputs a random permutation of the sen-tence tokens performs poorly across all languages. Compared to it, the 74.88% of the development data sentences ordered correctly by our method seem to indicate a good performance.
To get an idea of where our approach breaks, we sampled a few erroneous predictions and examined them manually. Generally speaking, the syntactic ordering procedure works well on the deeper tree levels, but as we move up, it gets harder to account for the many descendants a node has. An example of this error mode is given in Figure5.
pre-Language
BLEU ar cs en es fi fr it nl pt ru
RAND 0.013 0.023 0.026 0.016 0.031 0.018 0.022 0.024 0.020 0.024 SYNMLP 0.896±0.003 0.778±0.005 0.889±0.007 0.812±0.005 0.762±0.008 0.889±0.005 0.849±0.006 0.800±0.007 0.901±0.004 0.820±0.005 EDIST
RAND 0.078 0.115 0.149 0.089 0.139 0.104 0.110 0.126 0.127 0.120 SYNMLP 0.910±0.004 0.833±0.004 0.912±0.006 0.840±0.006 0.827±0.007 0.897±0.005 0.849±0.007 0.844±0.007 0.924±0.005 0.839±0.005 NIST
[image:8.595.117.256.223.332.2]RAND 10.40 11.86 9.88 9.78 11.18 9.86 9.40 9.45 9.05 11.35 SYNMLP 14.14±0.011 15.83±0.022 13.97±0.025 14.51±0.030 13.09±0.019 14.48±0.018 12.92±0.016 12.59±0.017 12.87±0.014 15.49±0.025
Table 4: Evaluation of the syntactic ordering component on the original UD development set. We report
mean scores and standard deviation for the SYNMLPmodel; the scores were averaged over ten models
trained with different random seeds. RANDis the random baseline. The scores are case-insensitive.
brings
move
Every makes
future
this particular
closer .
Every move Google makes brings this particular future closer.
Every move Google makes closer brings this particular future.
Figure 5: A common error our syntactic ordering component makes. The node in the rectangle is current head, the node in the oval indicates its child for which the position prediction was incorrect. The upper sentence is the gold ordering, the one below is predicted by our system.
dictions, but this did not yield any improvements. Further investigation with regard to this issue is reserved for future work.
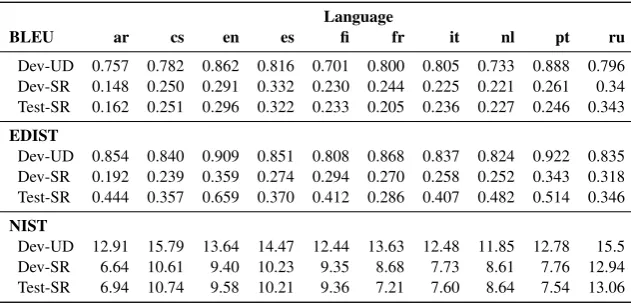
Full pipeline.Table5shows the metric evalua-tion results of the pipeline on the development and test data provided by the organizers (Dev-SR and Test-SR), as well as the development data from the original UD dataset, which was used in our preliminary experiments (Dev-UD).
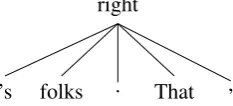
Given the large gap between the system per-formance on Dev-SR and Dev-UD, we manually inspected the predictions and observed that the Dev-SR outputs were less grammatical than those made for the Dev-UD data. We investigated the is-sue and discovered that the morphological compo-nent worked as expected, but the syntactic ordering module was flawed. The proposed method’s per-formance varies depending on the children nodes’ order returned by the BFS procedure (line 4 of
Al-gorithm1). Figure6shows an example where our
right
’s folks . That ,
Figure 6: An example sentence which poses a chal-lenge to our system: “That ’s right , folks .”
system fails.
It is easier to determine the order of node’s chil-dren starting with content words and then inserting punctuation signs; if it is the other way round, or-dering tokens becomes harder. As mentioned in
Section3, we have used the original UD training
and development data which contains token infor-mation in the natural order of token occurrence in the sentences. However, in the shared task data the word order information was removed by random-ized scrambling of the tokens, which made it harder for the syntactic linearizer to make predictions on Dev-SR and Test-SR. Unfortunately, we did not anticipate that this will have such a great influence on the prediction capabilities of the proposed ap-proach. We plan to investigate ways of improving it in future.
6 Discussion and Future Work
[image:8.595.357.474.229.282.2]Language
BLEU ar cs en es fi fr it nl pt ru
Dev-UD 0.757 0.782 0.862 0.816 0.701 0.800 0.805 0.733 0.888 0.796
Dev-SR 0.148 0.250 0.291 0.332 0.230 0.244 0.225 0.221 0.261 0.34
Test-SR 0.162 0.251 0.296 0.322 0.233 0.205 0.236 0.227 0.246 0.343
EDIST
Dev-UD 0.854 0.840 0.909 0.851 0.808 0.868 0.837 0.824 0.922 0.835
Dev-SR 0.192 0.239 0.359 0.274 0.294 0.270 0.258 0.252 0.343 0.318
Test-SR 0.444 0.357 0.659 0.370 0.412 0.286 0.407 0.482 0.514 0.346
NIST
Dev-UD 12.91 15.79 13.64 14.47 12.44 13.63 12.48 11.85 12.78 15.5
Dev-SR 6.64 10.61 9.40 10.23 9.35 8.68 7.73 8.61 7.76 12.94
[image:9.595.140.456.62.214.2]Test-SR 6.94 10.74 9.58 10.21 9.36 7.21 7.60 8.64 7.54 13.06
Table 5: Final metric evaluation results of the system pipeline. Dev-UD denotes the development set of the original UD dataset. Dev-SR and Test-SR is the data provided by the organizers (with scrambled lemmas).
A more principled approach would be to define an adaptive model which encodes some notion of processing preference: given a set of tokens, the system should first make predictions it is most con-fident about, similar to easy-first dependency pars-ing algorithm (Goldberg and Elhadad,2010) or
im-itation learning methods (Lampouras and Vlachos,
2016).
Another limitation of the proposed method is its inability to handle non-projective dependencies. This is a simplification decision we made when designing the algorithm: at each point we assume that the perfect token order can be retrieved by re-cursively ordering head-children subtrees, which excludes long-range crossing dependencies from consideration. By doing so we aggressively prune the search space and simplify the inference proce-dure, but also rule out a smaller class of more com-plex constructions. This might not be a problem for the English UD data, which has a small number of non-projective dependencies. However, according to the empirical study ofNivre(2006), almost 25% of the sentences in the Prague Dependency
Tree-bank of Czech (B¨ohmov´a, Alena and Hajiˇc, Jan
and Hajiˇcov´a, Eva and Hladk´a, Barbora, 2003), and more than 15% in the Danish Dependency
Treebank (Kromann,2003) contain non-projective
dependencies. This implies that for multi-lingual surface realization such an assumption could be too strong.
Finally, another simplification which could be addressed is the decomposition of the prediction process into two separate stages of syntactic order-ing and word inflection. The benefits of joint mor-phological inflection and syntactic ordering have
been previously explored, but we found no easy way of doing so for the proposed approach. Nev-ertheless, it seems like a promising direction to pursue, and we plan to investigate it further.
7 Conclusion
In this paper, we have presented the results of our participation in the Surface Realization Shared Task 2018. We developed a promising method of syntactic ordering; evaluation results on the de-velopment data indicate that once the problem of order-sensitivity is solved, it can be successfully applied as a component in the syntactic realization pipeline.
Acknowledgments
References
Roee Aharoni and Yoav Goldberg. 2017. Morpholog-ical Inflection Generation with Hard Monotonic At-tention. In Proceedings of the 55th Annual Meet-ing of the Association for Computational LMeet-inguistics (Volume 1: Long Papers), pages 2004–2015, Van-couver, Canada. Association for Computational Lin-guistics.
Malin Ahlberg, Markus Forsberg, and Mans Hulden. 2015. Paradigm Classification in Supervised Learn-ing of Morphology. InProceedings of the 2015 Con-ference of the North American Chapter of the Asso-ciation for Computational Linguistics: Human Lan-guage Technologies, pages 1024–1029, Denver, Col-orado. Association for Computational Linguistics.
Dzmitry Bahdanau, Kyunghyun Cho, and Yoshua Bengio. 2014. Neural Machine Translation by Jointly Learning to Align and Translate. CoRR, abs/1409.0473.
Srinivas Bangalore and Owen Rambow. 2000. Exploit-ing a Probabilistic Hierarchical Model for Gener-ation. In Proceedings of the 18th Conference on Computational Linguistics: Volume 1, pages 42–48, Saarbr¨ucken, Germany. Association for Computa-tional Linguistics.
Anja Belz, Mike White, Dominic Espinosa, Eric Kow, Deirdre Hogan, and Amanda Stent. 2011. The First Surface Realisation Shared Task: Overview and Evaluation Results. InProceedings of the Genera-tion Challenges Session at the 13th European Work-shop on Natural Language Generation, pages 217– 226, Nancy, France. Association for Computational Linguistics.
B¨ohmov´a, Alena and Hajiˇc, Jan and Hajiˇcov´a, Eva and Hladk´a, Barbora. 2003. The Prague Dependency Treebank: a Three-level Annotation Scenario, chap-ter 7. Kluwer Academic Publishers.
Bernd Bohnet, Leo Wanner, Simon Mille, and Alicia Burga. 2010. Broad Coverage Multilingual Deep Sentence Generation with a Stochastic Multi-level Realizer. InProceedings of the 23rd International Conference on Computational Linguistics, pages 98– 106, Beijing, China. Association for Computational Linguistics.
John Carroll, Ann Copestake, Dan Flickinger, and Vic-tor Poznanski. 1999. An Efficient Chart GeneraVic-tor for (Semi-)Lexicalist Grammars. InProceedings of the 7th European Workshop on Natural Language Generation, pages 86–95, Toulouse, France.
Kyunghyun Cho, Bart van Merrienboer, Caglar Gul-cehre, Dzmitry Bahdanau, Fethi Bougares, Hol-ger Schwenk, and Yoshua Bengio. 2014. Learn-ing Phrase Representations UsLearn-ing RNN Encoder-decoder for Statistical Machine Translation. In
Proceedings of the 2014 Conference on Empirical Methods in Natural Language Processing (EMNLP),
pages 1724–1734, Doha, Qatar. Association for Computational Linguistics.
George Doddington. 2002. Automatic Evaluation of Machine Translation Quality Using N-gram Co-occurrence Statistics. InProceedings of the Second International Conference on Human Language Tech-nology Research, pages 138–145, San Francisco, CA, USA. Morgan Kaufmann Publishers Inc.
Markus Dreyer and Jason Eisner. 2011. Discovering Morphological Paradigms from Plain Text Using a Dirichlet Process Mixture Model. In Proceedings of the 2011 Conference on Empirical Methods in Natural Language Processing, pages 616–627, Edin-burgh, Scotland, UK. Association for Computational Linguistics.
Greg Durrett and John DeNero. 2013. Supervised Learning of Complete Morphological Paradigms. In
Proceedings of the 2013 Conference of the North American Chapter of the Association for Computa-tional Linguistics: Human Language Technologies, pages 1185–1195, Atlanta, Georgia. Association for Computational Linguistics.
Michael Elhadad and Jacques Robin. 1992. Control-ling Content Realization with Functional Unifica-tion Grammars. InProceedings of the 6th Interna-tional Workshop on Natural Language Generation: Aspects of Automated Natural Language Generation, pages 89–104, London, UK, UK. Springer-Verlag.
Manaal Faruqui, Yulia Tsvetkov, Graham Neubig, and Chris Dyer. 2016. Morphological Inflection Gener-ation Using Character Sequence to Sequence Learn-ing. In Proceedings of the 2016 Conference of the North American Chapter of the Association for Com-putational Linguistics: Human Language Technolo-gies, pages 634–643, San Diego, California. Associ-ation for ComputAssoci-ational Linguistics.
Yoav Goldberg and Michael Elhadad. 2010. An Effi-cient Algorithm for Easy-first Non-directional De-pendency Parsing. In Human Language Technolo-gies: The 2010 Annual Conference of the North American Chapter of the Association for Computa-tional Linguistics, pages 742–750, Los Angeles, Cal-ifornia. Association for Computational Linguistics.
Yuqing Guo, Josef van Genabith, and Haifeng Wang. 2008. Dependency-based N-gram Models for Gen-eral Purpose Sentence Realisation. InProceedings of the 22nd International Conference on Computa-tional Linguistics (COLING 2008), pages 297–304, Manchester, UK. COLING 2008 Organizing Com-mittee.
Ronald M. Kaplan and Martin Kay. 1994. Regular Models of Phonological Rule Systems. Computa-tional Linguistics, 20(3):331–378.
Kimmo Koskenniemi. 1983. Two-level Morphology: a General Computational Model for Word-form Recognition and Production. Publications, 11:1– 160.
Matthias Trautner Kromann. 2003. The Danish Depen-dency Treebank and the DTAG Treebank Tool. In
Proceedings of the 2nd Workshop on Treebanks and Linguistic Theories, pages 217–220.
Gerasimos Lampouras and Andreas Vlachos. 2016.
Imitation Learning for Language Generation from Unaligned Data. InProceedings of COLING 2016, the 26th International Conference on Computational Linguistics: Technical Papers, pages 1101–1112, Osaka, Japan. The COLING 2016 Organizing Com-mittee.
Irene Langkilde-Geary. 2002. An Empirical Verifi-cation of Coverage and Correctness for a General-purpose Sentence Generator. In Proceedings of the 2nd International Natural Language Genera-tion Conference, pages 17–24, Harriman, New York, USA.
Yijia Liu, Yue Zhang, Wanxiang Che, and Bing Qin. 2015. Transition-based Syntactic Linearization. In
Proceedings of the 2015 Conference of the North American Chapter of the Association for Computa-tional Linguistics: Human Language Technologies, pages 113–122, Denver, Colorado. Association for Computational Linguistics.
Andrew L. Maas, Awni Y. Hannun, and Andrew Y. Ng. 2013. Rectifier Nonlinearities Improve Neural Net-work Acoustic Models. InICML Workshop on Deep Learning for Audio, Speech and Language Process-ing, Atlanta, USA.
Simon Mille, Anja Belz, Bernd Bohnet, Yvette Gra-ham, Emily Pitler, and Leo Wanner. 2018. The First Multilingual Surface Realisation Shared Task (SR’18): Overview and Evaluation Results. In Pro-ceedings of the 1st Workshop on Multilingual Sur-face Realisation (MSR), 56th Annual Meeting of the Association for Computational Linguistics (ACL), pages 1–10, Melbourne, Australia.
Joakim Nivre. 2006. Constraints on Non-Projective Dependency Parsing. In Proceedings of the 11th Conference of the European Chapter of the Associ-ation for ComputAssoci-ational Linguistics, pages 73–80, Trento, Italy. Association for Computational Lin-guistics.
Kishore Papineni, Salim Roukos, Todd Ward, and Wei-Jing Zhu. 2002. BLEU: a Method for Automatic Evaluation of Machine Translation. InProceedings of 40th Annual Meeting of the Association for Com-putational Linguistics, pages 311–318, Philadelphia, Pennsylvania, USA. Association for Computational Linguistics.
Adam Paszke, Sam Gross, Soumith Chintala, Gregory Chanan, Edward Yang, Zachary DeVito, Zeming Lin, Alban Desmaison, Luca Antiga, and Adam Lerer. 2017. Automatic Differentiation in PyTorch. InNIPS 2017 Workshop Autodiff, Long Beach, Cali-fornia, USA.
Ratish Puduppully, Yue Zhang, and Manish Shrivas-tava. 2016. Transition-based Syntactic Lineariza-tion with Lookahead Features. In Proceedings of the 2016 Conference of the North American Chap-ter of the Association for Computational Linguis-tics: Human Language Technologies, pages 488– 493, San Diego, California. Association for Compu-tational Linguistics.
Ilya Sutskever, Oriol Vinyals, and Quoc V Le. 2014.
Sequence to Sequence Learning with Neural Net-works. In Z. Ghahramani, M. Welling, C. Cortes, N. D. Lawrence, and K. Q. Weinberger, editors, Ad-vances in Neural Information Processing Systems 27, pages 3104–3112. Curran Associates, Inc.
Ramakrishna Vedantam, C. Lawrence Zitnick, and Devi Parikh. 2015. CIDEr: Consensus-based Im-age Description Evaluation. In 2015 IEEE Con-ference on Computer Vision and Pattern Recogni-tion (CVPR), pages 4566–4575, Boston, MA, USA. IEEE Computer Society.
Michael White, Rajakrishnan Rajkumar, and Scott Mar-tin. 2007. Towards Broad Coverage Surface Real-ization with CCG. InProceedings of the 2007 Work-shop on Using Corpora for NLG: Language Genera-tion and Machine TranslaGenera-tion (UCNLG+MT), pages 22–30, Copenhagen, Danmark.
Richard Wicentowski. 2004. Multilingual Noise-robust Supervised Morphological Analysis Using the Wordframe Model. In Proceedings of the 7th Meeting of the ACL Special Interest Group in Com-putational Phonology: Current Themes in Compu-tational Phonology and Morphology, SIGMorPhon ’04, pages 70–77, Barcelona, Spain. Association for Computational Linguistics.
David Yarowsky and Richard Wicentowski. 2000. Min-imally Supervised Morphological Analysis by Mul-timodal Alignment. InProceedings of the 38th An-nual Meeting on Association for Computational Lin-guistics, ACL ’00, pages 207–216, Hong Kong. As-sociation for Computational Linguistics.
A Supplementary Material
A.1 Data Analysis Results
min = 1, max = 16 mean = 3.95, std = 2.33
len(form): 0-5 len(form): 5-10 len(form): 10-15 len(form): 15-20 len(form): 20-25 len(form) > 30
(a) Surface form length distribution.
min = 1, max = 19 mean = 5.12, std = 2.61
len(lemma): 0-5 len(lemma): 5-10 len(lemma): 10-15 len(lemma): 15-20 len(lemma): 20-25 len(lemma) > 30
(b) Lemma length distribution.
min = 1, max = 398 mean = 36.85, std = 27.43
len(snt): 0-10 len(snt): 10-20 len(snt): 20-30 len(snt): 30-40 len(snt): 40-50 len(snt): 50-60 len(snt): 60-70 len(snt) > 70
(c) Sentence length distribution.
min = 0, max = 29 mean = 0.97, std = 1.37
# children: 0-1 # children: 2-3 # children: 4-5 # children: 6-7 # children: 8-9 # children: > 10
(d) Branching factor distribution.
min = 1, max = 41 mean = 1.71, std = 1.70
len(lemma) == 1 len(lemma) == 2 len(lemma) == 3 len(lemma) == 4 len(lemma) > 4
[image:12.595.79.522.106.337.2](e) Lemma-to-form ratio.
Figure 7: Data statistics computed for the Arabic data.
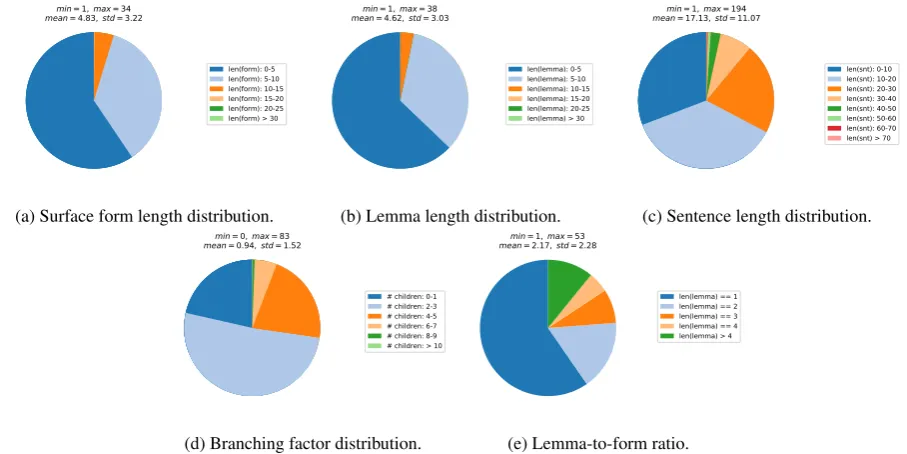
min = 1, max = 34 mean = 4.83, std = 3.22
len(form): 0-5 len(form): 5-10 len(form): 10-15 len(form): 15-20 len(form): 20-25 len(form) > 30
(a) Surface form length distribution.
min = 1, max = 38 mean = 4.62, std = 3.03
len(lemma): 0-5 len(lemma): 5-10 len(lemma): 10-15 len(lemma): 15-20 len(lemma): 20-25 len(lemma) > 30
(b) Lemma length distribution.
min = 1, max = 194 mean = 17.13, std = 11.07
len(snt): 0-10 len(snt): 10-20 len(snt): 20-30 len(snt): 30-40 len(snt): 40-50 len(snt): 50-60 len(snt): 60-70 len(snt) > 70
(c) Sentence length distribution.
min = 0, max = 83 mean = 0.94, std = 1.52
# children: 0-1 # children: 2-3 # children: 4-5 # children: 6-7 # children: 8-9 # children: > 10
(d) Branching factor distribution.
min = 1, max = 53 mean = 2.17, std = 2.28
len(lemma) == 1 len(lemma) == 2 len(lemma) == 3 len(lemma) == 4 len(lemma) > 4
[image:12.595.73.527.464.691.2](e) Lemma-to-form ratio.
min = 1, max = 140 mean = 4.06, std = 3.04
len(form): 0-5 len(form): 5-10 len(form): 10-15 len(form): 15-20 len(form): 20-25 len(form) > 30
(a) Surface form length distribution.
min = 1, max = 140 mean = 3.90, std = 2.96
len(lemma): 0-5 len(lemma): 5-10 len(lemma): 10-15 len(lemma): 15-20 len(lemma): 20-25 len(lemma) > 30
(b) Lemma length distribution.
min = 1, max = 159 mean = 16.31, std = 12.40
len(snt): 0-10 len(snt): 10-20 len(snt): 20-30 len(snt): 30-40 len(snt): 40-50 len(snt): 50-60 len(snt): 60-70 len(snt) > 70
(c) Sentence length distribution.
min = 0, max = 19 mean = 0.94, std = 1.67
# children: 0-1 # children: 2-3 # children: 4-5 # children: 6-7 # children: 8-9 # children: > 10
(d) Branching factor distribution.
min = 1, max = 18 mean = 1.24, std = 0.64
len(lemma) == 1 len(lemma) == 2 len(lemma) == 3 len(lemma) == 4 len(lemma) > 4
[image:13.595.80.525.106.335.2](e) Lemma-to-form ratio.
Figure 9: Data statistics computed for the English data.
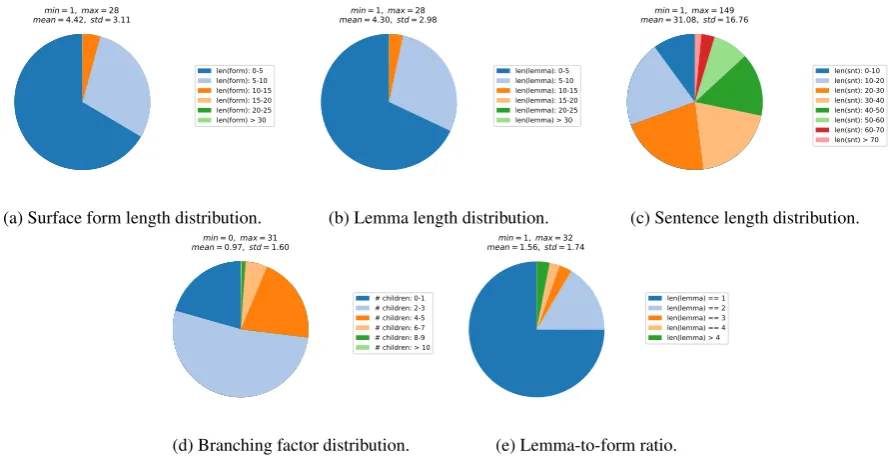
min = 1, max = 28 mean = 4.42, std = 3.11
len(form): 0-5 len(form): 5-10 len(form): 10-15 len(form): 15-20 len(form): 20-25 len(form) > 30
(a) Surface form length distribution.
min = 1, max = 28 mean = 4.30, std = 2.98
len(lemma): 0-5 len(lemma): 5-10 len(lemma): 10-15 len(lemma): 15-20 len(lemma): 20-25 len(lemma) > 30
(b) Lemma length distribution.
min = 1, max = 149 mean = 31.08, std = 16.76
len(snt): 0-10 len(snt): 10-20 len(snt): 20-30 len(snt): 30-40 len(snt): 40-50 len(snt): 50-60 len(snt): 60-70 len(snt) > 70
(c) Sentence length distribution.
min = 0, max = 31 mean = 0.97, std = 1.60
# children: 0-1 # children: 2-3 # children: 4-5 # children: 6-7 # children: 8-9 # children: > 10
(d) Branching factor distribution.
min = 1, max = 32 mean = 1.56, std = 1.74
len(lemma) == 1 len(lemma) == 2 len(lemma) == 3 len(lemma) == 4 len(lemma) > 4
[image:13.595.79.525.463.691.2](e) Lemma-to-form ratio.
min = 1, max = 44 mean = 6.49, std = 4.29
len(form): 0-5 len(form): 5-10 len(form): 10-15 len(form): 15-20 len(form): 20-25 len(form) > 30
(a) Surface form length distribution.
min = 1, max = 44 mean = 5.73, std = 3.85
len(lemma): 0-5 len(lemma): 5-10 len(lemma): 10-15 len(lemma): 15-20 len(lemma): 20-25 len(lemma) > 30
(b) Lemma length distribution.
min = 1, max = 238 mean = 13.31, std = 9.48
len(snt): 0-10 len(snt): 10-20 len(snt): 20-30 len(snt): 30-40 len(snt): 40-50 len(snt): 50-60 len(snt): 60-70 len(snt) > 70
(c) Sentence length distribution.
min = 0, max = 33 mean = 0.92, std = 1.56
# children: 0-1 # children: 2-3 # children: 4-5 # children: 6-7 # children: 8-9 # children: > 10
(d) Branching factor distribution.
min = 1, max = 133 mean = 2.05, std = 3.16
len(lemma) == 1 len(lemma) == 2 len(lemma) == 3 len(lemma) == 4 len(lemma) > 4
[image:14.595.83.525.106.334.2](e) Lemma-to-form ratio.
Figure 11: Data statistics computed for the Finnish data.
min = 1, max = 62 mean = 4.33, std = 3.10
len(form): 0-5 len(form): 5-10 len(form): 10-15 len(form): 15-20 len(form): 20-25 len(form) > 30
(a) Surface form length distribution.
min = 1, max = 62 mean = 4.27, std = 3.03
len(lemma): 0-5 len(lemma): 5-10 len(lemma): 10-15 len(lemma): 15-20 len(lemma): 20-25 len(lemma) > 30
(b) Lemma length distribution.
min = 2, max = 392 mean = 24.49, std = 13.75
len(snt): 0-10 len(snt): 10-20 len(snt): 20-30 len(snt): 30-40 len(snt): 40-50 len(snt): 50-60 len(snt): 60-70 len(snt) > 70
(c) Sentence length distribution.
min = 0, max = 34 mean = 0.96, std = 1.65
# children: 0-1 # children: 2-3 # children: 4-5 # children: 6-7 # children: 8-9 # children: > 10
(d) Branching factor distribution.
min = 1, max = 37 mean = 1.34, std = 1.19
len(lemma) == 1 len(lemma) == 2 len(lemma) == 3 len(lemma) == 4 len(lemma) > 4
[image:14.595.78.525.463.691.2](e) Lemma-to-form ratio.
min = 1, max = 60 mean = 4.33, std = 3.19
len(form): 0-5 len(form): 5-10 len(form): 10-15 len(form): 15-20 len(form): 20-25 len(form) > 30
(a) Surface form length distribution.
min = 1, max = 60 mean = 4.49, std = 3.18
len(lemma): 0-5 len(lemma): 5-10 len(lemma): 10-15 len(lemma): 15-20 len(lemma): 20-25 len(lemma) > 30
(b) Lemma length distribution.
min = 1, max = 310 mean = 21.09, std = 15.41
len(snt): 0-10 len(snt): 10-20 len(snt): 20-30 len(snt): 30-40 len(snt): 40-50 len(snt): 50-60 len(snt): 60-70 len(snt) > 70
(c) Sentence length distribution.
min = 0, max = 35 mean = 0.95, std = 1.58
# children: 0-1 # children: 2-3 # children: 4-5 # children: 6-7 # children: 8-9 # children: > 10
(d) Branching factor distribution.
min = 1, max = 40 mean = 1.54, std = 1.68
len(lemma) == 1 len(lemma) == 2 len(lemma) == 3 len(lemma) == 4 len(lemma) > 4
[image:15.595.76.525.105.334.2](e) Lemma-to-form ratio.
Figure 13: Data statistics computed for the Italian data.
min = 1, max = 57 mean = 4.70, std = 3.30
len(form): 0-5 len(form): 5-10 len(form): 10-15 len(form): 15-20 len(form): 20-25 len(form) > 30
(a) Surface form length distribution.
min = 1, max = 57 mean = 4.29, std = 2.86
len(lemma): 0-5 len(lemma): 5-10 len(lemma): 10-15 len(lemma): 15-20 len(lemma): 20-25 len(lemma) > 30
(b) Lemma length distribution.
min = 1, max = 74 mean = 15.12, std = 10.15
len(snt): 0-10 len(snt): 10-20 len(snt): 20-30 len(snt): 30-40 len(snt): 40-50 len(snt): 50-60 len(snt): 60-70 len(snt) > 70
(c) Sentence length distribution.
min = 0, max = 30 mean = 0.93, std = 1.62
# children: 0-1 # children: 2-3 # children: 4-5 # children: 6-7 # children: 8-9 # children: > 10
(d) Branching factor distribution.
min = 1, max = 53 mean = 1.41, std = 1.49
len(lemma) == 1 len(lemma) == 2 len(lemma) == 3 len(lemma) == 4 len(lemma) > 4
[image:15.595.82.525.464.692.2](e) Lemma-to-form ratio.
min = 1, max = 25 mean = 4.15, std = 3.20
len(form): 0-5 len(form): 5-10 len(form): 10-15 len(form): 15-20 len(form): 20-25 len(form) > 30
(a) Surface form length distribution.
min = 1, max = 25 mean = 4.02, std = 3.09
len(lemma): 0-5 len(lemma): 5-10 len(lemma): 10-15 len(lemma): 15-20 len(lemma): 20-25 len(lemma) > 30
(b) Lemma length distribution.
min = 1, max = 201 mean = 24.82, std = 16.93
len(snt): 0-10 len(snt): 10-20 len(snt): 20-30 len(snt): 30-40 len(snt): 40-50 len(snt): 50-60 len(snt): 60-70 len(snt) > 70
(c) Sentence length distribution.
min = 0, max = 21 mean = 0.96, std = 1.59
# children: 0-1 # children: 2-3 # children: 4-5 # children: 6-7 # children: 8-9 # children: > 10
(d) Branching factor distribution.
min = 1, max = 34 mean = 1.48, std = 1.58
len(lemma) == 1 len(lemma) == 2 len(lemma) == 3 len(lemma) == 4 len(lemma) > 4
[image:16.595.76.525.105.334.2](e) Lemma-to-form ratio.
Figure 15: Data statistics computed for the Portuguese data.
min = 1, max = 47 mean = 5.13, std = 3.74
len(form): 0-5 len(form): 5-10 len(form): 10-15 len(form): 15-20 len(form): 20-25 len(form) > 30
(a) Surface form length distribution.
min = 1, max = 46 mean = 5.06, std = 3.71
len(lemma): 0-5 len(lemma): 5-10 len(lemma): 10-15 len(lemma): 15-20 len(lemma): 20-25 len(lemma) > 30
(b) Lemma length distribution.
min = 2, max = 205 mean = 17.82, std = 10.79
len(snt): 0-10 len(snt): 10-20 len(snt): 20-30 len(snt): 30-40 len(snt): 40-50 len(snt): 50-60 len(snt): 60-70 len(snt) > 70
(c) Sentence length distribution.
min = 0, max = 19 mean = 0.94, std = 1.35
# children: 0-1 # children: 2-3 # children: 4-5 # children: 6-7 # children: 8-9 # children: > 10
(d) Branching factor distribution.
min = 1, max = 60 mean = 2.71, std = 3.50
len(lemma) == 1 len(lemma) == 2 len(lemma) == 3 len(lemma) == 4 len(lemma) > 4
[image:16.595.70.527.463.688.2](e) Lemma-to-form ratio.