Munich Personal RePEc Archive
Body Weight and Hypertension Risk in a
Developing Country
Dang, Thang
Department of Economics and Related Studies, University of York,
School of Economics, University of Economics Ho Chi Minh City
(UEH)
6 December 2017
Body Weight and Hypertension Risk in a Developing Country
Thang Danga,b,*
December 2017
Abstract. This study provides a first causal inference of the link between body weight and the
risk of hypertension among adults in a developing country, Vietnam. The study uses
biological offspring’s body weight as an instrument for exogenous changes in parents’ body
weight to address the potential problem of endogeneity and applies the instrumental variable
approach to estimate the relationship of interest. The paper finds that on average an addition
BMI unit causally increases the likelihood of being hypertensive by about 5.1–7.3% points
for men and 5.6–8.2% points for women. The paper also shows that the impacts of body
weight on the risk of hypertension are different with various age intervals. Furthermore,
overweight or obesity causally enlarges the risk of hypertension compared to underweight or
normal weight.
Keywords: Body weight; Hypertension; Causal effect; Vietnam
JEL Classifications: I1, I14, I18
a
Department of Economics and Related Studies, University of York, United Kingdom
b
School of Economics, University of Economics Ho Chi Minh City (UEH), Vietnam
*
Corresponding author: Department of Economics and Related Studies, University of York,
Heslington, York, YO10 5DD, UK. E-mail address: thang.dang@thangdang.org (Thang
1. Introduction
The existing literature indicates that there is a relationship between body weight and the
risk of hypertension. In particular, body mass index a common measure of body weight is
strongly and positively correlated with the risk of hypertension in many countries such as
Argentina (Stray-Pedersen et al., 2009), Norway (Stray-Pedersen et al., 2009), the United
States (Kumanyika, 1989; Shihab et al., 2012), China (Li et al., 2017), Iran (Poorolajal et al.,
2016), Japan (Lee et al., 2004; Jiang et al., 2003; Nurdiantami et al., 2017), Indonesia (Tuan
et al., 2009) and Vietnam (Tuan et al., 2009). For example, Li et al. (2017) find that
compared to an individual with normal weight, individuals with overweight and obesity are
more likely to be hypertensive by roughly double and triple than a normal individual in
China. Moreover, the findings remain apparently even after controlling for highlighting
characteristics of individuals, lifestyles and family backgrounds as well.
Yet, it is indispensable to raise a question whether the difference in the risk of
hypertension due to body weight is causally reliable. The answer relies on what really drives
the observed difference. To the extent, the difference probably comes from disparities in
body weight or other unobservable determinants that are also related to hypertension risk. If
this is a case, the estimate suggests that observed correlations may indicate unobserved
differences and not a causal relationship between body weight and hypertension risk. A key
limitation of previous studies is that they provide the estimates of the correlation between
body weight and hypertension rather than the estimates of the causal impacts.
A fundamental challenge with identifying the causal effect of body weight on
hypertension risk is that body weight is likely connected with many latent factors that may be
related to hypertension risk such as dietary habits. Following Cawley and Meyerhoefer
body mass index as an instrument for the source of exogenous variation on observations’
body weight and estimate the causal link between body weight and hypertension risk among
adults using a nationally representative dataset from Vietnam.
High blood pressure has been increasingly recognized as the key factor of dangerous
health problems such as heart attack and failure, stroke, kidney diseases, vision loss, sexual
dysfunction, angina, peripheral artery disease and premature mortality, that apparently
threaten human health and quality of life (Kearney et al., 2005; Mohammad et al., 2017). An
estimated figure by Mills et al. (2016) using data from 90 countries indicates that the global
prevalence of hypertension is roughly 1.39 billion people, equivalently 31% of total adults
over the world at the time of 2010. Moreover, the hypertension rate tends to increase over
time, for instance, 5.2% between 2000 and 2010. Regarding the consequence, hypertension
annually accounts for an estimated 9.4 million of deaths around the world (Lim et al., 2012).
Therefore, the study of the causal impact of body weight on hypertension is very
important not only for the insightful understanding of socio-economic factors of hypertension
but also for the related interventions, for example, dietary strategy and nutrition to improve
the situation. Additionally, this line of research is even more vital in the context of the
growing prevalence of overweight and obesity worldwide (Gakidou, 2014). Such an
increasing pattern of overweight and obesity have been identified as a global epidemic that is
a major problem facing healthcare systems worldwide (World Health Organization, 2017).
Furthermore, the burgeoning prevalence of overweight and obesity is regarded as one of the
most hazardous factors linking with the widespread expansion of hypertensive population
over the world (Seravallea and Grassi, 2017; Rahmouni et al., 2005).
The prevalence of hypertension is even larger in developing countries than developed
counterparts. Roughly 1.04 billion out of the total 1.39 billion hypertensives comes from low-
are less efficient in addressing for an increasing prevalence of hypertension because of low
awareness, moderate treatment and decreased controlling ability (Mills et al., 2016). This
study hence significantly provides more evidence on the causal link between body weight and
hypertension from developing countries.
This paper contributes to the literature of socio-economic factors of hypertension by
providing a causal inference of the association between body weight and the risk of
hypertension. The paper finds that on average an addition BMI unit causally increases the
likelihood of being hypertensive by about 5.1–7.3% points for men and 5.6–8.2% points for
women. The paper also indicates that the impacts of body weight on the risk of hypertension
are different with various age intervals. Moreover, overweight or obesity substantially
contributes the risk of hypertension in a comparison with under or normal weight.
The remainder of this paper is structured as follows. Section 2 presents the estimation
methods while section 3 discusses data and the sample for the analysis. Next, section 4 shows
the empirical results with main results and the results of robustness check while section 5
provides some further analysis including heterogeneity and the impact of overweight or
obesity. Finally, section 6 discusses the results and makes some concluding remarks.
2. Estimation methods
The relationship between body weight and hypertension risk is typically estimated using
the following equation:
𝐻𝑦𝑝𝑒𝑟𝑡𝑒𝑛𝑠𝑖𝑜𝑛+ = 𝛼.+ 𝛼0𝐵𝑜𝑑𝑦𝑤𝑒𝑖𝑔ℎ𝑡+ + 𝛼6𝑋+ + 𝜀+ (1)
where 𝐻𝑦𝑝𝑒𝑟𝑡𝑒𝑛𝑠𝑖𝑜𝑛+ is the probability of hypertension for the individual 𝑖; 𝐵𝑜𝑑𝑦𝑤𝑒𝑖𝑔ℎ𝑡+
is the body weight that is measured by body mass index (BMI); 𝑋+ is a vector of control
insurance status, schooling years, and dummies for urban and eight geographic regions; and
𝜀+ is an error term.
However, the OLS estimator using equation (1) merely produces the estimate of the
association between body weight and hypertension risk rather than the reliable estimate of the
causal effect. This is likely because there exist unobservable characteristics related to an
individual that jointly determine body weight and hypertension risk. In other words, the
endogeneity problem is a threat to identification for the estimation. To overcome the
endogeneity problem, this paper uses biological offspring’s body mass index-for-age z-scores
(BAZ) as an instrument for exogenous changes in one’s body weight and estimate the causal
effect of interest using the following 2SLS procedure:
𝐵𝑀𝐼+ = 𝛽.+ 𝛽0𝑂𝑓𝑓𝑠𝑝𝑟𝑖𝑛𝑔𝐵𝐴𝑍++ 𝛽6𝑋+ + 𝜖+ (2)
𝐻𝑦𝑝𝑒𝑟𝑡𝑒𝑛𝑠𝑖𝑜𝑛+ = 𝛾.+ 𝛾0𝐵𝑀𝐼+ + 𝛾6𝑋+ + 𝜁+ (3)
where 𝑂𝑓𝑓𝑠𝑝𝑟𝑖𝑛𝑔𝐵𝐴𝑍+ which is BAZ of the biological child of the individual 𝑖 is the
instrumental variable for body weight. While the equation (2) indicates the first stage
regression of body weight on the instrument, the equation (3) presents the regression of
outcomes of interest on the predicted body weight for the individual 𝑖 (𝐵𝑀𝐼+) that is
calculated using the first stage. The coefficient 𝛾0 that is the parameter of interest captures the
causal effect of body weight on hypertension risk. In this study, the estimated results using
both non-IV and IV estimators are reported. For the non-IV estimator, the paper applies the
Probit model for the non-IV estimator while the paper employs the IV-Probit model as the IV
estimator.
Using a biological relative’s body weight as the IV for the respondent’s body weight is a
recently used strategy to estimate the causal effect of body weight, overweight and obesity in
et al., 2009). In principle, the IV has to satisfy two following requirements. Firstly, the IV
must be a powerful predictor of the explanatory variable. In this case, the body weight of a
biological relative can be used to strongly predict the body weight of the respondent because
evidence from human biology and medicine shows that genetic factors can originally explain
the variation in human body weight (Barsh et al., 2000; Comuzzie and Allison, 1998).
Furthermore, all values of the F-statistic in the first stage regressions in this study are over
the traditional minimum standard value of 10.1 Therefore, offspring’s BAZ can be used as a
powerful predictor of parents’ body weightin this study (Stock et al., 2002).
Secondly, the requirement of validity indicates that the IV has to be uncorrelated with the
residual term in the second stage regression. This study arguably assumes that a child’s body
weight is not correlated with parents’ residual hypertension after controlling for projected
body weight of parents and observed characteristics. The rationale for this assumption stems
from consistent evidence on undetectable and ignorable impacts of a joint family
environment on body weight2 for individuals living in same households such as parents and
biological children that have been revealed from the genetic and medical literature
(Haberstick et al., 2010; Hewitt, 1997; Grilo and Pogue-Geile, 1991; Maes et al., 1997;
Nelson et al., 2006; Wardle et al., 2008). This argument for the validity of employing a
biological relative’s body weight as the IV for the respondent’s body weight to address the
endogeneity of body weight has been used in recent studies (Biener et al., 2017; Cawley,
1
The F-statistic values for the first stage regression are specifically presented in the section
of results.
2
One can argue that the body weight of both parents and biological children are jointly
determined by a shared living environment which is also directly related to parents’
2004; Cawley and Meyerhoefer, 2012; Doherty et al., 2017; Grossbard and Mukhopadhyay,
2017).3
3. Data
This paper uses data from the Vietnam National Health Survey (VNHS) of 2001-2002.
The VNHS is a nationally representative survey on health that consists of roughly 158,000
individuals from 36,000 households across the country. The survey was sampled based on the
Population Census of 1999. Anthropometric information was collected from the survey is
used to construct body mass index (BMI) that is the adopted measure of body weight for
adults. BMI (kg/m2) is defined as 𝑤𝑒𝑖𝑔ℎ𝑡/ℎ𝑒𝑖𝑔ℎ𝑡6 in which weight is measured in
kilograms (kg) and height is measured in meters (m).
The paper takes information on blood pressure to construct the variable of hypertension
risk. Blood pressure measures include systolic blood pressure (SBP) and diastolic blood
pressure (DBP). Both SBP and DBP were measured three times using medical tools with the
aim to minimize the measurement error. SBP and DBP, which are used in this study, are the
average values. The risk of hypertension is defined as the probability of for an individual to
be hypertensive that takes a value of 1 if average SBP≥140 or/and average DBP≥90, and 0
otherwise. Importantly, the previous literature of the causal impacts of body weight indicates
that the estimates using data from self-reported weight and height are likely biased due to
3
Cawley and Meyerhoefer (2012) further conduct a falsification test for the validity of the IV
(biological children’s body weight) by using step-children’s body weight instead and show
that step-children’s body weight is not a significant predictor of the respondents’ weight and
measurement error (Burkhauser and Cawley, 2008). Therefore information on
anthropometrics and blood pressure independently measured using medical tools by
enumerators rather than self-reported information from respondents in the VNHS
significantly allows this paper to avoid the potential bias in the measurement of body weight
and hypertension.
The paper also uses anthropometric information (weight and height) for children to
construct the instrumental variable (IV). The IV is offspring’s body mass index-for-age
z-scores (BAZ). BAZ is calculated using the 2007 World Health Organization (WHO) growth
reference for children aged between 5 and 19 (de Onis et al., 2007). Using BAZ allows us to
address the problem of age-induced variation in BMI. Moreover, because BAZ for children
aged under 5 and children aged 5–19 are calculated using different reference growth groups4,
this study only uses BAZ for children aged 5–19 as the IV for parents’ body weight. The
main reason why this study chooses the 5–9 group rather than the under 5 group is because
the sample size is larger with parents having biological children aged 5-9 than with parents
only having biological children aged under 5.
The final samples for this study’s analysis include (i) 24,678 pairs of father-offspring,
and (ii) 26,112 pairs of mother-offspring. When using father-offspring or mother-offspring
samples, the paper uses biological children’s BAZ as an instrumental variable in general.
Moreover, the paper also estimates the sub-samples with pairs of father-son (12,698
observations), father-daughter (11,980 observations), mother-son (13,437 observations) and
mother-daughter (12,675 observations). Table 1 presents summary statistics of the variables
for these samples. The rates of hypertension from all samples are around 16.7% for men
4
BAZ for children aged under 5 is calculated using the 2006 WHO growth standards for
while the corresponding figures are nearby 7.8% for women’s samples. The mean ages from
all samples for men and women are roughly 40 and 38 years old.
4. Empirical results
Main results
Table 2 and 3 respectively present the main marginal coefficients of the causal impact of
BMI on the likelihood of hypertension for men and women. The paper uses both the Probit
and IV-Probit models and three samples (the full sample with parent-offspring pairs, one
sub-sample with parent-son pairs, and one sub-sub-sample with parent-daughter pairs) to produce the
estimates of interest. While the Probit model only estimates the full sample, the IV-Probit
model estimates the full sample and two sub-samples. Moreover, the set of control variables
for the baseline specification includes age, age squared, dummy for married, dummy for the
ethnic majority, dummy for health insurance, schooling years, dummy for urban areas, and
dummies for eight geographic regions in Vietnam.
Table 2 shows the marginal effects of men’s body weight on the risk of hypertension.
When the Probit model is used for the estimation using the full sample, the paper finds that
BMI causally increases the probability of hypertension by about 1.8% points for an additional
unit of BMI (kg/m2) as shown in column 1. The coefficient is statistically significant at 1%.
When the IV-Probit model is applied, the paper also finds the positive impacts of men’s
BMI on the likelihood of hypertension. However, the impacts are only statistically significant
with the full sample (column 2) and the sub-sample of father-daughter pairs at 1% whereas
the coefficient estimated using the sub-sample of father-son pairs loses its statistical
significance at any conventional level. In particular, a man having one more BMI is more
and daughters’ BAZ as the IV (column 2). The marginal impact is even statistically larger
when the paper estimates the sub-sample that only daughter’s BAZ is used for the IV with
7.3% points (column 4). These results indicate that the estimates estimated using the Probit
estimator are likely downward biased compared to those estimated by the IV-Probit
estimator. The values of the F-statistic for the first stage regressions in Table 2 range between
619 and 1246.
The paper also finds the positive impacts of body weight on the possibility of
hypertension among Vietnamese women. The marginal coefficients of the effect are
presented in Table 3. By estimating the Probit model and the full sample, the paper shows
that an extra BMI unit increases the probability of hypertension by approximately 1% points
for a Vietnamese female (column 1). This estimate is statistically significant at 1%.
Meanwhile, the estimates using the IV-Probit model indicate that an additional BMI unit
is causally linked to increases in the rate of hypertension for a Vietnamese woman by about
5.6% points using the full sample (column 2) and 8.2% points using the sub-sample of
mother-son pairs (column 3) with a 1% level of statistical significance. Using IV-Probit to
estimate the sub-sample of mother-daughter pairs produce a positive impact of women’s BMI
on the likelihood of hypertension but the estimate is statistically insignificant at any
conventional level (column 4). The values of the F-statistic for the first stage regressions in
Table 3 range between 717 and 1448.
Robustness checks
This paper implements some robustness checks for the main results by using various sets
of control variables for the econometric specification. In particular, there are three different
(specification 1), (ii) a set that removes dummy for urban areas, and dummies for eight
geographic regions from the baseline set (specification 2), and (iii) a set that removes all
control variables from the baseline set (specification 3). The results of robustness checks are
specifically presented in Tables 4 and 5 corresponding for men and women. Generally, the
paper finds that the main estimates using the baseline specification are highly robust to other
various specifications in terms of both the signs of the effect and the magnitude.
Table 4 demonstrates the robustness checks for men. Column 1 shows that the marginal
estimates using the Probit estimator are between 1.7–1.8% points for three various
specifications. The coefficients are statistically significant at 1%. This result is same as the
main marginal estimate using the same estimator. For the estimates using the IV estimator,
the paper finds the most similar patterns as the main estimator. In particular, when both sons’
and daughters’ BAZ are used as the IV for men’s body weight, the estimates in column 2
indicate that one more BMI unit increases the probability of hypertension by 5.5% points,
5.9% points and 7.0% points corresponding to the use of specifications 1, 2 and 3. The
marginal coefficient using the baseline specification is 5.1% points (column 2 of Table 2).
The IV-Probit estimators with sons’ BAZ as the IV produces the marginal coefficients
with 3.0% points (specification 1), 3.9% points (specification 2) and 4.8% points
(specification 3) as demonstrated in column 3 Table 4. While the coefficient using
specification 1 loses its statistical significance as the main estimate using the baseline
specification (column 3 of Table 2), the coefficients using specifications 2 and 3 are
statistically significant at 10% and 5% respectively.
Finally, the estimates in column 4 of Table 4 for the impact of men’s body weight on the
likelihood of hypertension using daughters’ BZA as the IV are all statistically significant at
1% for three specifications. In terms of the magnitude, a male with one more BMI unit tends
points (specification 2) and 9.6% points (specification 3). These results are slightly larger
than the main effect with 7.3% points as indicated in column 4 of Table 2. The values of the
F-statistic for the first stage regressions in Table 4 range between 609 and 1429.
Table 5 presents the robustness estimates for women. The Probit estimates in column 1
indicate that one additional BMI unit is associated with an increase in the probability of
hypertension by about 1.1% points (specification 1), 0.9% points (specification 2) and 1%
points (specification 3). These estimated coefficients are statistically significant at 1%.
When the IV-Probit estimator is used, the marginal effects are roughly robust to the
main estimates. The estimates in column 2 show that with both sons’ and daughters’ BAZ as
the IV the paper finds that a female with one more BMI unit is more likely to have a higher
likelihood of hypertension by approximately 5.8% points (specification 1), 5.1% points
(specification 2) and 5.2% points (specification 3) with a 1% level of statistical significance.
Meanwhile, the marginal effects of one more BMI unit on the likelihood of hypertension
using only sons’ BAZ as the IV for women’s body weight are 7.5% points, 7.3% points and
6.3% points corresponding to the use of specifications 1, 2 and 3 as demonstrated in column
3. The estimated coefficients in column 3 are all statistically significant at 1%.
Column 3 of Table 5 presents the estimated coefficients for the impact of interest when
only daughters’ BAZ is used to instrument for female’s BMI. The paper finds statistically
insignificant results for specifications 1 and 2, except for specification 3 that produces a
marginal impact of 3.9% points with a 1% level of statistical significance. The values of the
F-statistic for the first stage regressions in Table 5 range between 712 and 1672.
5. Further analysis
The effect of body weight on the risk of hypertension may vary with various age
intervals. This section presents the marginal effects of body weight on the probability of
hypertension by age groups. The marginal coefficients for four age groups including (i)
age≤30, (ii) 30<age≤40, (iii) 40<age≤50, and (iv) age>50 are presented in Tables 6 and 7
for male and female respectively.
Table 6 shows the results for men. The results indicate that if Probit model is used, the
association between BMI and the likelihood of hypertension does not vary considerably
among different groups (column 1). In particular, the marginal effects are between 1.7%
points and 1.9% points. However, the impacts are different among various age groups using
the IV approach. Specifically, when sons’ and daughters’ BAZ are used as the IV, the
marginal effects are about 22.3% points for age≤30, 4.6% points for 30<age≤40, and 11.4%
points for age>50. These estimates are statistically significant at 5% or 10% (column 2). The
coefficient for 40<age≤50 loses its statistical significance at any conventional level.
Meanwhile, all coefficients estimated using only sons’ BAZ as the IV (column 3) are
statistically insignificant at any conventional level for any age group as the main estimates.
Finally, the estimates estimated using only daughters’ BAZ as the IV (column 4) show that
the marginal effects for the groups age≤30 and age>50 are 26.9% points with a statistical
significance at 5% and 17.8% points with a statistical significance at 1%, respectively. The
coefficients for the groups 30<age≤40 and 40<age≤50 are statistically insignificant at any
conventional level. These findings indicate that the causal impact of body weight on the risk
of hypertension is largest among youngest and oldest males while the middle group (males
aged between 31 and 40) has the smallest effect. The values of the F-statistic for the first
stage regressions in Table 6 range between 36 and 637.
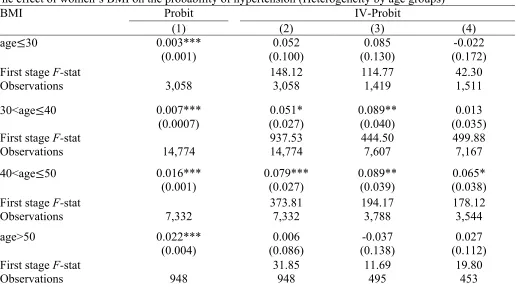
Table 7 gives the coefficients of the marginal effect for women’s various age groups.
0.7% points for 30<age≤40, 1.6% points for 40<age≤50, and 2.2% points for age>50
(column 1). All coefficients in column 1 are statistically significant at 1%. When the IV
estimator is used to produce estimates of interest, the results are changing with different age
groups. The estimated coefficients using sons’ and daughters’ BAZ as the IV in column 2
indicate that the effect is only statistically significant for the groups 30<age≤40 (at 10%) and
40<age≤50 (significant at 1%) with the marginal effects of 5.1% points and 7.8% points
respectively.
For the case that the IV is only sons’ BAZ in column 3, the coefficients for the groups
30<age≤40 and 40<age≤50 are both statistically significant at 5% with the marginal effects
of both 8.9% points whereas the coefficients for other groups lose its statistical significance.
Finally, the coefficients estimated when daughters’ BAZ is used as the IV in column 4 are all
statistically insignificant at any conventional level for most age groups, except for the group
40<age≤50 with the marginal effect of 6.5% points (significant at 5%). The values of the
F-statistic for the first stage regressions in Table 7 range between 12 and 938.
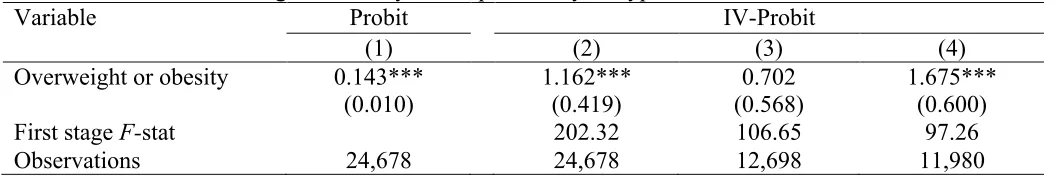
The impact of overweight or obesity on hypertension
Overweight or obesity can also have a distinct impact on hypertension compared to
healthy weight or underweight because the different statuses of BMI are likely to link with
various health risks (Stommel and Schoenborn, 2010). This section provides the estimated
results of the impact of overweight or obesity on the probability of hypertension. This paper
defines a person is overweighted or obese if his or her BMI is equal to or over 25. The
dummy variable takes a value of 1 if overweight or obesity, and 0 otherwise. The estimated
coefficients demonstrate the probability of hypertension for an overweighted or obese person
Generally, the paper finds that overweighted or obese adults have considerable positive
impacts on the risk of hypertension relative to those with under or healthy weight for both
male and female as shown in Tables 8 and 9. The signs and statistical significance of the
impact are totally consistent with the impact of BMI.
Table 8 presents the results for men. The marginal effect estimated using the Probit
model is 14.3% points with a 1% level of statistical significance (column 1). The marginal
effects using the IV in columns 2 and 4 respectively are 116.2% points and 167.5% points.
The estimated coefficients are statistically significant at 1%. Meanwhile, the estimated
coefficient in column 3 is statistically insignificant at any conventional level. The values of
the F-statistic for the first stage regressions in Table 8 range between 97 and 202.
Table 9 shows the estimated coefficients for female. The marginal effect estimated using
the Probit estimator is 8.1% points with a 1% level of statistical significance (column 1).
Meanwhile, the marginal effects estimated using the IV-Probit estimators in columns 2 and 3
are respectively 120.6% points and 187.1% points. These estimated coefficients are
statistically significant at 1%. Meanwhile, the estimated coefficient in column 4 is
statistically insignificant at any conventional level. These findings explicitly indicate that
overweight or obesity is an extremely severe source of the prevalence of hypertension among
Vietnamese adults. The values of the F-statistic for the first stage regressions in Table 9
range between 111 and 256.
6. Discussion and conclusion
While pervasive hypertension has increasingly become a major public health worldwide
especially from developing countries (Kearney et al., 2005), the understanding of the
existing literature of the determinants of hypertension. This study investigates the causal
relationship between body weight and the risk of hypertension using a nationally
representative dataset from a developing country in Asia, Vietnam.
Over last few decades, Vietnam has witnessed a rising rate of hypertensives (Ministry of
Health of Vietnam, 2016). Although the prevalence of hypertension is relatively high among
Vietnamese adults and its consequences in terms of hypertension-induced mortality and
illness are severe, the awareness, the treatment and the control of this non-communicable
disease are comparatively low in this developing country (Do et al., 2015; Son et al., 2012).
Therefore, identifying the causal relationship between key associated factors and
hypertension is generally very crucial for addressing the hypertension prevalence in Vietnam
and other developing countries as well.
This study significantly contributes to the literature of the association between body
weight and the risk of hypertension in some ways. Firstly, this study is one of the first studies
devoted to estimating the causal effect of body weight on the risk of hypertension. The
previous studies identify that body weight is positively linked to the prevalence of
hypertension among other key factors. For example, Tuan et al. (2009) using the VNHS like
this paper find that one increased BMI unit is correlated with higher probabilities of
hypertension by roughly 14% and 16% for Vietnamese men and women respectively. Also,
Do et al. (2015) uses a nationally representative sample from the 2005 Vietnam National
Overweight Survey to show that overweight men and women are more likely to be
hypertensive by about 43% and 29% respectively than those with normal weight or
underweight. However, these results from previous studies naively provide the correlated
estimates rather than the true causal estimates of the association between body weight and the
risk of hypertension because the obtained estimates are produced while there are the
et al., 2017), height (Sohn 2017), early-life conditions (Sotomayor 2013) or even latent
characteristics on the hypertension prevalence. Therefore, while body weight should be
considered as a cause of the risk of hypertension (Francischetti and Genelhu, 2007), it is very
challenging to make causal inference using such estimates.
In a different manner, this study treats body weight as a cause of hypertension and
estimates its causal effect on the prevalence of hypertension by using an IV approach to
address the endogeneity problem. Using the IV approach enables this study to disentangle the
reliable estimates of the causal effect of body weight on the risk of hypertension. The
findings estimated using the IV approach in this study reveal that there is an underestimation
of the impact using the non-IV estimator such as the Probit estimator. Therefore, this study
suggests that previous studies that did not address the potential endogeneity problem of body
weight likely considerably underestimated the impact of body weight on the prevalence of
hypertension. This is the most important contribution that this paper makes.
The key finding is that body weight causally increases the likelihood of hypertension for
both Vietnamese male and female. The marginal effects of an extra BMI unit on the risk of
hypertension are between 5.1–7.3% points for men and 5.6–8.2% points for women. The
statistic summary of the sample in Table 1 shows that while the percentage of hypertensive
among women is only around 7.8%, the corresponding figure for men is about 17% of the
samples. However, the marginal effects of body weight on the prevalence of hypertension are
larger for women than men in Vietnam. The study also finds that the impacts of body weight
on the prevalence of hypertension substantially vary with various age intervals for men and
women as well. Therefore, the implication related to policies for addressing the problem of
high blood pressure can be different with different age groups. In the other hand, the impact
of body weight on the risk of hypertension probably changes among different periods of the
being hypertensive (Francischetti and Genelhu, 2007). Many previous studies show that
overweight and obesity are strongly and considerably correlated to increases in the risk of
high blood pressure in many developing countries, for examples Nurdiantami et al. (2017) for
Indonesia, and Cao et al. (2017) for China. This study confirms the findings from the
literature by providing a causal inference that overweight or obesity causally increases the
probability of hypertension for both men and women compared to under or normal weight.
Furthermore, this study provides more evidence on the same research topic from a
developing country. Developing countries are likely extremely suffered from the epidemic of
hypertension because of both their high and increasing proportion of hypertension but an
unacceptably low capability of awareness, treatments, and controls there. When the causal
link between body weight and the incidence of hypertension is robustly discovered, the
implication for controlling the problem of high blood pressure should be raised in the
developing world. The actions related to the control of body weight through which
hypertension can be restricted include lifestyle changes, nutritional intake, or
pharmacological treatments (Dinh et al., 2017; Francischetti and Genelhu, 2007; Lee et al.,
2004; Sabaka et al., 2017). Hence, the findings from this study meaningfully provide
backgrounds for the public health policies related to the control of overweight and obesity as
a solution to the prevalence of hypertension.
References
Barsh, G.S, Farooqi, I.S., O'Rahilly, S., 2000. Genetics of body-weight regulation. Nature.
404, 644–651.
Biener, A.I., Cawley, J., Meyerhoefer, C., 2017. The Medical Care Costs of Youth Obesity:
Burkhauser, R.V., Cawley, J., 2008. Beyond BMI: The value of more accurate measures of
fatness and obesity in social science research. Journal of Health Economics. 27 (2), 519–
529.
Cao, Z.K., Huang, Y., Yu, H.J., Yuan, S., Tang, B.W., Li, Q.X., Li, X.T., Yang, X.H., He,
Q.Q., 2017. Association between obesity phenotypes and incident hypertension among
Chinese adults: a prospective cohort study. Public Health. 149, 65–70.
Cawley, J., 2004. The Impact of Obesity on Wages. Journal of Human Resources. 39 (2),
451–474.
Cawley, J., Meyerhoefer, C., 2012. The medical care costs of obesity: An instrumental
variables approach. Journal of Health Economics. 31, 219–230.
Comuzzie, A.G., Allison, D.B., 1998. The search for human obesity genes. Science. 280
(5368), 1374–1377.
de Onis, M., Onyango, A.W., Borghi, E., Siyam, A., Nishida, C., Siekmann, J., 2007.
Development of a WHO growth reference for school-aged children and adolescents.
Bulletin of the World Health Organization. 85, 660–667.
Ding, M., Huang, T., Bergholdt, H.K.M., Nordestgaard, B.G., Ellervik, C., Qi, L., 2017.
Dairy consumption, systolic blood pressure, and risk of hypertension: Mendelian
randomization study. BMJ. 356.
Do, H.T.P., Geleijnse, J.M., Le, M.B., Kok, F.J., Feskens, E.J.M., 2015. National Prevalence
and Associated Risk Factors of Hypertension and Prehypertension Among Vietnamese
Adults. American Journal of Hypertension. 28 (1), 89–97.
Doherty, E., Queally, M., Cullinan, J., Gillespie, P., 2017. The impact of childhood
overweight and obesity on healthcare utilisation. Economics and Human Biology. 27,
84–92.
Ediriweera, D.S., Dilina, N., Perera, U., Flores, F., Samita, S., 2017. Risk of low birth weight
on adulthood hypertension - evidence from a tertiary care hospital in a South Asian
country, Sri Lanka: a retrospective cohort study. BMC Public Health, 17, 358.
Forouzanfar, M.H., et al., 2017. Global Burden of Hypertension and Systolic Blood Pressure
Francischetti, E.A., Genelhu, V.A. 2007. Obesity–hypertension: an ongoing pandemic.
International Journal of Clinical Practice. 61 (2), 269–280.
Gakidou, E., et al., 2014. Global, regional, national prevalence of overweight and obesity in
children and adults 1980–2013: a systematic analysis. Lancet. 384, 766–781.
Grilo, C.M., Pogue-Geile, M.F., 1991. The nature of environmental influences on weight and
obesity: a behavioral genetic analysis. Psychological Bulletin. 110 (3), 520–537.
Grossbard, S., Mukhopadhyay, S., 2017. Body-Weight and Women’s Hours of Work: More
Evidence That Marriage Markets Matter. IZA DP No. 10775.
Haberstick, B.C., Lessem, J.M., McQueen, M.B., Boardman, J.D., Hopfer, C.J., Smolen, A.,
Hewitt, J.K., 2010. Stable genes and changing environments: body mass index across
adolescence and young adulthood. Behavior Genetics. 40 (4), 495–504.
Hewitt, J.K., 1997. The genetics of obesity: what have genetic studies told us about the
environment? Behavior Genetics. 27 (4), 353–358.
Jiang, J., Kitano, T., Shono, M., Wakamiya, J., Futatsuka, M., 2003. Serial study on the
association between body mass index and hypertension in rural Japanese. Environmental
Health and Preventive Medicine. 8, 90–94.
Kearney, P.M., Whelton, M., Reynolds, K., Muntner, P., Whelton, P.K., He, J., 2005. Global
burden of hypertension: analysis of worldwide data. Lancet. 365, 217– 223.
Kumanyika, S.K., 1989. The association between obesity and hypertension in blacks. Clinical
Cardiology. 12 (4), IV72-7.
Lee, J.S., Kawakubo, K., Kashihara, H., Mori, K., 2004. Effect of long-term body weight
change on the incidence of hypertension in Japanese men and women. International
Journal of Obesity. 28, 391–395.
Li, W., Wang, D., Wu, C., Shi, O., Zhou, Y., Lu, Z., 2017. The effect of body mass index and
physical activity on hypertension among Chinese middle-aged and older population.
Scientific Reports. 7, 10256.
Lim, S.S., et al., 2012. A comparative risk assessment of burden of disease and injury
attributable to 67 risk factors and risk factor clusters in 21 regions, 1990–2010: a
systematic analysis for the Global Burden of Disease Study 2010. Lancet. 380, 2224–
Maes, H.H.M., Neale, M.C., Eaves, L.J., 1997. Genetic and environmental factors in relative
body weight and human adiposity. Behavior Genetics. 27 (4), 325–351.
Mills, K.T., Bundy, et al., 2016. Global disparities of hypertension prevalence and control: a
systematic analysis of population based studies from 90 countries. Circulation. 134, 441–
450.
Ministry of Health of Vietnam, 2016. Vietnam Health Statistics Yearbook 2016. Vietnam
Ministry of Health, Hanoi.
Nelson, M.C., Gordon-Larsen, P., North, K.E., Adair, L.S., 2006. Body mass index gain, fast
food and physical activity: effects of shared environment over time. Obesity. 14, 701–
709.
Nurdiantami, Y., Watanabe, K., Tanaka, E., Pradono, J., Anme, T., 2017. Association of
general and central obesity with hypertension. Clinical Nutrition. 1–5.
Poorolajal, J., Farbakhsh, F., Mahjub, H., Bidarafsh, A., Babaee, E., 2016. How much excess
body weight, blood sugar, or age can double the risk of hypertension? Public Health.
133, 14–18.
Rahmouni, K., Correia, M.L.G., Haynes, W.G., Mark, A.L., 2005. Obesity-Associated
Hypertension: New Insights into Mechanisms. Hypertension. 45, 9–14.
Sabaka, P., Dukat, A., Gajdosik, J., Bendzala, M., Caprnda, M., Simko, F. 2017. The effects
of body weight loss and gain on arterial hypertension control: an observational
prospective study. European Journal of Medical Research. 22–43.
Seravallea, G., Grassi, G., 2017. Obesity and hypertension. Pharmacological Research. 122,
1–7.
Shihab, H.M., Meoni, L.A, Chu, A.Y, Wang, N-Y., Ford, D.E., Liang, K-Y., Gallo, J.J, Klag,
M.J., 2012. Body Mass Index and Risk of Incident Hypertension Over the Life Course:
The Johns Hopkins Precursors Study. Circulation. 126, 2983–2989.
Smith, G.D., Jonathan, A.C.S., Abigail, F., Per, T., Debbie, A.L., Finn, R., 2009. The
association between BMI and mortality using offspring BMI as an indicator of own BMI:
large intergenerational mortality study. British Medical Journal. 339, b5043.
Sohn, K., 2017. The Association between Height and Hypertension in Indonesia. Economics
Son, P.T., Quang, N.N., Viet, N.L., Khai, P.G., Wall, S., Weinehall, L., Bonita, R., Byass, P.
2012. Prevalence, awareness, treatment and control of hypertension in Vietnam— results
from a national survey. Journal of Human Hypertension. 26, 268–280.
Sotomayor, O., 2013. Fetal and infant origins of diabetes and ill health: Evidence from Puerto
Rico's 1928 and 1932 hurricanes. Economics and Human Biology. 11, 281–293.
Stock, J.H., Wright, J.H., Yogo, M., 2002. A survey of weak instruments and weak
identification in generalized method of moments. Journal of Business and Economic
Statistics. 20(4), 518–529.
Stommel, M., Schoenborn, C.A., 2010. Variations in BMI and prevalence of Health Risks in
Diverse Racial and Ethnic populations. Obesity. 18, 1821–1826.
Stray-Pedersen, M., Helsing, R.M., Gibbons, L., Cormick, G., Holmen, T.L., Vik, T.,
Belizán, J.M., 2009. Weight status and hypertension among adolescent girls in Argentina
and Norway: Data from the ENNyS and HUNT studies. BMC Public Health. 9, 398.
Tuan, N.T., Adair, L.S., Suchindran, C.M., He, K., Popkin, B.M., 2009. The association
between body mass index and hypertension is different between East and Southeast
Asians. American Journal of Clinical Nutrition. 89, 1905–1912.
Wardle, J., Carnell, S., Haworth, C.M.A., Plomin, R., 2008. Evidence for a strong genetic
influence on childhood adiposity despite the force of the obesogenic environment.
American Journal of Clinical Nutrition. 87, 398–404.
World Health Organization, 2006. WHO child growth standards: length/height-for-age,
weight- forage, weight-for-length, weight-for-height and body mass index-for-age:
Methods and development. World Health Organization, Geneva.
World Health Organization, 2017. Obesity and overweight. (accessed 17.10.17)
Table 1
Descriptive statistics of the samples (Means and standard deviations in parentheses are reported)
Variable Men Women
Both Son Daughter Both Son Daughter Hypertension 0.167
(0.373) 0.164 (0.371) 0.169 (0.375) 0.078 (0.268) 0.077 (0.267) 0.078 (0.269)
BMI 20.340
(2.322) 20.315 (2.332) 20.367 (2.310) 20.371 (2.656) 20.350 (2.656) 20.393 (2.655) Overweight or obesity 0.043
(0.203) 0.043 (0.203) 0.043 (0.203) 0.057 (0.231) 0.056 (0.231) 0.057 (0.231) Child BMI-for-age z-scores -1.141
(1.034) -1.164 (1.072) -1.117 (0.991) -1.153 (1.030) -1.174 (1.063) -1.131 (0.993)
Age 40.412
(7.014) 40.391 (6.981) 40.435 (7.049) 37.844 (6.357) 37.875 (6.339) 37.811 (6.377)
Married 0.993
(0.081) 0.993 (0.081) 0.993 (0.080) 0.953 (0.211) 0.952 (0.215) 0.955 (0.208)
Majority 0.810
(0.392) 0.812 (0.391) 0.809 (0.393) 0.851 (0.356) 0.853 (0.354) 0.849 (0.358) Health insurance 0.170
(0.376) 0.170 (0.376) 0.171 (0.376) 0.127 (0.333) 0.129 (0.335) 0.124 (0.330) Schooling years 6.876
(4.377) 6.895 (4.375) 6.856 (4.379) 6.211 (4.352) 6.241 (4.375) 6.179 (4.328)
Urban 0.271
(0.445) 0.273 (0.446) 0.269 (0.443) 0.280 (0.449) 0.284 (0.451) 0.276 (0.447) Red River Delta 0.167
(0.373) 0.170 (0.376) 0.164 (0.370) 0.183 (0.387) 0.186 (0.389) 0.181 (0.385)
Northeast 0.154
(0.361) 0.152 (0.359) 0.156 (0.363) 0.151 (0.358) 0.149 (0.356) 0.153 (0.360)
Northwest 0.049
(0.215) 0.050 (0.218) 0.047 (0.213) 0.038 (0.191) 0.039 (0.193) 0.037 (0.188) North Central Coast 0.126
(0.332) 0.123 (0.329) 0.129 (0.335) 0.135 (0.341) 0.133 (0.339) 0.136 (0.343) South Central Coast 0.097
(0.296) 0.098 (0.298) 0.096 (0.295) 0.101 (0.302) 0.101 (0.302) 0.101 (0.302) Central Highlands 0.088
(0.283) 0.090 (0.286) 0.085 (0.279) 0.079 (0.270) 0.081 (0.273) 0.077 (0.267)
Southeast 0.135
(0.342) 0.133 (0.340) 0.137 (0.344) 0.135 (0.341) 0.134 (0.340) 0.135 (0.342) Mekong River Delta 0.184
Table 2
The effect of men’s BMI on the probability of hypertension (Baseline estimates)
Variable Probit IV-Probit
(1) (2) (3) (4)
BMI 0.018***
(0.001) 0.051*** (0.018) 0.032 (0.024) 0.073*** (0.026)
Age 0.010***
(0.003) 0.044*** (0.011) 0.046*** (0.015) 0.043*** (0.016) Age squared -0.00003
(0.00003) -0.0001 (0.0001) -0.0002 (0.0002) -0.0001 (0.0001)
Married -0.035
(0.026) -0.142 (0.110) -0.158 (0.150) -0.131 (0.162)
Majority -0.007
(0.007) -0.038 (0.030) -0.084* (0.042) 0.015 (0.043) Health insurance 0.0006
(0.007) 0.016 (0.030) 0.046 (0.041) -0.015 (0.043) Schooling years -0.002**
(0.0006) -0.006** (0.003) -0.006 (0.004) -0.006 (0.004)
Urban -0.004
(0.006) 0.001 (0.027) 0.014 (0.037) -0.017 (0.039) Red River Delta 0.005
(0.009) 0.008 (0.037) 0.008 (0.053) -0.009 (0.053) Northeast 0.041***
(0.009) 0.158*** (0.039) 0.149*** (0.054) 0.172*** (0.055) Northwest 0.088***
(0.012) 0.362*** (0.052) 0.355*** (0.072) 0.373*** (0.075) North Central Coast 0.029***
(0.009) 0.110*** (0.038) 0.167*** (0.053) 0.052 (0.055) South Central Coast 0.003
(0.010) 0.002 (0.041) 0.033 (0.057) -0.027 (0.059) Central Highlands 0.097***
(0.009) 0.391*** (0.042) 0.439*** (0.058) 0.338*** (0.059) Southeast 0.046***
(0.008) 0.188*** (0.035) 0.210*** (0.049) 0.164*** (0.049) Mekong River Delta Reference Reference Reference Reference
First stage F-stat 1245.70 633.55 618.73
Observations 24,678 24,678 12,698 11,980
Table 3
The effect of women’s BMI on the probability of hypertension (Baseline estimates)
Variable Probit IV-Probit
(1) (2) (3) (4)
BMI 0.010***
(0.001) 0.056*** (0.019) 0.082*** (0.027) 0.029 (0.025)
Age 0.011***
(0.002) 0.083*** (0.017) 0.095*** (0.024) 0.074*** (0.024) Age squared -0.00005*
(0.00003) -0.0004** (0.0004) -0.0005* (0.0003) -0.0003 (0.0003)
Married -0.014**
(0.007) -0.103** (0.050) -0.145** (0.068) -0.052 (0.073)
Majority 0.002
(0.005) 0.010 (0.040) 0.054 (0.058) -0.028 (0.055) Health insurance -0.010*
(0.005) -0.069* (0.039) -0.138** (0.055) -0.002 (0.055) Schooling years -0.0004
(0.0005) -0.002 (0.003) -0.001 (0.005) -0.004 (0.005)
Urban -0.010***
(0.004) -0.054 (0.035) -0.085* (0.051) -0.020 (0.048) Red River Delta 0.025***
(0.006) 0.165*** (0.047) 0.219*** (0.068) 0.111* (0.066)
Northeast 0.010
(0.006) 0.051 (0.053) 0.102 (0.076) -0.0009 (0.073) Northwest 0.022**
(0.010) 0.150** (0.075) 0.166 (0.107) 0.136 (0.104) North Central Coast 0.013**
(0.006) 0.076 (0.050) 0.173** (0.071) -0.027 (0.071) South Central Coast -0.008
(0.007) -0.074 (0.051) -0.043 (0.074) -0.108 (0.071) Central Highlands 0.056***
(0.006) 0.399*** (0.051) 0.503*** (0.071) 0.292*** (0.072) Southeast -0.016***
(0.006) -0.121*** (0.044) -0.048 (0.062) -0.198*** (0.063) Mekong River Delta Reference Reference Reference Reference
First stage F-stat 1447.53 731.18 716.60
Observations 26,112 26,112 13,437 12,675
Table 4
The effect of men’s BMI on the probability of hypertension (Robustness checks)
BMI Probit IV-Probit
(1) (2) (3) (4)
Specification 1 0.017*** (0.001)
0.055*** (0.018)
0.030 (0.024)
0.084*** (0.026)
First stage F-stat 1228.99 627.61 608.60
Specification 2 0.018*** (0.001)
0.059*** (0.016)
0.039* (0.022)
0.080*** (0.024)
First stage F-stat 1351.55 671.47 691.80
Specification 3 0.017*** (0.001)
0.070*** (0.015)
0.048** (0.021)
0.096*** (0.023)
First stage F-stat 1428.89 725.20 713.17
Observations 24,678 24,678 12,698 11,980
Table 5
The effect of women’s BMI on the probability of hypertension (Robustness checks)
BMI Probit IV-Probit
(1) (2) (3) (4)
Specification 1 0.011*** (0.0006)
0.058*** (0.018)
0.075*** (0.027)
0.039 (0.035)
First stage F-stat 1429.13 718.07 711.73
Specification 2 0.009*** (0.0006)
0.051*** (0.016)
0.073*** (0.023)
0.027 (0.021)
First stage F-stat 1672.49 839.05 831.89
Specification 3 0.010*** (0.0006)
0.052*** (0.016)
0.063*** (0.023)
0.039* (0.022)
First stage F-stat 1665.72 837.87 827.93
Observations 26,112 26,112 13,437 12,675
Table 6
The effect of men’s BMI on the probability of hypertension (Heterogeneity by age groups)
BMI Probit IV-Probit
(1) (2) (3) (4)
age≤30 0.018*** (0.004)
0.223** (0.093)
0.149 (0.136)
0.269** (0.120)
First stage F-stat 76.56 38.42 42.27
Observations 1,218 1,218 615 603
30<age≤40 0.017*** (0.001)
0.046* (0.027)
0.038 (0.034)
0.058 (0.042)
First stage F-stat 637.43 336.86 303.86
Observations 12,404 12,404 6,416 5,988
40<age≤50 0.019*** (0.002)
0.028 (0.027)
0.020 (0.038)
0.030 (0.039)
First stage F-stat 452.01 231.05 226.50
Observations 8,976 8,976 4,623 4,353
age>50 0.019*** (0.004)
0.114** (0.053)
0.040 (0.086)
0.178*** (0.066)
First stage F-stat 90.36 36.24 51.78
Observations 2,080 2,080 1,044 1,036
Table 7
The effect of women’s BMI on the probability of hypertension (Heterogeneity by age groups)
BMI Probit IV-Probit
(1) (2) (3) (4)
age≤30 0.003*** (0.001)
0.052 (0.100)
0.085 (0.130)
-0.022 (0.172)
First stage F-stat 148.12 114.77 42.30
Observations 3,058 3,058 1,419 1,511
30<age≤40 0.007*** (0.0007)
0.051* (0.027)
0.089** (0.040)
0.013 (0.035)
First stage F-stat 937.53 444.50 499.88
Observations 14,774 14,774 7,607 7,167
40<age≤50 0.016*** (0.001)
0.079*** (0.027)
0.089** (0.039)
0.065* (0.038)
First stage F-stat 373.81 194.17 178.12
Observations 7,332 7,332 3,788 3,544
age>50 0.022*** (0.004)
0.006 (0.086)
-0.037 (0.138)
0.027 (0.112)
First stage F-stat 31.85 11.69 19.80
Observations 948 948 495 453
Table 8
The effect of men’s overweight or obesity on the probability of hypertension
Variable Probit IV-Probit
(1) (2) (3) (4)
Overweight or obesity 0.143*** (0.010)
1.162*** (0.419)
0.702 (0.568)
1.675*** (0.600)
First stage F-stat 202.32 106.65 97.26
Observations 24,678 24,678 12,698 11,980
Table 9
The effect of women’s overweight or obesity on the probability of hypertension
Variable Probit IV-Probit
(1) (2) (3) (4)
Overweight or obesity 0.081*** (0.006)
1.206*** (0.421)
1.871*** (0.572)
0.504 (0.563)
First stage F-stat 255.50 110.50 150.11
Observations 26,112 26,112 13,437 12,675