TABLE OF CONTENTS: VOL. 50, NO. 1, January 1997
ARTICLES Plunt Animal
2 Phosphorus supplementation of range cows in the Northern Great Plains by James F. Karn
10 Recovery of leafy spurge seed from sheep by Bret E. Olson, Roseann T.
Wallander, and Rodney W. Kott
16 Range or meadow regrowth and weaning effects on 2-year-old cows by James B. Lamb, Don C. Adams, Terry J. Klopfenstein, Waiter W. Stroup, and Greg P. Lardy
20 Effects of ruminant digestion on germination of Lehmann lovegrass seed by E.L. Fredrickson, R.E. Estcll, K.M. Havctad, T. Ksiksi, J. Van Tol, and M.D.
Remmenga
27 Comparing techniques for determining steer diets in northern Chihuahuan Desert by Mohammed M. Mofareh, Reldon I+. Beck, and Alan G. Schneberger 33 Comparison of techniques for determining the nutritional carrying capaci-
ty for white-tailed deer by Thomas C. McCall. Robert D. Brown. and Louis C.
Bender Plunt Ecology
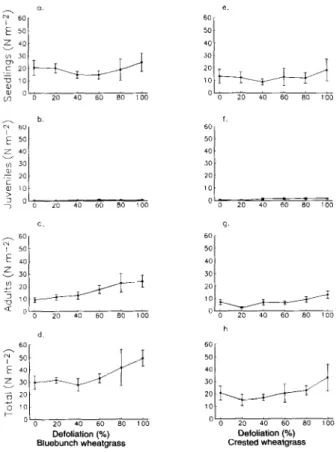
39 Effect of weed seed rate and grass defoliation level on difruse knapweed by Roger L. Sheley, Bret E. Olson, and Larry L. Ixson
44 Influence of Japanese hrome on western wheatgrass yield by Marshall R.
Haferkamp, R.K. Heitschmidt, and Micllael G. Karl
51 Preparing sagebrush seed for market: EfTects of debearder processing by D. Terrance Booth, Yuguang Bai, and Eric E. Roos
55 Nitrogen and biomass dynamics following brush control in the cross tim- bers by D.L. Gay, D.M. tingle, E.R. Allen. and J.F. Stritzke
Published bimonthlyJanuary, March, May, 62
July, September, November
Actinorhizal plants in rangelands of the western United States by Mark W.
Paschke
Copyright 1997 by the Society for Range Man- agement
INDIVIDUAL SUBSCRIPTION is by member- ship in the Society for Range Management.
73 Seedling dynamics of Festuca spp. in a grassland of Patagonia, Argentina, as affected by competition, microsites, and grazing by Guillermo E. Defoss6, Ronald Robberecht, and M6nica B. Bertiller
LIBRARY or other INSTITUTIONAL SUB-
SCRIPTIONS on a calendar year basis are
$95.00 for the United States postpaid and
$112.00 for other countries, postpaid. Payment from outside the United States should be remit- ted in US dollars by international money order or draft on a New York bank.
Plant Physiology
80 Development and vigor of diploid and tetraploid Russian wildrye seedlings by John D. Berdahl and Ronald E. Ries
BUSINESS CORRESPONDENCE, concerning
subscripfions, advertising, reprints, back issues, and related matters, should be addressed to the Managing Editor, 1839 York Street, Denver, Colorado 80206.
Animal Ecology
85 Determination of animal behavior-environment relationships by Correspon- dence Analysis by Jose M. De Miguel, Miguel A. Rodriguez, and Antonio Gomez- Sal
Economics
94 The economic impacts of increased grazing fees on Gila National Forest graz- ing permittees by L. Allen Tore11 and Tracy W. Drummond
EDITORIAL CORRESPONDENCE, concerning
manuscripts or other editorial matters, should be addressed to the Editor, Gary Frasier, 7820 Stag Hollow Road, Loveland, Colorado 80538.
Paie proofs should returned to the Production Editor. 1839 York Street, Denver, Colorado 80206.
Measurement/Sampling
106 A digital technique for recording of plant population data in permanent plots by David Roshier, Stephen Lee, and Frances Boreland
INSTRUCTIONS FOR AUTHORS appear on the inside back cover of most issues. THEJOURNAL OF RANGE MANAGEMENT (ISSN 0022409X) is oublished bimonthlv for $56.00 per vear bv the
BOOK REVLEWS
110 Prairie Conservation: Preserving North America’s Most Endangered Ecosystem. Edited by F.B. Samson and EL. Knopf; Natural Capital and Human
Sdciety for Range -Management, i839 iork Street, Denver, Colorado 80206. SECOND CLASS POSTAGE paid at Denver, Colorado, and additional offices.
Economic Survival by Thomas Prugh
POSTMASTER: Return entire journal with address change -RETURN POSTAGE GUAR- ANTEED to Society for Range Management, 1839 York Street, Denver, Colorado 80206.
PRINTED IN USA
Managing Editor
CHARLES B. (BUD) RUMBURG 1839 York Street
Denver, Colorado 80206 (303) 355-7070 Fax: (303) 3555059 e mail address:
[email protected] Editor
GARY FRASIER
7820 Stag Hollow Road Loveland, Colorado 80538 Production Editor PAll-Y RICH
Society for Range Management 1839 York Street
Denver, Colorado 80206 Book Review Editor
DAVID L. SCARNECCHIA Department of Natural Resource Sciences Washington State University Pullman, Washington 99164-6410
Associate Editors DON ADAMS
West Central Res. & Ext. Center Route 4, Box 46A
North Platte, Nebraska 69101 TERRANCE G. BIDWELL
Department of Agronomy Oklahoma State University Agric. Hall, Room 373 Stillwater, Oklahoma 74078 MARSHALL R. HAFERKAMP
USDA/ARS
Livestock & Range Res. Sta.
Route 1 Box 2021
Miles City, Montana 59301 STUART P. HARDEGREE
USDAIARS
800 Park Blvd., Plaze IV, #105 Boise, Idaho 83712.
RICHARD E. JOOST Plant Science Unit University of Missouri 214 Waters Hall Columbia, Missouri 65211
F. TED MCCOLLUM Oklahoma State University 212G Animal Science Bldg.
Stillwater, Oklahoma 74078-0425 DAVID MICHALK
Agric. Res. & Veterinary Centre Forest Road
Orange, NSW 2800 AUSTRALIA
M. KEITH OWENS Texas A&M University Research Center 1619 Garner Field Road Uvalde, Texas 78801 JEFF POWELL
Dept. of Range Management University of Wyoming University Station, Box 3354 Laramie, Wyoming 82071 MIKE RALPHS
1150 East 1400 North Logan, UT 84321
F. MONTE ROQUElTE Texas A&M University Agric. Res. & Ext. Center Ovetton, Texas 75684-0209 SHERM SWANSON
Renewable Resources Center University of Nevada
100 Valley Road Reno, Nevada 89512 JOHN TANAKA
Agr. & Res. Econ.
Oregon State University 213 Ballard Ext. Hall Corvallis, Oregon 97331 JOHN WALKER
US Sheep Exp. Station HC 62, Box 2010 Dubois, Idaho 84323 WALTER WILLMS
Agric. Canada Res. Center Lethbridge, AB TlJ 481 CANADA
President JOHN R. HUNTER
Texas Tech University Range & Wildlife Management Lubbock, Texas 79409 1st Vice-President JOHN C. BUCKHOUSE
Oregon State University
Department of Rangeland Resources Corvallis, Oregon 97331 2nd Vice-President
E. LARMAR SMITH, JR.
Div. of Range Management, BSE 325 University of Arizona
Tucson, Arizona 85721 Executive Vice-President CHARLES B. RUMBURG
Society for Range Management 1839 York Street
Denver, Colorado 80206 (303) 3557070 Directors
1994-1996 LINDA H. HARDESTY
Box 2023 College Station
Pullman, Washington 99165 JAMES T. O’ROURKE
HC 75, Box 20
Chadron, Nebraska 69337 19951997
E.T. “TOM” BARTLETT Colorado State University Department of Range Science Fort Collins, Colorado 80523 MARGUERITE B. “MEG” SMITH
Box 7
Glen, Montana 59732 19%-1998
RODNEY HElTSCHMIDT Ft. Keogh LARRL Rt 1, Box 2021
Miles City, Montana 59301 RONALD E. SOSEBEE 6902 Geneva
Lubbock, Texas 79413
THE SOCIETY FOR RANGE MANAGEMENT, founded in 1948 as the American Society of Range Management, is a nonprofit association incorporated under the laws of the State of Wyoming. It is recognized exempt from Federal income tax, as a scientific and educa- tional organization, under the provisions of Section 501(c)(3) of the Internal Revenue Code, and also is classed as a public foundation as described in Section 509(a)(2) of the Code. The name of the Society was changed in 1971 by amendment of the Articles of Incorporation.
The objectives for which the corporation is established are:
-to properly take care of the basic rangeland resources of soil, plants, and water;
-to develop an understanding of range ecosystems and of the principles applicable to the management of range resources;
-to assist all who work with range resources to keep abreast of newfindings and techniques in the science and art of range management;
-to improve the effectiveness of range management to obtain from range resources the products and values necessary for man’s welfare:
-to create a public appreciation of the economic and social benefits to be obtained from the range environment;
-to promote professional development of its members.
Membership in the Society for Range Management is open to anyone engaged in or interested in any aspect of the study, management, or use of rangelands. Please contact the Executive Vice- President for details.
The Journal of Range Management is a publication of the Society for Range Management. It serves as a forum for the presentation and discussion of facts, ideas, and philosophies pertaining to the study, management, and use of rangelands and their several resources. Accordingly, all material published herein is signed and reflects the individual views of the authors and is not necessari- ly an official position of the Society. Manuscripts from anyone-nonmembers as well as members-are welcome and will be given every consideration by the editors. Editorial comments by an individual is also welcome and, subject to acceptance by the editor, will be published as a “Viewpoint.”
In Cooperation With: Some of the articles appearing in The Journal of Range Management (JRM) are presented in cooperation with The American Forage and Grassland Council (AFGC). This coopera- tion consists of JRM acceptance of professional papers in forage grazing management and related sub- ject areas from AFGC members and the appointment of two AFGC affiliated associate editors
to JRM’s Editorial Staff. The American Forage and Grassland Council Offices: 210 W. 8th Street, #A, PO. Box 94, Georgetown, Texas 78626; C. Pat Bagley, President; Dana Tucker, Executive Secretary.
Contribution Policy: The Society for Range Management may accept donations of real and/or personal property subject to limitations set forth by State and Federal law. All donations shall be subject to management by the Executive Vice President as directed by the Board of Directors and their discretion in establishing and maintaining trusts, memorials, scholarships or other types of funds.
Individual endowments for designated purposes can be established according to Society policies. Gifts, bequests, legacies, devises, or donations not intended for establishing designated endowments will be deposited into the SRM Endowment Fund. Donations or requests for further information on Society poli- cies can be directed to the Society for Range Management, Executive Vice-President, 1839 York Street, Denver, CO 80206. We recommend that donors consult Tax Advisors in regard to any tax consideration that may result from any donation.
The term of office of all elected officers and directors begins in February of each year during the Society’s annual meeting.
J. Range Manage.
50:2-g
Phosphorus supplementation of range cows in the Northern Great Plains
JAMES F. KARN
Author is a research animal scientist, USDA-Agricultural Research Service, Northern Great Plains Research Laboratory, P.O. Box 459, Mandan, N.D.
58554.
Abstract
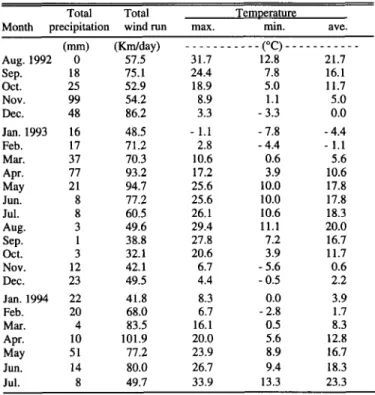
Low phosphorus (P) levels in Northern Great Plains rangeland forage combined with limited data on the P requirements of range cows (Bos taurus), precipitated 2 studies conducted to com- pare the performance of P supplemented and no P supplemented (control) beef cows. Phosphorus supplementation levels ranged from 4 to 8 g day-’ depending on estimated P needs at diierent times of the year. The 2 groups of cows previously bad been involved in replacement heifer growing studies, with P treat- ments established 462 and 402 days, respectively, before initia- tion of these studies. Winter feed consisted of mixed hay, primar- ily smooth bromegrass (Bromus inermis Leyss.), with corn sihrge (Zea muys L.) fed only in 1982 and 1983 from calving to the time cows were turned on summer pasture. Summer pastures con- tained primarily western wheatgrass [Puscopyrum smithii (Rydb.) A. Liive], needleandtbread (Stipa comatu Trin. and Rupr.), green needlegrass (S. viridulu Trin.), blue grama [Bouteloua Gradis (H.B.K.) GrifEtbs] and upland sedges (Curex spp.). The P status of cows used in these studies appeared to be estimated more reliably by forage P than by serum or fecal P.
According to P levels in bay and pasture, the diets of control cows were below recommended P levels for about 9 months of the year. However, weight change differences between P supple- mented and control cows during the first lactation and gestation periods were gradually lost by the end of the studies. Conception rates of control cows were slightly lower (P<O.OS) in the fmt but not the second study. There were no differences in average calv- ing date or calf birth weights, but P supplementation did increase (PcO.01) calf weaning weights. Cow weight changes, calf weaning weight differences, forage and serum P data, and in the first study conception rate differences indicate that Northern Great Plains forages are marginal to deficient in P for optimal produc- tion of beef cows. The most consistent benefit from P supplemen- tation was an increase in calf weaning weights. Data also indicate that energy supplementation for 30 days after calving may increase conception rates.
__________________._... - - -...-- ^._._. - .._..._._.. -
The author wishes to thank Mr. Richard Huppler for his diligence in caring for animals and collection of research samples and Dr. Gary V. Richardson for assis- tance with statistical procedures.
USDA-AR& Northern Plains Area, is an equal opportunity/affirmative action employer and all agency services are available without discrimination.
Mention of a trade name is solely to identify materials used and does not consti- tute endorsement by the USDA.
Manuscript accepted 17 Feb. 1996.
Key Words: forage phosphorus, extrusa, energy supplement, native range, fecal minerals.
Forages grown on Northern Great Plains rangelands are often low in phosphorus (P) (Sarvis 1941) compared to NRC (1984) recommendations. However, Karn (1992) reported that range cows offered ad libitum access to P in a mixture with salt showed no benefit from the practice over 3 grazing seasons, probably due to low and variable P intakes. In subsequent research with grow- ing heifers, Kam (1995) obtained P intake levels of 4-6 g day-’
using ground oats and dried molasses to stimulate consumption.
However, heifer weight gains were not consistently affected; in 1984 P supplementation of Hereford-Simmental heifers increased weight gains, but in 1981 weight gains of Hereford and Hereford- Angus crossbred heifers were not affected. In other research, Call et al. (1978) reported no response to P supplementation of graz- ing cattle in Utah and Judkins et al. (1985) reported that supple- mentation of grazing cows in New Mexico was beneficial only during a drought. Read and Engels (1986a) reported that P suple- mentation at one location in South Africa dramatically improved cow and calf weight gains and reproductive performance, while reducing mortality, but at another location only weaning weights were improved. Fishwick et al. (1977) reported that 12 g P daily was inadequate for beef cows, but in a subsequent study this group reported that 10-12 g P daily was adequate to maintain normal blood P concentration, voluntary intake and digestibility (Bass et al. 1981).
Blood P is often used to estimate P status, but Read and Engels (1986b) indicated that unless plasma P was below 20 mg liter-’ it was insensitive to changes in dietary P. Diet P itself, is difficult to determine for grazing animals because extrusa samples are affect- ed by salivary P (Langlands 1966), and it is difficult to clip sam- ples as selectively as animals graze (Langlands 1974). Thus, Holechek et al. (1985) used fecal P to predict dietary P levels in range cattle. In short-term feeding trials, Sanson et al. (1990) reported an 12 of 0.78 between P intake and fecal P, but cautioned that the usefulness of this relationship may be limited by differ- ences in the availability of dietary P.
Phosphorus supplementation is recommended for grazing cattle in the Northern Great Plains, but documented benefits are lack- ing. Thus, the objectives of this research were to determine the effect of P supplementation on the performance of range cows and to compare diet, serum, and fecal P as methods of determin- ing the P status of grazing cattle.
Materials and Methods
Phosphorus supplementation studies with young beef cows, just before their first parturition, were initiated on 19 February 1982 and 1 March 1985 and continued until 4 November 1983 and 26 October 1987, respectively. Fifty-three Hereford and Hereford- Angus crossbred cows were used in the first study and 55 Hereford-Simmental cows were used in the second study.
Twenty-six cows in the first study and 28 in the second were assigned to receive supplemental P and 27 cows in each group were maintained as controls and received no supplemental P.
These cows had previously been used in replacement heifer growing studies (Kam 1995) and were continued on the same P treatments. Thus P supplemented cows in the current studies had already been receiving 4-6 g P day-’ for 462 and 402 days, respectively when these studies were initiated. Average initial cow weights were 407 kg in the fist study and 470 kg in the sec- ond study.
Supplementation
Cows were supplemented by treatment group and fed in a bunk.
Monosodium phosphate was used as the supplemental P source and ground oats and dried molasses were used as a carrier to aid mineral consumption. Supplements for P supplemented and con- trol cows, and the periods they were used are shown in Table 1.
Control cows received only the carrier used with the P supple- ment. In 1982, before calving, both treatment groups were main- tained together, except when supplemented, but after calving they were maintained in separate groups until they were turned on summer pasture. During the summer of 1982, and for all subse- quent time periods in both studies, cows were maintained togeth- er at all times except when they were corralled, separated by treatment group, and supplemented. Cows had previously been trained to go into 2 separate pens at feeding; training was facili- tated by using either a mild electric shock as a negative reinforce- ment or supplement as a positive reinforcement (Karn and Lorenz 1984). This separation procedure facilitated relatively rapid sup- plementation, resulting in minimum disturbance to normal cow grazing patterns, even when calves were at side. Generally, cows were penned only 45-60 minutes for feeding. Supplements were
Table 1. Supplements and the periods they were fed to phosphorus (P) supplemented and no P supplemented (control) range cows during studies beginning in 1982 and 1985 and ending in 1983 and 1987l.
P Control
Period Ground Dried Ground Dried
P oats molasses oats molasses
_ _ _ _ (g da,,-‘) _ _ _ _ - - (g day-‘) - - g&2
19 Feb. 1982-12 Mar. 1982 6 28.5 28.5 28.5 28.5
12 Mar. 1982-15 Nov. 1982 8 57.0 28.5 57.0 28.5
15 Nov. 1982-11 Mar. 1983 4 28.5 28.5 28.5 28.5
11 Mar. 1983- 4 Nov. 1983 8 57.0 28.5 57.0 28.5
Js?5
1 Mar. 1985-15 Mar. 1985 6 28.5 28.5 28.5 28.5
15 Mar. 1985-12 Nov. 1985 8 57.0 28.5 57.0 28.5
12 Nov. 1985-17 Mar. 1986 4 28.5 28.5 28.5 28.5
17 Mar. 1986- 7 Nov. 1986 8 57.0 28.5 57.0 28.5
7 Nov. 198616 Mar. 1987 4 28.5 28.5 28.5 28.5
16 Mar. 1987-26 Oct. 1987 8 57.0 28.5 57.0 28.5
‘Supplement amounts are. daily averages for supplements fed at 2.3 or 4 day intervals.
fed on Monday, Wednesday, and Friday from 19 February to 31 May 1982; for the remainder of the 1982 study and for all of the 1985 study, cows were fed only on Monday and Friday when they received 4 and 3-day portions of supplement, respectively.
In 1986 and 1987 in addition to their normal treatment supple- ments, every other cow to calve on both the P supplemented and control treatments, respectively, received supplemental oats fed Monday through Friday at the rate of 1.8 kg day-’ from the day after calving until 27 May in 1986 and 29 May in 1987.
Supplemental oats were fed for an average of 30 days in 1986 and 32 days in 1987. The oats contained 125 g kg-’ crude protein and 3.5 g kg-’ P. Cows were bunk fed supplemental oats in the same pens where they were normally supplemented. Cows not receiving supplemental oats received only their previously described supplements (Table 1).
Management and Sampling
During the winter, mixed hay which was primarily smooth bromegrass (Bromus inermis Leyss.) was fed free choice. Cows received corn silage (Zea muys L.) at about 8 kg day-’ for approx- imately 90 days after calving in 1982 and 1983 only. From the time cows began to calve in April until they were turned on sum- mer pasture, for all years except 1983, they were maintained in small calving pastures with access to harvested feeds and some grass. In 1983 cows were confined to a drylot during this period and fed only harvested feeds. Vitamin A was provided during the winter, at the rate of 20,000 IU per day, via a vitamin A, D, and E premix fed with treatment supplements.
During the summer, cows were rotated between adjoining 92 and 99 ha native pastures containing primarily western wheat- grass [Pascopyrum smithii (Rydb.), A. Love], needleandthread (Stipa comata Trin. and Rupr.), green needlegrass (S. viridula Trin.), blue grama [Bouteloua grucilis (H.B.K.) Griffiths], and upland sedges (Curex spp.). These pastures have been described in more detail by Kam (1992). Trace mineralized salt containing 96-98.5% salt, 0.35% zinc, 0.34% iron, 0.20% manganese, 0.033% copper, 0.007% iodine, and 0.005% cobalt (Akzo Salt, Inc., Clarks Summit, Penn.) was available at all times.
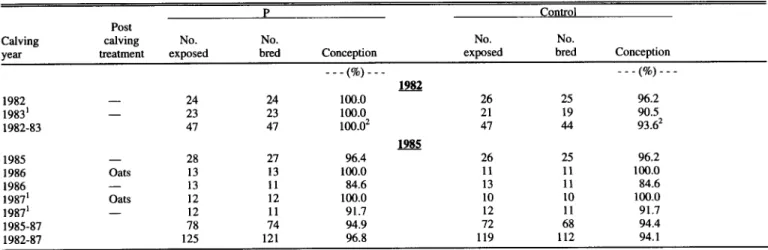
Hereford and Hereford-Angus crossbred cows used in the first study were mated to Tarentaise bulls in 1982 and 1983, while Hereford-Simmental crossbred cows used in the second study were mated to Angus bulls in 1985 and to Simmental bulls in 1986 and 1987. Two hulls were used each year over a 60-day breeding season. Pregnancy was determined by rectal palpation following weaning in 1983 and 1987.
Cows were weighed following an overnight stand without feed or water at the beginning and end of each study, at monthly inter- vals during each summer grazing season and just before each calving period. Summer grazing seasons were from 2 June to 10 November 1982, 23 May to 4 November 1983, 3 June to 6 November 1985, 2 June to 30 October 1986, and 1 June to 26 October 1987. Calves were weighed at birth, at monthly intervals during the summer and when they were weaned at the end of the summer grazing season. Calves were allowed to remain with their mothers until just before being weighed.
Milk production was estimated over 24 hours by the weigh- suckle-weigh technique described by Neville (1962) using a morning and evening nursing cycle on 22 August and 6 October 1983, 16 July 1985, and 31 July 1986. In 1987 one nursing cycle following a 13 hour separation period on 8 October was used to
JOURNAL OF RANGE MANAGEMENT 50(l), January 1997 3
estimate 24 hour milk production (Williams et al. 1979). Milk were first established with these animals in replacement heifer samples were collected for mineral analysis by hand milking on 4 studies (Kam 1995), in order to correct for initial element differ- November 1983. This was facilitated by injecting 2 ml of oxy- ences among animals. Treatment differences were considered sig- tocin into the tail vein just before milking. nificant at the 5% probability level unless otherwise indicated.
Blood samples were collected from the jugular vein of each cow on 10 June and 5 November 1982; 23 May and 28 October 1983; 31 May and 25 October 1985; 31 March, 11 June and 23 October 1986; and 6 March, 1 June and 26 October 1987. Serum was removed from samples by centrifugation, frozen and stored for approximately 6 months before analysis.
Results and Discussion
Extrusa samples were collected from pastures every 2 weeks during each grazing season with 3 mature esophageally fistulated steers. Steers were allowed to graze until collection bags were full, which usually occurred within 30 minutes. Fistulated steers were penned off feed over night before each sampling date; this procedure did not appear to affect grazing selectivity. Individual steer collections were mixed, subsampled, frozen, and freeze dried for nitrogen (N) and in vitro digestible organic matter (IVDOM) analyses. Extrusa subsamples for mineral analyses were squeezed to remove saliva (Hoehne et al. 1967) and dried in a forced air oven at 50°C.
Hay fed during calving and lactation periods in the winter of 1982 had the highest P level of any hay used during these studies (Table 2). Corn silage fed after calving in the first study also had a relatively high level of P, compared to the range of 2.2 to 2.7 g kg-’ recommended by the NRC (1984) for cows with average and superior milk production, respectively. Hays used in 1985, 1986 and 1987 had P levels that were well below the NRC (1984) rec- ommendation (2.1 g kg-‘) for dry pregnant cows during the last third of gestation.
Fecal samples were obtained in 1986 and 1987 from 2 random- ly determined subgroups of cows within each of the P supple- mented and control groups. At least 6 cows within each subgroup were sampled at each collection period and an attempt was made to sample the same cows each time. Collections were made on alternate weeks, the day after extrusa forage samples were taken.
Samples were obtained immediately after defecation and compos- ited over cows within each subgroup, providing 2 fecal samples for the P supplemented group and 2 samples for the control group. Samples were frozen and freeze dried. Winter feed, extrusa, and fecal samples were ground to pass a 1 mm screen before being analyzed.
Table 2. Mean (k SD) phosphorus (P), calcium (Ca), crude protein (CP), and in vitro digestible organic matter (IVDOM) of bay and corn silage fed to P supplemented and control cows in studies beginning in 1982 and 1985.
Feed Year P Ca CP IVDOM
_ _ _ _ _ _ _ _ (g kg-’ dry matter) _ . . . _ _ _ _ _
(g kg-‘) 1982
Hay 1982 1.89r0.56 5.101t1.56 - -
Corn Silage 1982 2.2tko.15 2.31kO.29 - -
Hay 1983 1.16+0.24 4.44k1.27 - -
Corn Silage 1983 2.11+0.16 4.45kO.5 1 - -
1985
Hay 1985 1.25iO.24 7.11+1.70 104~t27 688k39
Hay 1986 1.19+0.36 7.43i3.04 104+38 582+24
Hay 1987 1.42kO.32 11.4OLk4.08 108k27 549*38
Chemical and Statistical Analyses
Phosphorus and N in extrusa, hay, and corn silage and P in serum, milk, and feces were determined with a Technicon Autoanalyzer (Technicon Industrial Systems, Tarrytown, N. Y.
10591). Atomic absorption was used to determine Ca, Mg, and K in extrusa and fecal samples, Ca and Mg in serum and milk and Ca in hay and corn silage. In vitro digestible organic matter was determined by the procedure of Moore and Mott (1974).
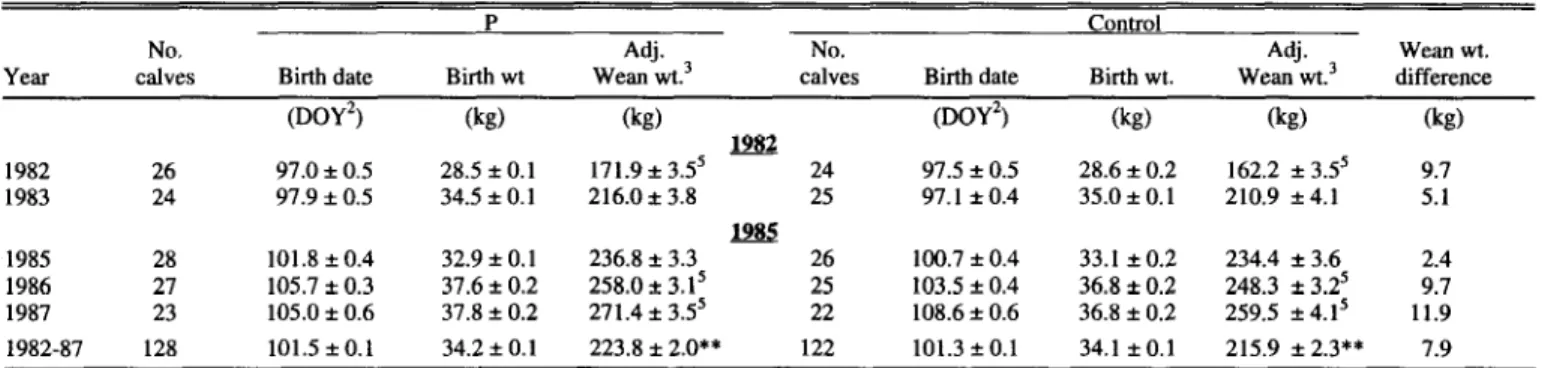
Cow weights, calf birth dates, and milk production were ana- lyzed according to a completely randomized design. Fecal data were analyzed as a randomized complete block and treatment was tested with the treatment X date interaction term. Conception rate data were analyzed for each study separately and over both stud- ies using chi-square analysis. Calf weaning weights were ana- lyzed by GLM covariance procedures (SAS 1985), by year and over all 5 years, using birth date to correct for differences in calf age and least squares means to adjust for unequal animal num- bers. When calf weaning weight data for the 2 studies were com- bined the following model was used: treatment, study, treatment X study, calves (treatment X study), calf sex, treatment X calf sex, year (study), and treatment X year(study). The treatment X study term was not significant, therefore it was eliminated from the model. The treatment and study terms were tested using calves (treatment X study) as the error term. It was assumed there was no method of supplementation interaction, therefore animals were considered as experimental units. Serum data were analyzed by covariance, using element levels determined when treatments
Extrusa P levels, averaged over years by month for the first study (1982-1983), were adequate (NRC 1984) for lactating cows, based on percent P in the extrusa, only in June. However during other summer months, especially in 1983, it is possible that even with low forage P levels (Table 3) cows could have consumed more P than expected through increased forage con- sumption. Extrusa P data for the second study (1985-1987) sug- gest that average monthly P levels may have been slightly higher than in the first study, but for much of the time based on percent P in the extrusa, levels were still marginal to deficient for lactat- ing cows. Magnesium levels in the extmsa were below 2.0 g kg-‘, which is the level suggested by Underwood (1966) as necessary to prevent grass tetany, for all monthly averages except July 1982-1983. However, there were no instances of grass tetany.
Mean extrusa crude protein levels were marginal to deficient for lactating beef cows (NRC 1984) during September and October, of both studies and extrusa K levels were marginal (NRC 1984) during September and October of the first study. Although extrusa samples were squeezed to remove saliva as suggested by Hoehne et al. (1967), samples may still have contained higher P levels than unmasticated forage (Langlands 1966). This suggests that dietary P levels for control cows may have been even lower than indicated by data in Table 3. Although there may be prob- lems using extrusa samples for mineral analysis, they are more readily accepted than hand clipped samples as a means of sam- pling pastures for chemical analysis.
Table 3. Mean (t SD) monthly chemical composition data from extrusa samples of native pastures grazed by phosphorus (P) supplemented and con- trol cows in 1982-83 and 1985~87tf.
Crude
Month P Ca Mg K Protein
__...__________-__________ ---@kg-‘dry matter) .__________...______________
1982-83
Jun. 2.18 f 0.35 6.78 f 2.4 1.78 + 0.51 l2* 1.0 132 + 17
Jul. 1.96 f 0.41 6.24 + 1.7 2.07 f 0.22 II + 2.0 107 f. 16
Aug. I.75 f 0.12 5.40 * 1.3 1.37 f 0.24 7 f 0.3 99* 15
Sep. 1.54kO.18 4.54 * 1.2 I.35 f 0.01 6zt 0.2 67+ 5
Oct. 1.32 f 0.33 3.06 + 0.8 0.89 f 0.08 4 f 0.6 56+ I
Season mean I .77 f 0.40 5.32 f 1.9 1.49 f 0.47 8* 3.0 94*30
1985-87
Jun. 2.20 + 0.32 5.29 + 2.3 1.65 k 0.50 27 * 13.6 lOOk 16
Jul. 2.14 f 0.25 6.03 f 2.1 1.86 f 0.37 24 zt 11.4 90+ I6
Aug. 2.15 zt 0.40 5.62 f 1.4 1.57 + 0.34 21 + 12.7 91 k24
Sep. 1.87 f 0.12 4.57 f 1.2 I .42 zt 0.26 I8 i 10.0 81 + I9
Oct. 1.71 f 0.28 3.51 i 0.4 1.00 f 0.24 I4 + 8.6 74*15
Season mean 2.02 f 0.33 5.05 zt I.8 1.52 + 0.45 21 f 11.6 88 f 19
‘Monthly means are averages of 3 or 4 collection dates for 1982-83 and 6-7 collection dates for 1985-87.
*Means over months are averwes of 10 dates for ME and K and 19 dates for other data in 1982-83 and 32 dates for all data in 1985.87.
IVDOM3 (g kg-‘) 696 f 53 637264 6101t47 602 f 39 580 zt 37 628 f 60
703 f 54 668 + 78 638 + 59 624*60 61.5 + 56 652 f 67
31VDOM=in vitro digestible organic matter. -
Fecal P levels averaged over the grazing season were higher (PcO.05) for P supplemented cows in 1986 (Table 4), and differ- ences between treatments were consistent at all sampling dates (Fig. 1). Season-long differences in fecal P levels between P sup- plemented and control cows also occurred in 1987, and they were consistent among sampling dates (Fig. 2) but differences were less than in 1986 (Table 4). Read and Engels (1986b) reported that fecal P differences between P supplemented and unsupple- mented cows decreased when feed intake and consequently fecal output declined for unsupplemented cows. In the current study, P supplemented and control cows were gaining weight at approxi- mately the same rate, therefore P supplemented cows may have been absorbing and utilizing more P in 1987 than in 1986, thus less P was eliminated in the feces. Early in the season in both 1986 and 1987 fecal P was much higher than forage (extrusa) P,
I I I I
+ Fecal P, P cows . A Fecal P, control cows -t- Extrusa P
- NRC 1984
Jun. 9 Jul. 19 Aug. 28 Oct. 7 Date
Fig. 1. Phosphorus (P) levels in pasture (extrusa) samples compared to fecal P from P supplemented and no P supplemented (control) range cows in 1986.
but by October fecal P from control cows was only slightly high- er than forage P (Fig. 1 and 2). There was an ? of 0.64 between fecal P from control cows and forage (extrusa) P in 1986 but in 1987 the ? was only 0.28. In 1986 fecal Ca levels were higher and fecal K levels were lower, and in 1987 fecal Mg levels were lower for P supplemented cows, but fecal N levels were not affected by supplemental P in either year (Table 4).
Serum P was higher for control than P supplemented cows in June of 1982, but P supplemented cows had higher serum P in November of 1982 (PcO.08) and May and October of 1983 (Table 5). Normal serum P levels according to Underwood (1981) range between 40-60 mg liter-‘. Read and Engels (1986b) reported that plasma P levels below 20 mg liter-’ were useful in identifying P deficiency, but at higher levels, plasma P seemed to be of little use in distinguishing between P adequate and P defi- cient animals. The lowest average serum P levels (38 and 33 mg
I I I I
+ Fecal P, P cows A. Fecal P, control cows
. -)- Extrusa P
- NRC 1984
Jun. 9 Jul. 19 Aug. 28 Oct. 7 Date
Fig. 2. Phosphorus (P) levels in pasture (extrusa) samples compared to fecal P from P supplemented and no P supplemented (control) range cows in 1987.
JOURNAL OF RANGE MANAGEMENT 50(l), January 1997
Table 4. Phosphorus (P), calcium (Ca), magnesium (Mg), potassium (IO, and nitrogen (N) in fecal samples collected from P supplemented and no P supplemented (control) range cows during the summers of 1986 and 1987l.
Treatment P Ca
1986 Mg
1987
K N P Ca Mg K N
______________ --(gkg-‘drymafier) _______________
P 3.20* 14.4* 5.13 5.66* 17.4
-,,;; _ _ _ _ -1~~~ _ (g kg-’ dry mat@r) _ _ _ _ . _ _ _ _ _ _ _ _ _ _
3.96* 6.37 18.4
Control 2.68* 13.4* 4.77 6.20* 17.6 2.81* 13.2 4.12* 6.32 18.7
SE= ,002 ,007 ,004 .002 .004 .OOl .012 .OOl ,004 .003
‘Treatment means are averages of 2 replications and 11 dates in 1986 and 2 replicates and 10 dates in 1987.
‘SE = Standard error of the mean = dEMs, where EMS = error mean square used to test treatments, and N = the number of observations/mean.
N
* Within a year and mineral, treatments differ (PcO.05).
liter-r) for control cows in these studies were in October 1983 and March 1986, respectively. Low serum P in 1983 was likely due to low forage P for about 3 months and the demands of lactation; in 1986 low serum P was likely the result of 7 months on a low P diet. The lowest serum P level for P supplemented cows was 44 mg liter-’ in June of 1982.
Serum P in the second study was higher for P supplemented cows in October 1985, March 1986 and October of 1986 (PcO.08). Serum Ca was higher for control cows in November 1982, May 1983, and October of 1985 (Table 5). Similar increas- es in plasma Ca for unsupplemented compared to P supplemented cows was reported by Read and Engels (1986b), but the effect was more prevalent in late lactation. Underwood (1966) indicated that this inverse relationship between plasma P and Ca was the result of mobilization of these elements from bone to supply needed P, with the corresponding Ca remaining as excess in the plasma. Serum Mg levels above 20.0 mg liter-’ are considered normal for grazing cows by the Committee on Mineral nutrition (1973). All cows in both studies, except P supplemented cows (19.0 mg liter-‘) in May of 1983 had serum Mg levels above 20.0 mg liter-’ (Table 5).
Milk samples collected in October 1983 were similar in P, Ca, and Mg levels for control and P supplemented cows and averaged 1042, 1375, and 128 mg liter-’ on a whole milk basis, respective- ly. Milk levels of Ca, P, and Mg were within normal limits
(Committee on Mineral Nutrition 1973, Kemp 1971). Read and Engels (1986a) reported that milk composition was only slightly affected in cows with a severe P deficiency.
Milk production for 24 hours (GE), estimated on 22 August and 6 October 1983, 16 July 1985, 31 July 1986 and 8 October 1987 by the weigh-suckle-weigh technique was 5.3 * 0.06 vs 4.7+ 0.06,3.4 f 0.07 vs 2.6 f 0.08,7.4 + 0.04 vs 7.0 k 0.05,9.5 + 0.06 vs 8.4 2 0.07 and 8.3 * 0.08 vs 7.5 + 0.08 kg for P supple- mented and control cows, respectively. Although milk production for P supplemented cows was numerically greater at each sam- pling period, differences were only significant (PcO.05) for the 31 July 1986 date.
Cow weights at the beginning of these studies were 406 and 407 kg, and 473 and 466 kg for P supplemented and control cows used in the fist and second studies, respectively. Weight gain or loss comparisons between P supplemented and control cows in Table 6 were always made with cows that had similar calving and lactation histories. Cows that lost calves or failed to breed were not included in weight comparisons during that breeding and lac- tation cycle, because their weight gains were always much higher than those of lactating cows. During the 1982 calving and nursing period P supplemented cows lost more weight (PcO.05) than con- trol cows (Table 6), but during the following winter gestation period, P supplemented cows gained more weight (PcO.05) than control cows. Cow weight changes were not different during the
Table 5. Serum phosphorus (P) f SE, calcium (Ca) f SE, and magnesium (Mg) f SE for P supplemented and no P supplemented (control) range cows for studies beginning in 1982 and 1985 and ending in 1983 and 1987l’ *‘*
Date P
P
Ca Mg P
Control
Ca Mg
__ ___ _______- (q l&f’) __---______ _ _ _-_____ _--- -(mg liter-‘) ----__________
@Q
Jun. ‘82 44 zt 1.6* 92 f 1.5 - 53 + 1.6* 93 f 1.5 -
Nov. ‘82 45 f 1.84 95 f 0.8* - 41 + 1.74 101 f 0.7* -
May ‘83 76 i 2.3* 90 f 0.9* 19*0.1* 57 f 2.4* 96 i l.O* 21 + 0.1*
Oct.. ‘83 51 zt 1.8* 102 f 1.1 22 It 0.2 38 + 1.8* 105 + 1.2 22ItO.l
1985
May ‘85 54* 1.4 101 f 0.7 20 It 0.4 55 f 1.5 102 + 0.8 21 f 0.4
Oct.. ‘85 61 i 1.8* 103 f 0.6* 20 f 0.3 46 + 1.9* 107 + 0.6* 20 + 0.3
Mar. ‘86 47 + 0.9* 107 + 0.9 22 + 0.3 33 + 0.9* 107 + 0.9 21 + 0.4
Jun. ‘86 53 LIZ 2.6 97 f 1.0 25 i 0.4 55 + 2.8 98 + 1.1 24 f 0.4
Oct.. ‘86 48 f 1.24 99 f 0.7 22 f 0.3 45 f 1.34 99 f 0.7 23 f 0.3
Mar. ‘87 46i 1.4 93 * 1.3 23 f 0.4 48 + 1.5 94 f 1.4 23 i 0.4
Jun. ‘87 53 f 1.8 100 f 1.4 24 zt 0.4 56 f 1.9 96k 1.4 24 f 0.4
Oct.. ‘87 48 i 2.0 90 f 2.4 22 zt 0.6 47 f 2.0 92 f 2.5 22 i 0.7
‘All means except semm Mg for May and October 1983 are least squares adjusted.
*Summer data are for lactating cows only.
%E = Last squares mean standard error from SAS GLM.
%eatments within a date and mineral are different (P<O.O8).
*Treatments within a date and mineral are different (PcO.05).