Munich Personal RePEc Archive
Openness, ICT and Entrepreneurship in
Sub-Saharan Africa
Asongu, Simplice and Nwachukwu, Jacinta
January 2017
Online at
https://mpra.ub.uni-muenchen.de/83070/
1
A G D I Working Paper
WP/17/032
Openness, ICT and Entrepreneurship in Sub-Saharan Africa
Forthcoming: Information Technology & People
Simplice A. Asongu
African Governance and Development Institute, P.O. Box 8413 Yaoundé, Cameroon.
E-mail: asongusimplice@yahoo.com / asongus@afridev.org
Jacinta C. Nwachukwu
School of Economics, Finance and Accounting, Faculty of Business and Law,
2
2017 African Governance and Development Institute WP/17/032
Research Department
Openness, ICT and Entrepreneurship in Sub-Saharan Africa
Simplice A. Asongu & Jacinta C. Nwachukwu
January 2017
Abstract
This study has examined how information and communication technology (ICT) influences
openness to improve the conditions of doing business in sub-Saharan Africa. The data is for
the period 2000-2012. ICT is proxied with Internet and mobile phone penetration rates
whereas openness is measured in terms of financial and trade globalisation. Ten indicators of
doing business are used, namely: (i) cost of business start-up procedures; (ii) procedure to
enforce a contract; (iii) start-up procedures to register a business; (iv) time required to build a
warehouse; (v) time required to enforce a contract; (vi) time required to register a property;
(vii) time required to start a business; (viii) time to export; (ix) time to prepare and pay taxes
and (x) time to resolve an insolvency. The empirical evidence is based on Generalised Method
of Moments with forward orthogonal deviations. While we find substantial evidence that ICT
complements openness to improve conditions for entrepreneurship, the effects are contingent
on the dynamics of openness, ICT and entrepreneurship. Theoretical and practical policy
implications are discussed. The inquiry is based on two contemporary development concerns:
the need for policy to leverage on the ICT penetration potential in the sub-region and the
relevance of entrepreneurship in addressing associated issues of population growth such as
unemployment.
JEL Classification: F40; O38; O40; O55; P37
3 1. Introduction
Information and communication technology (ICT) serves to boost, inter alia:
economic prosperity (Qureshi, 2013a; Levendis & Lee, 2013); living standards (Chavula,
2013); externalities in welfare (Qureshi, 2013b, 2013c; Carmody, 2013); banking sector
progress (Kamel, 2005); life for all (Ponelis & Holmner, 2013a, 2013b; Kivuneki et al., 2011)
and sustainable development (Byrne, 2011) in developing nations. Whereas ICT has been
documented to benefit human and socio-economic developments, little is known about the
connections between ICT, openness and doing business outcomes such as entrepreneurship1.
Examining the importance of ICT in openness for entrepreneurship in Sub-Saharan
Africa (SSA) fundamentally builds on four trends in the literature, notably, the: evolving
potential of ICT; relevance of openness in 21st century economic prosperity2; role of
entrepreneurship in addressing employment concerns in the post-2015 development agenda
and gaps in the entrepreneurship literature (Qureshi et al., 2009; Brixiova et al., 2015;
Asongu, 2015; Kuada, 2009, 2015; Asongu et al., 2016; Roztocki & Weistroffer, 2016;
Asongu & Le Roux, 2017; Amavilah et al., 2017; Asongu & Biekpe, 2017).
First, in relation to frontier economies in the Organisation for Economic Cooperation
and Development (OECD) and Asia which are witnessing saturation levels in ICT
penetration, there is a higher ICT growth potential in African peripheral markets (Penard et
al., 2012; Asongu, 2017a). According to Penard et al. (2012), as of 2010, Internet and mobile
phone penetration rates in the African continent were respectively 9.6 % and 41 %. The SSA
region has the lowest ICT penetration rate, while at the same time it has the highest ICT
growth rate. Whereas ICT penetration is expected to engender development avenues, cautions
have been raised in scholarly and policy circles not to conceive ICT as an economic
development silver bullet (Mpogole et al., 2008, p.71).
Second, openness has been established to be unavoidable in 21st century development.
Accordingly, there is a well established consensus that integration into the worldwide
economy is indispensable for development in the era of globalisation (Oluwatobi et al., 2015;
Murphy & Carmody, 2015; Tchamyou, 2016). The strand of studies underlying this
consensus maintains that SSA is lagging in the drive towards the knowledge economy (KE)
which is vital for contemporary economic prosperity (Anyanwu, 2012; Asongu, 2017b). In
principle, whereas North America and Europe have being charting the course of development
1
Entrepreneurship and ‘doing business’ are used interchangeably throughout the study.
2
4 in the international arena because of their comparatively higher KE drive, nations in Latin
America and Asia are catching-up, partly because the Japanese KE course has determined the
pattern for the newly industrialised economies of Asia. Consistent with recent African KE
literature, compared to other regions of the world, the overall index of KE in Africa has been
decreasing since the beginning of the third millennium (Anyanwu, 2012).
Third, the United Nations’ population prospect has forecasted Africa’s population
could double by 2036 and represent approximately a fifth of the population in the world by
2050 (UN, 2009). A corresponding policy syndrome is the concern over the rising
unemployment associated with the burgeoning demographic change (AERC, 2014).
According to recent literature, the growing unemployment (especially among the youth)
would be accommodated for the most part by entrepreneurship from the private sector
(Brixiova et al., 2015). This is essentially because public investments would be less linked to
such population growth and rising unemployment in the future (Asongu, 2013a). Whereas
ICT can be leveraged to enhance entrepreneurship in order to address such unemployment
challenges, as far as we are aware, the contemporary entrepreneurship literature has failed to
connect with the ICT, openness and the doing of business. There is a growing body of
literature on the employment of social media to promote entrepreneurship (Jones et al., 2015;
McCann & Barlow, 2015; Wang, 2016) and knowledge sharing in entrepreneurial success
(Allen et al., 2016).
Fourth, the available entrepreneurship literature for the most part has focused on,
among others, the: legal challenges to doing business (Taplin & Synman, 2004); cost of doing
business (Eifert et al., 2008); drivers of entrepreneurship in East Africa (Khavul et al., 2009);
intensity by which trade affects business cycle synchronization (Tapsoba, 2010); effect of
externalities in labour regulations on the cost of doing business (Paul et al., 2010); connection
between financial literacy and youth entrepreneurship (Oseifuah, 2010); long-run
poverty-reducing effect of entrepreneurship (Mensah & Benedict, 2010); intensions behind female
entrepreneurs (Singh et al., 2011); motivation behind undergraduate students’ ambition to
become entrepreneurs (Gerba, 2012; Ita et al., 2014) and role of the knowledge economy in
doing business (Tchamyou, 2016).
This study merges concerns from the four narratives above by assessing the role of
ICT in openness for entrepreneurship in SSA. The corresponding research question this
inquiry intends to address is: how does ICT complement openness to affect entrepreneurship
5 benefits of information technology, notably in: improving conditions for human emancipation
(Kautz, 2011; Venable et al., 2011; Hossain & Quaddus, 2011; Johri & Nair, 2011; Watts &
Wyner, 2011; Gripenberg, 2011) and changing society with opportunities for human
development (Tatnall, 2015; Kreps & Kimppa, 2015; Lennerfors et al., 2015; Aricat, 2015;
Lahtiranta et al., 2015; Patrignani & Whitehouse, 2015).
The rest of the study is structured as follows. Section 2 covers the theoretical
underpinnings and related literature on which the study is built. Section 3 discusses the data
and explains why the Generalised Method of Moments is employed as the estimation
technique in the work. The empirical results are presented and discussed in Section 4 with
emphasis on practical and theoretical policy implications. The conclusion in Section 5
summarises the findings and suggests future research directions.
2. Theoretical underpinnings and related literature
The broad literature on the climate of doing business and the performance of corporations has
been documented for Centuries (Asongu et al., 2014). To articulate the primary themes, Porter
(1990, 1998) employs a number of factors from the underpinnings of Adam Smith, namely:
the division of labour, economic specialisation and comparative advantage (Stigler, 1957;
Smith, 1937[1776]). Motivated by Smith, both regional scientists (e.g. economic geographers)
and regional economists (e.g. Paul Krugman) have substantially shown that the efficient
allocation of economic resources is determined by both location-specific and basic business
costs (Richardson, 1969). Drivers of such costs and corresponding benefits encompass the
availability of a plethora of factors, notably: primary production factors (entrepreneurship,
capital, labour and land); global and local commodities and money markets; conducive
physical and transport infrastructure systems; agglomeration avenues; ICT; social networks
and educational amenities such as universities/colleges/schools and libraries. The
underpinnings of Porter’s model have been supported in more contemporary business
literature (Neven & Droge, 2001).
In spite of the model by Porter, a general theory on the climate of business is
characterised with more complexity when compared to the optimal location theory of a
business or firm. It is a well known fact businesses are not always established in optimal
locations that reflect their higher profits and lowest costs. In SSA, N’da (2012) has
investigated the cost of doing business to conclude on nine principal determinants. They
6 (iii) property rights transfer and enforcement; (iv) security of loans; (v) investor protection;
(vi) ease of paying fees and taxes; (vii) cross border trade and other transactions; (viii)
compliance with contractual obligations and (ix) the ease with which insolvencies are
resolved and other conditions for closing down. Eifert et al. (2005) have assembled both
macroeconomic and microeconomic evidence on competitiveness in the African
manufacturing sectors to conclude that it is fundamentally determined by the climate of
business which influences external economies and comparative advantages of the underlying
sectors. They recommended reform in business practices/attitudes because the continent is
characterised with high costs relative to its productivity and income.
The business environment in SSA has been studied by Spring et al. (2013) who
concluded that appealing economic forces and features include: trade, economic prosperity,
foreign direct investment and infrastructure. The authors remarked that the environment of
business in SSA is challenging, especially in terms of hurdles in starting business, contract
enforcement, control of corruption and regulation quality. Gunning and Mengistae (2001)
surveyed the microeconomic evidence on manufacturing investment in the continent during
the 1990s. They inferred that the low investment rates are fundamentally due to risky political
risky business environments. The assessment by Devarajan et al. (2001) are not in accordance
with Gunning and Mengistae (2001) because cross-country and micro data from Tanzania
show that investment is not as low in Africa as suggested by the contending authors.
Fafchamps (2001) has reasoned that external transaction and network costs can
potentially influence market participants into engaging in unequal and inefficient long-run
associations while Stan and Garnsey (2006) have acknowledged that knowledge eases
entrepreneurship on the one hand and that entrepreneurship further boosts the growth of
knowledge on the other. The underlying reverse causality has been confirmed in more
contemporary African literature on KE. Accordingly, Tchamyou (2016) has examined the role
of KE in doing business whereas Asongu and Tchamyou (2016) have investigated the
influence of entrepreneurship in KE. Both studies have confirmed that causality runs both
ways, specifically: from KE to entrepreneurship and from entrepreneurship to KE
respectively.
Legal perspective of entrepreneurship changes and challenges in the South are
documented by Taplin and Synman (2004). The cost of doing business in Africa has been
investigated by Eifert et al. (2008) to establish that the indicators of doing business
7 conclusions of Paul et al. (2010) which maintain that doing business indicators from the
World Bank do not disclose a complete picture of workers’ employment. Entrepreneurship in
East Africa is for the most part motivated by family and community relationships (Khavul et
al., 2009) and trade influences the synchronisation in business cycles (Tapsoba, 2010).
The intension of undergraduate students to become entrepreneurs in Ethiopia was
investigated by Gerba (2012) who has established that it is fundamentally influenced by
content of business courses. Ita et al. (2014) assessed the factors that affect entrepreneurial
objectives among undergraduate students in Southeast and South-south Nigeria. They
concluded that personal attitude, perceived barrier and behavioural control are the most
significant issues. Other established qualitative influences include: push, affective, personal
fulfilment and transformational motivates. Singh et al. (2011) examined the determinants of
entrepreneurship among women in Nigeria to conclude on the following motivations:
deregulated economic and educational environments, family capital and internally-oriented
social recognition. The connection between entrepreneurship and financial literacy in South
Africa was studied by Oseifuah (2010) who found that the latter is a crucial driver of the
former. The long-term effects of entrepreneurship training were assessed by Mensah and
Benedict (2010). They recognised that government policy of distributing handouts with the
purpose of reducing poverty has short-run effects for the most part, with potential
consequences of violent protests and demonstrations, although entrepreneurship training does
provide opportunities for owners of established small corporations to mitigate poverty in the
longer term. As discussed in the introduction, this inquiry complements the engaged literature
by investigating the interconnections between mobile phones, openness and entrepreneurship
in SSA.
3. Data and Methodology
3.1 Data
This study investigates a panel of forty-nine counties in SSA with data from the World Bank
Development Indicators for the period 2000-2012. Whereas the choice of the periodicity is
motivated by data availability constraints at the time of writing, the scope of the region is
consistent with the motivation discussed in the introductory section. In line with recent
entrepreneurship literature (N’da, 2012; Tchamyou, 2016), we use ten indicators of doing
business to proxy for entrepreneurship. They comprise: (i) cost of business start-up procedure;
8 required to build a warehouse; (v) time required to enforce a contract; (vi) time required to
register a property; (vii) time required to start a business; (viii) time to export; (ix) time to
prepare and pay taxes and (x) time to resolve an insolvency. A decreasing tendency in these
variables implies a positive condition for entrepreneurship.
In accordance with Penard et al. (2012) cited in the introduction, ICT is measured with
Internet and mobile phone penetration whereas openness (or globalisation) is approximated by
trade (imports plus exports of commodities) and financial (foreign direct investment inflows)
openness. The rationale for the selection of the globalisation indicators is evidence in the
available literature that financial and trade transactions are intuitively linked with ICT
(Asongu, 2014a; Amavilah et al., 2017).
In order to account for omitted variable bias, five control variables are used. They are:
(i) the lagged dependent variables, (ii) Gross Domestic Product (GDP) growth, (iii)
population growth, (iv) educational quality and (v) foreign aid. After a preliminary
investigation, adopting more than five control variables leads to the proliferation of
instruments which ultimately biases estimated coefficients. Whereas from intuition the
last-four control variables are likely to positively affect the general doing of business
environment, their influence on specific entrepreneurship variables is largely contingent on
market expansion and dynamism. For example, the relevance of foreign aid is likely to be
sensitive to the type of aid and economic sector to which the development assistance is
allocated. The perception for these expected signs is consistent with Tchamyou (2016).
Education has been documented to affect entrepreneurship by Oseifuah (2010) and Gerba
(2012) while GDP growth is naturally expected to be associated with conditions of doing
business3. Unfortunately, the effect of economic prosperity on the doing of business variables
depends on whether GDP growth is skewed towards specific sectors of the economy such as
extractive industries. Hence, in the absence of broad-based economic growth, it is likely that
less business opportunities are available for the majority of the population. In the same vein, if
the growing population depends on imported commodities for the most part, it is likely to bear
negatively on the domestic conditions for the doing of business.
3
9 The definition of the variables and corresponding sources are provided in Appendix 1
whereas the summary statistics are disclosed in Appendix 2. The correlation matrix which is
used to inform on potential concerns about multicollinearity is provided in Appendix 3.
3. 2 Methodology
3.2.1 Estimation technique
The inquiry adopts a Generalised Method of Moments (GMM) estimation approach
for at least five main reasons. Whereas, the first-two are standard requirements for the
adoption of the approach, the last-three are advantages associated with the empirical strategy.
First, the estimation approach requires that the doing business variables are persistent. As
apparent in Appendix 4, the indicators of doing business are persistent because the correlation
between level observations and their corresponding lagged values is higher than the rule of
thumb threshold of 0.800. Second, the requirement of the number of countries (N) being
higher than the number of years (T) is met because N (49)>T(13). Third, the estimation
technique accounts for endogeneity by controlling for simultaneity and time-invariant omitted
variables. Fourth, cross-country differences are not eliminated in the estimation approach.
Whereas country-fixed impacts are eliminated in the GMM approach, cross-country variations
are automatically considered in the estimations because the technique is by definition
consistent to panel data analysis. Fifth, small sample biases in the difference estimator are
corrected by the system estimator. It is fundamentally for this fifth reason that Bond et al.
(2001, p. 3-4) have maintained that the system GMM technique (Arellano & Bover, 1995;
Blundell & Bond, 1998) is better than the difference GMM approach (Arellano and Bond,
1991).
In this study, we instead employ the Arellano and Bover (1995) extension by
Roodman (2009a, 2009b) which uses forward orthogonal deviations instead of first
differences because it has been renowned to restrict instrument proliferation and control for
cross-sectional dependence (Baltagi, 2008; Love & Zicchino, 2006). A two-step specification
procedure is adopted because it controls for heteroscedasticity. It is important to note that the
one-step approach is homoscedasticity-consistent.
The following equations in levels (1) and first difference (2) summarize the standard
10 t i t i t i h h h t i t i t i t i t
i B ICT Op ICTOp W
B ,, ,
4 1 , 4 , 3 , 2 , 1 0 ,
(1)
hit hit t t it h h t i t i t i t i t i t i t i t i t i t i W W ICTOp ICTOp Op Op ICT ICT B B B B , 2 , , , , 4 1 , , 3 , , 3 , , 2 2 , , 1 , , ) ( ) ( ) ( ) ( ) ( ) ( (2)where, Bi,t is a doing business indicator of country i at period t; 0 is a constant;
represents the autoregressive order; ICT, (mobile phone and Internet penetration rates);
Op, openness (trade and foreign direct investment); ICTOp, is the interaction between ICT
and openness; W is the vector of control variables (GDP growth, population growth,
educational quality and foreign aid), i is the country-specific effect, t is the time-specific
constant and i,t the error term. Given that the estimation strategy involves interactive
regressions, we conform to Brambor et al. (2006) in including all constituent interactive
variables in the specifications.
The main shortcoming of the GMM technique is that the approach eliminates
country-specific impacts which potentially represent the unobserved heterogeneity. Unfortunately, this
elimination is necessary to avoid estimation biases. Fortunately however, some level of the
unobserved heterogeneity is also considered by the adopted GMM approach because it
controls for time-invariant omitted variables. Another potential drawback is that estimated
coefficients are interpreted as short-term impacts because, for the most part, the adoption of
GMM complies with data averages. In this study, we are not using data averages.
3.2.2 Identification and exclusion restriction
Consistent with recent literature (Love & Zicchino, 2006; Dewan & Ramaprasad, 2014;
Asongu & Nwachukwu, 2016a, 2016b) all explanatory variables are treated as suspected
endogenous or predetermined indicators. Hence, the gmmstyle is adopted for them.
Furthermore, only years are treated as exogenous and the approach for treating ivstyle(years)
is ‘iv(years, eq[diff])’ because it is not apparent for the years to become endogenous in first-difference (Roodman, 2009b).
The concern about simultaneity is tackled by using lagged regressors as instruments
for the forward-differenced variables. Consequently, fixed impacts that evidently influence
11 line with Love and Zicchino (2006). Such transformations consist of forward
mean-differencing of indicators: contrary to subtracting past observations from present ones
(Roodman, 2009b, p. 104), the average of future observations is subtracted from the variables.
The transformation enables orthogonal or parallel conditions between lagged variables and
forward-differenced indicators. Irrespective of lagged numbers, in order to limit data loss, the
transformations are computed for all observations, except for the last in each cross-section.
“And because lagged observations do not enter the formula, they are valid as instruments”
(Roodman, 2009b, p. 104).
With the above in mind, years or time invariant variables which are hypothesised to
exhibit strict exogeneity influence entrepreneurship variables exclusively via endogenous
explaining variables. The statistical validity of the exclusion restriction is investigated with
the Difference in Hansen Test (DHT) for instrument exogeneity. The null hypothesis of the
test should not be rejected for the strictly exogenous instruments (or years) to elucidate the
entrepreneurship variables exclusively via the predetermined explanatory variables. The DHT
is hence, employed to investigate whether the time invariant variables exhibit strict
exogeneity by not explaining entrepreneurship beyond the suggested channels (or endogenous
explaining variables). Thus, in the section that follows, the reported findings should confirm
the validity of the exclusion restriction if the null hypotheses of DHT corresponding to IV
(year, eq[diff]) are not rejected.
4. Empirical results
4. 1 Presentation of results
Table 1, Table 2, Table 3 and Table 4 respectively present the first, second, third and fourth
sets of specifications on linkages between ICT, openness and entrepreneurship. Table 1 is
concerned with the: (i) cost of business start-up procedures, (ii) procedures to enforce a
contract and (iii) start-up procedures to register a business. Table 2 focuses on the: (iv) time
required to build a warehouse; (v) time required to enforce a contract and (vi) time required to
register a property. In Table 3, emphasis is made on the: (vii) time required to start a business
(viii) time to export and (ix) time to prepare and time to pay taxes whereas Table 4 focuses
on (x) the time required to resolve an insolvency. For each doing business indicator, there are
four specifications: two pertaining to trade openness and two related to financial openness.
For either openness indicators, one specification employs the mobile phone penetration policy
12 Four information criteria are used to investigate the validity of the GMM estimations
(Asongu & De Moor, 2017, p. 200). (i) The null hypothesis of the second-order Arellano and
Bond autocorrelation test (AR [2]) which argues for the absence of autocorrelation in the
residuals should not be rejected. (ii) The Sargan and Hansen over-identification restrictions
(OIR) tests should be insignificant because their null hypotheses are the positions that
instruments are valid or uncorrelated with the error terms. Accordingly, whereas the Sargan
OIR test is not robust but not weakened by instruments, the Hansen OIR is robust but
weakened by instruments. In order to restrict identification or limit the proliferation of
instruments, we have ensured that instruments are lower than the number of cross-sections in
most specifications. (iii) The Difference in Hansen Test (DHT) for exogeneity of instruments
is also employed to examine the validity of results from the Hansen OIR test. (iv) We also
provide a Fischer test for the joint validity of estimated coefficients.
In order to assess the role of ICT in modulating the effect of openness on
entrepreneurship, the net effect is computed. For example, in Table 1, in the second to the last
column, the net effect from the interaction between mobile phones and financial openness on
‘start-up procedures to register a business’ is -0.009 ([0.0004× 23.379] + [-0.019]). Where,
the mean value of mobile phone penetration is 23.379, the unconditional impact of financial
openness is -0.019 while the conditional effect from the interaction between financial
openness and mobile phones is 0.0004.
13 Table 1: ICT, Openness and Entrepreneurship (First set of specifications)
Dependent variables: Cost of business start-up procedure, Procedure to enforce a contract and Start-up procedure to register a business
Cost of business start-up procedure (Costostart)
Procedure to enforce a contract (Contractenf)
Start-up procedures to register a business (Startupproced)
Trade Openness Financial Openness Trade Openness Financial Openness Trade Openness Financial Openness
Constant -31.811 -46.097*
-40.854** -55.97*** 0.530 0.241 0.177 1.249*** 0.435 0.293 -0.216 -0.441
(0.175) (0.094) (0.011) (0.000) (0.206) (0.572) (0.663) (0.005) (0.435) (0.598) (0.647) (0.220) Costostart (-1) 0.868**
*
0.843** *
0.939*** 0.975*** --- --- --- --- --- --- --- ---
(0.000) (0.000) (0.000) (0.000)
Contractenf(-1) --- --- --- --- 0.968*** 0.982**
*
0.996*** 0.966*** --- --- --- ---
(0.000) (0.000) (0.000) (0.000)
Startupproced (-1) --- --- --- --- --- --- --- --- 0.958*** 0.958*** 0.958**
*
0.986** * (0.000) (0.000) (0.000) (0.000)
Mobile 0.037 --- 0.203** --- 0.001 --- -0.0004 --- -0.017*** --- 0.0002 ---
(0.856) (0.047) (0.521) (0.605) (0.001) (0.948)
Internet --- -0.571 --- 0.993*** --- 0.015**
*
--- -0.0005 --- -0.081*** --- -0.013
(0.453) (0.006) (0.007) (0.799) (0.000) (0.128)
Trade -0.140 0.018 --- --- 0.002*** 0.005**
*
--- --- -0.002 -0.005 --- ---
(0.140) (0.896) (0.000) (0.000) (0.213) (0.137)
FDI --- --- 0.459 0.854*** --- --- 0.001 0.004*** --- ---
-0.019**
0.0004
(0.104) (0.000) (0.683) (0.002) (0.024) (0.903)
Mobile.Trade 0.004** *
--- --- --- -0.00004 ***
--- --- --- 0.0001*** --- --- ---
(0.002) (0.002) (0.000)
Mobile.FDI --- --- -0.00001 --- --- --- 0.00001 --- --- --- 0.0004*
**
---
(0.998) (0.815) (0.006)
Internet.Trade --- 0.012* --- --- ---
-0.0001* **
--- --- --- 0.0007*** --- ---
(0.070) (0.000) (0.000)
Internet.FDI --- --- --- -0.009 --- --- --- -0.0002** --- --- --- 0.001**
*
(0.667) (0.045) (0.006)
GDP growth 0.436 0.327 0.620*** 0.650*** -0.002 0.004 0.0004 0.001 -0.001 0.002 0.003 0.0006 (0.132) (0.301) (0.000) (0.003) (0.411) (0.241) (0.838) (0.610) (0.720) (0.457) (0.589) (0.862)
Popg 20.471*
**
22.021* **
3.967 5.338 -0.008 -0.006 -0.028 -0.003 0.204** 0.176* 0.077 0.147** * (0.000) (0.000) (0.552) (0.296) (0.791) (0.738) (0.470) (0.842) (0.024) (0.050) (0.399) (0.001)
Education 0.538* 0.228 0.569** 0.887*** -0.002 -0.0004 -0.00005 -0.0004 0.001 -0.0009 0.002 0.0003
(0.098) (0.567) (0.018) (0.003) (0.283) (0.796) (0.977) (0.794) (0.826) (0.866) (0.585) (0.952) Foreign Aid
-1.665** *
-1.797** *
-1.590*** -1.909*** -0.001*** -0.003** *
-0.001 -0.001*** -0.022*** -0.024*** -0.020** *
-0.025** * (0.000) (0.000) (0.000) (0.000) (0.003) (0.000) (0.140) (0.008) (0.002) (0.000) (0.000) (0.000)
Net Effects na na na na na 0.001 na 0.003 na na -0.009 na
AR(1) (0.024) (0.026) (0.022) (0.025) (0.047) (0.069) (0.050) (0.071) (0.004) (0.004) (0.004) (0.005) AR(2) (0.538) (0.530) (0.531) (0.587) (0.049) (0.071) (0.049) (0.056) (0.565) (0.520) (0.536) (0.564)
Sargan OIR (0.040) (0.038) (0.039) (0.328) (0.997) (0.968) (0.997) (0.999) (0.876) (0.628) (0.158) (0.043) Hansen OIR (0.602) (0.430) (0.287) (0.464) (0.804) (0.455) (0.594) (0.706) (0.516) (0.201) (0.558) (0.743)
DHT for instruments (a)Instruments in levels
H excluding group (0.625) (0.272) (0.744) (0.310) (0.769) (0.937) (0.876) (0.761) (0.324) (0.424) (0.742) (0.184)
Dif(null, H=exogenous)
(0.494) (0.543) (0.140) (0.551) (0.668) (0.183) (0.335) (0.538) (0.604) (0.164) (0.376) (0.950)
(b) IV (years, eq(diff))
14
Dif(null, H=exogenous)
(0.558) (0.372) (0.076) (0.354) (0.296) (0.078) (0.318) (0.241) (0.042) (0.024) (0.047) (0.163)
Fisher 722.13*
**
3199.7* **
7025.5*** 5752.2*** 9486.5*** 11967** *
23392*** 7864.1*** 3412.6*** 4495.0*** 1878.9* **
2221.0* **
Instruments 38 38 38 38 38 38 38 38 38 38 38 38
Countries 45 44 45 44 45 44 45 44 45 44 45 44
Observations 267 262 269 264 267 262 269 264 267 262 269 264
*,**,***: significance levels of 10%, 5% and 1% respectively. DHT: Difference in Hansen Test for Exogeneity of Instruments’ Subsets. Dif: Difference. OIR: Over-identifying Restrictions Test. The significance of bold values is twofold. 1) The significance of estimated coefficients, Hausman test and the Fisher statistics. 2) The failure to reject the null hypotheses of: a) no autocorrelation in the AR(1) and AR(2) tests and; b) the validity of the instruments in the OIR and DHT tests. na: not applicable because at least one estimated coefficient needed for the computation of net effects is not significant. The mean value of mobile phone penetration is 23.379 while the mean value of Internet
[image:15.595.64.586.293.761.2]penetration is 4.152.
Table 2: ICT, Openness and Entrepreneurship (Second set of specifications)
Dependent variables: Time required to build a warehouse, Time required to enforce a contract and Time required to register a property
Time required to build a warehouse (Timewarehouse)
Time required to enforce a contract (Timenforcontr)
Time required to register a property (Timeregroup)
Trade Openness Financial Openness Trade Openness Financial Openness Trade Openness Financial Openness
Constant 15.812** 47.573* **
4.400 19.593*** 63.834* 9.993 112.68*** 3.803 11.841 32.180* *
14.826*** 36.287* ** (0.029) (0.001) (0.483) (0.006) (0.060) (0.680) (0.000) (0.713) (0.113) (0.017) (0.006) (0.000)
Timewarehouse (-1)
0.863*** 0.852** *
0.904*** 0.874*** --- --- --- --- --- --- --- ---
(0.000) (0.000) (0.000) (0.000)
Timenforcontr(-1) --- --- --- --- 0.995*** 1.028*** 0.953*** 1.000** *
--- --- --- ---
(0.000) (0.000) (0.000) (0.000)
Timeregroup(-1) --- --- --- --- --- --- --- --- 0.861**
*
0.797** *
0.843*** 0.730** * (0.000) (0.000) (0.000) (0.000)
Mobile 0.164* --- 0.169*** --- -0.473** --- -0.718*** --- -0.015 --- -0.074* ---
(0.086) (0.002) (0.013) (0.000) (0.869) (0.065)
Internet --- -0.094 --- -0.050 --- -2.591*** ---
-1.393** * --- -1.012** --- -0.754** *
(0.795) (0.775) (0.000) (0.000) (0.013) (0.000)
Trade -0.068*
-0.195**
--- --- -0.036 -0.320** --- ---
-0.116** -0.174** *
--- ---
(0.067) (0.011) (0.700) (0.029) (0.048) (0.008)
FDI --- --- 0.695*** -0.031 --- --- -1.620*** -0.963** *
--- --- -0.320** -0.311** * (0.000) (0.521) (0.003) (0.000) (0.017) (0.000)
Mobile.Trade 0.00004 --- --- --- 0.0007 --- --- --- 0.0005 --- --- ---
(0.948) (0.601) (0.586)
Mobile.FDI --- --- -0.012*** --- --- --- 0.041*** --- --- --- 0.003* ---
(0.000) (0.002) (0.085)
Internet.Trade --- 0.0008 --- --- --- 0.031*** --- --- --- 0.007** --- ---
(0.718) (0.000) (0.029)
Internet.FDI --- --- --- 0.024*** --- --- --- 0.265**
*
--- --- --- 0.016** * (0.005) (0.000) (0.007)
GDP growth 0.040 -0.064 -0.085 0.058 1.225*** 1.141*** 1.085*** 1.720** *
0.210 0.251 0.386*** 0.316
(0.726) (0.557) (0.419) (0.647) (0.001) (0.006) (0.000) (0.000) (0.250) (0.171) (0.005) (0.141) Popg 0.109 -1.527* 2.663* -0.075 -9.126*** -9.036*** -6.607* 0.628 0.860 1.146 2.380* 1.879*
(0.927) (0.072) (0.057) (0.955) (0.001) (0.000) (0.062) (0.768) (0.514) (0.472) (0.097) (0.080)
Education 0.325* -0.073 0.139* 0.143 -0.383 0.187 -0.784*** -0.274**
-0.074 -0.172 -0.250*** -0.371** (0.054) (0.675) (0.092) (0.210) (0.259) (0.496) (0.000) (0.021) (0.569) (0.284) (0.007) (0.010)
Foreign Aid -0.392*** -0.319**
15
*
(0.000) (0.000) (0.000) (0.000) (0.379) (0.714) (0.506) (0.737) (0.498) (0.060) (0.152) (0.222)
Net Effects na na 0.414 na na -0.191 -0.661 0.137 na -0.144 -0.249 -0.244
AR(1) (0.136) (0.143) (0.127) (0.132) (0.101) (0.120) (0.091) (0.085) (0.061) (0.070) (0.064) (0.076) AR(2) (0.114) (0.194) (0.147) (0.213) (0.694) (0.437) (0.417) (0.349) (0.204) (0.193) (0.239) (0.131)
Sargan OIR (0.664) (0.512) (0.208) (0.077) (0.325) (0.091) (0.162) (0.307) (0.760) (0.833) (0.932) (0.944)
Hansen OIR (0.642) (0.763) (0.824) (0.788) (0.870) (0.706) (0.377) (0.097) (0.974) (0.946) (0.908) (0.659)
DHT for instruments (a)Instruments in levels
H excluding group (0.732) (0.501) (0.700) (0.718) (0.404) (0.502) (0.296) (0.129) (0.851) (0.786) (0.777) (0.501)
Dif(null, H=exogenous)
(0.477) (0.776) (0.741) (0.677) (0.939) (0.703) (0.451) (0.182) (0.936) (0.899) (0.834) (0.646)
(b) IV (years, eq(diff))
H excluding group (0.486) (0.742) (0.661) (0.905) (0.838) (0.667) 0.459) (0.202) (0.938) (0.801) (0.909) (0.460)
Dif(null, H=exogenous)
(0.776) (0.538) (0.882) (0.253) (0.644) (0.558) (0.286) (0.111) (0.849) (0.967) (0.584) (0.823)
Fisher 2178.4*** 1374.5* **
880.26*** 3115.8*** 5878.7*** 14160*** 15754*** 23541** *
629.17* **
651.30* **
1588.7*** 807.74* **
Instruments 36 36 36 36 38 38 38 38 37 37 37 37
Countries 44 43 44 43 45 44 45 44 45 44 45 44
Observations 205 200 207 202 267 262 269 264 241 236 243 238
*,**,***: significance levels of 10%, 5% and 1% respectively. DHT: Difference in Hansen Test for Exogeneity of Instruments’ Subsets. Dif: Difference. OIR: Over-identifying Restrictions Test. The significance of bold values is twofold. 1) The significance of estimated coefficients, Hausman test and the Fisher statistics. 2) The failure to reject the null hypotheses of: a) no autocorrelation in the AR(1) and AR(2) tests and; b) the validity of the instruments in the OIR and DHT tests. na: not applicable because at least one estimated coefficient needed for the computation of net effects is not significant. The mean value of mobile phone penetration is 23.379 while the mean value of Internet
[image:16.595.67.583.501.763.2]penetration is 4.152.
Table 3: ICT, Openness and Entrepreneurship (Third set of specifications)
Dependent variables: Time required to start a business, Time to exports and Time to prepare and pay taxes
Time required to start a business (Timestartbus)
Time to export (Timexport) Time to prepare and pay taxes (Timetaxes)
Trade Openness Financial Openness Trade Openness Financial Openness Trade Openness Financial Openness
Constant -7.543 -4.997 -14.58*** -13.51***
-3.653**
-5.830*** -1.805 2.289** 12.016 20.406 1.393 4.933
(0.289) (0.300) (0.000) (0.000) (0.032) (0.001) (0.284) (0.038) (0.461) (0.283) (0.851) (0.732)
Timestartbus(-1) 1.132*** 1.063*** 0.898*** 0.970** --- --- --- --- --- --- --- ---
(0.000) (0.000) (0.000) (0.000)
Timexport(-1) --- --- --- --- 0.970**
*
1.031*** 0.922*** 0.0982*** --- --- --- ---
(0.000) (0.000) (0.000) (0.000)
Timetaxes(-1) --- --- --- --- --- --- --- --- 1.031**
* 1.039** * 1.013** * 1.017** * (0.000) (0.000) (0.000) (0.000)
Mobile -0.045 --- 0.063* --- 0.026* --- 0.016 --- -0.201* --- -0.039 ---
(0.539) (0.065) (0.095) (0.117) (0.082) (0.479)
Internet --- -0.633*** --- 0.044 --- -0.005 --- -0.088*** --- -1.014* --- 0.092
(0.004) (0.582) (0.924) (0.003) (0.079) (0.781)
Trade -0.114*** -0.192*** --- --- 0.021**
*
0.035*** --- --- -0.253** *
-0.188**
--- ---
(0.003) (0.000) (0.003) (0.001) (0.001) (0.047)
FDI --- --- 0.267*** 0.091* --- --- 0.013 -0.026*** --- --- -0.179 -0.025
16
Mobile.Trade 0.001** --- --- --- -0.0001 --- --- --- 0.002**
*
--- --- ---
(0.038) (0.432) (0.001)
Mobile.FDI --- --- -0.002* --- --- --- -0.0003 --- --- --- 0.002 ---
(0.070) (0.647) (0.319)
Internet.Trade --- 0.009*** --- --- --- -0.0001 --- --- --- 0.009** --- ---
(0.000) (0.799) (0.025)
Internet.FDI --- --- --- 0.019** --- --- --- 0.002 --- --- --- -0.005
(0.019) (0.272) (0.470)
GDP growth 0.382*** 0.124* 0.036 0.086
-0.062**
-0.032 -0.061* -0.102*** -0.216 -0.205 -0.177* -0.269** (0.000) (0.096) (0.664) (0.148) (0.044) (0.183) (0.077) (0.002) (0.244) (0.241) (0.075) (0.030)
Popg -0.957 0.767 2.279** 3.240*** 0.058 0.173 -0.541** -0.772*** 0.393 0.748 1.036 0.821 (0.322) (0.108) (0.018) (0.000) (0.801) (0.233) (0.032) (0.009) (0.724) (0.678) (0.268) (0.581) Education 0.216** 0.244*** 0.153*** 0.095** 0.045 0.030 0.086*** 0.0005 -0.183 -0.477* -0.204 -0.282
(0.048) (0.001) (0.005) (0.015) (0.141) (0.223) (0.006) (0.982) (0.484) (0.064) (0.225) (0.230) Foreign Aid -0.155*** -0.104*** -0.320*** -0.320*** 0.006 -0.007 0.026** 0.028** 0.213**
*
0.159** 0.050* 0.043
(0.001) (0.000) (0.000) (0.000) (0.223) (0.386) (0.022) (0.011) (0.001) (0.028) (0.057) (0.255)
Net Effects -0.090 -0.154 0.220 0.169 na na na na -0.206 -0.150 na na
AR(1) (0.078) (0.088) (0.072) (0.076) (0.008) (0.034) (0.014) (0.035) (0.112) (0.110) (0.110) (0.105)
AR(2) (0.460) (0.510) (0.503) (0.444) (0.506) (0.751) (0.350) (0.963) (0.179) (0.187) (0.168) (0.199)
Sargan OIR (0.157) (0.011) (0.000) (0.000) (0.385) (0.850) (0.635) (0.941) (0.989) (0.999) (0.951) (0.998)
Hansen OIR (0.652) (0.832) (0.406) (0.621) (0.530) (0.823) (0.216) (0.198) (0.375) (0.753) (0.737) (0.903)
DHT for instruments (a)Instruments in levels
H excluding group (0.524) (0.193) (0.284) (0.279) (0.125) (0.950) (0.418) (0.495) (0.726) (0.676) (0.292) (0.985)
Dif(null, H=exogenous)
(0.622) (0.984) (0.500) (0.770) (0.848) (0.550) (0.181) (0.138) (0.213) (0.654) (0.878) (0.638)
(b) IV (years, eq(diff))
H excluding group (0.738) (0.801) (0.609) (0.525) (0.591) (0.714) (0.131) (0.245) (0.395) (0.754) (0.758) (0.814)
Dif(null, H=exogenous)
(0.362) (0.615) (0.188) (0.612) (0.327) (0.773) (0.656) (0.239) (0.350) (0.505) (0.442) (0.824)
Fisher 1644.5*** 2476.5*** 2271.0*** 1150.8*** 293.75* **
1890.6*** 961.32*** 7669.3*** 4017.4* **
5334.5* **
5317.9* **
3340.3* **
Instruments 38 38 38 38 36 36 36 36 36 36 36 36
Countries 45 44 45 44 45 44 45 44 45 44 45 44
Observations 267 262 269 164 211 206 213 208 211 206 213 208
*,**,***: significance levels of 10%, 5% and 1% respectively. DHT: Difference in Hansen Test for Exogeneity of Instruments’ Subsets. Dif: Difference. OIR: Over-identifying Restrictions Test. The significance of bold values is twofold. 1) The significance of estimated coefficients, Hausman test and the Fisher statistics. 2) The failure to reject the null hypotheses of: a) no autocorrelation in the AR(1) and AR(2) tests and; b) the validity of the instruments in the OIR and DHT tests. na: not applicable because at least one estimated coefficient needed for the computation of net effects is not significant. The mean value of mobile phone penetration is 23.379 while the mean value of Internet
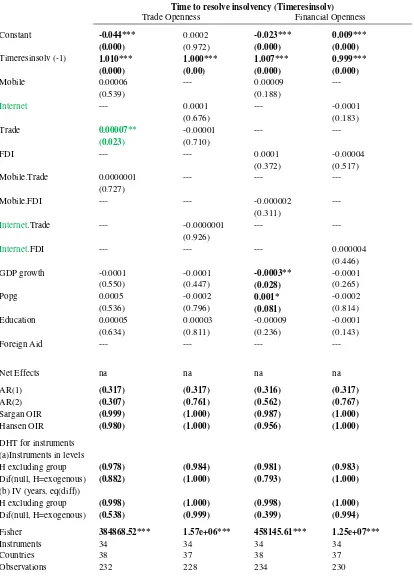
17 Table 4: ICT, Openness and Entrepreneurship (Fourth set of specifications)
Time to resolve insolvency (Timeresinsolv)
Trade Openness Financial Openness
Constant -0.044*** 0.0002 -0.023*** 0.009***
(0.000) (0.972) (0.000) (0.000)
Timeresinsolv (-1) 1.010*** 1.000*** 1.007*** 0.999***
(0.000) (0.00) (0.000) (0.000)
Mobile 0.00006 --- 0.00009 ---
(0.539) (0.188)
Internet --- 0.0001 --- -0.0001
(0.676) (0.183)
Trade 0.00007** -0.00001 --- ---
(0.023) (0.710)
FDI --- --- 0.0001 -0.00004
(0.372) (0.517) Mobile.Trade 0.0000001 --- --- ---
(0.727)
Mobile.FDI --- --- -0.000002 --- (0.311)
Internet.Trade --- -0.0000001 --- ---
(0.926)
Internet.FDI --- --- --- 0.000004
(0.446) GDP growth -0.0001 -0.0001 -0.0003** -0.0001 (0.550) (0.447) (0.028) (0.265) Popg 0.0005 -0.0002 0.001* -0.0002 (0.536) (0.796) (0.081) (0.814) Education 0.00005 0.00003 -0.00009 -0.0001 (0.634) (0.811) (0.236) (0.143)
Foreign Aid --- --- --- ---
Net Effects na na na na
AR(1) (0.317) (0.317) (0.316) (0.317)
AR(2) (0.307) (0.761) (0.562) (0.767)
Sargan OIR (0.999) (1.000) (0.987) (1.000)
Hansen OIR (0.980) (1.000) (0.956) (1.000)
DHT for instruments (a)Instruments in levels
H excluding group (0.978) (0.984) (0.981) (0.983)
Dif(null, H=exogenous) (0.882) (1.000) (0.793) (1.000)
(b) IV (years, eq(diff))
H excluding group (0.998) (1.000) (0.998) (1.000)
Dif(null, H=exogenous) (0.538) (0.999) (0.399) (0.994)
Fisher 384868.52*** 1.57e+06*** 458145.61*** 1.25e+07***
Instruments 34 34 34 34
Countries 38 37 38 37
Observations 232 228 234 230
18 The following findings can be established from Tables 1-4. First, net effects on the
‘cost of business start-up procedure’, ‘time to export’ and ‘time to resolve an insolvency’
from the interaction of ICT with openness are not apparent because at least one estimate
required for their computations is not significant. Second, there are positive net effects from
the role of the Internet on openness (trade and FDI) in the number of procedures required to
enforce a contract. Third, the net effect from the interaction between mobile phones and
financial openness on the ‘number start-up procedures to register a business’ is negative.
Fourth, mobile phone (Internet) penetration interacts with financial openness to have positive
net effect on the ‘time required to build a warehouse’ (time required to enforce a contract).
Fifth, trade (FDI) interacts with the Internet (mobile phones) to have a net effect in reducing
the time required to enforce a contract whereas for the most part, ICT complements openness
to reduce the time required to register a property. Sixth, ICT interacts with trade openness to
have net negative effects on the ‘time required to start a business’ and the ‘time required to prepare and pay taxes’.
4.2 Further discussion of results and policy implications
4.2.1 Further discussion of results and practical implications
As apparent from the findings while there is substantial evidence that ICT complements
openness to improve conditions for entrepreneurship, the effects are contingent on the
dynamics of openness, ICT and entrepreneurship. The findings broadly suggest that
transparency through ICT is important in the effect of openness on doing business constraints.
The relevance of ICT in facilitating the doing of business is consistent with intuition and the
literature because ICT contributes to enhancing competition, essentially because of falling
cost/traffic per minute and positive externalities owing to network avenues (Gutierrez et al.,
2009; Gille et al., 2002 ; Esselaar et al., 2007 ; Gilwald & Stork, 2008).
We have also established insignificant net estimates on constraints to doing business.
This pattern of the findings is consistent with a recent co-publication by the International
Finance Corporation and the World Bank on ‘Doing Business in the East African
Community’ (World Bank, 2013) which shows that among 185 countries only ten countries in
SSA rank among the top one hundred in terms of ease of doing business. The next set of a
small group of countries fall between the 109th and 134th places while for the most part,
19 not consider ICT as the primary factor, ICT is among the several determinants for the ease of
doing business.
The insignificant net effects are an indication that ICT penetration needs to be
enhanced. This is essentially because the corresponding marginal effects for the most part are
negative on the constraints to doing business, notably the interaction between: (i) Internet and
both openness indicators in the number of procedures required to enforce a contract and (ii)
FDI and mobile phones on the time required to build a warehouse and the time required to
start a business. In essence, certain thresholds of ICT penetration are required to achieve the
desirable negative effects on constraints to doing business. To put this point into perspective,
in Table 1: (i) 50 (0.005/0.0001) per 100 people in Internet penetration and (ii) 20
(0.004/0.0002) per 100 people in Internet penetration are required to respectively reverse the
positive effects of trade and FDI on the number of procedures required to enforce a contract.
In Table 2, 57.916 (0.695/0.012) per 100 people in mobile phone penetration is required to
reverse the positive effect of FDI on the time required to build a warehouse while in Table 3
the corresponding threshold on the time required to start a business is 133.5 (0.267/0.002) per
100 people in mobile phone penetration. The established thresholds at which ICT changes the
effect of openness to reduce constraints to doing business make economic sense for the most
part because they are within the ranges provided by summary statistics, notably: 0.000 to
147.202 for mobile phone penetration and 0.005 to 43.605 for Internet penetration.
In the light of the above, ICT can be enhanced to reach the computed ICT modifying
policy thresholds by adopting policies designed to boost ICT penetration. Hence, it is relevant
for policy makers to address issues associated with the absence of adequate infrastructure as
well as concerns surrounding affordability of ICT which represents important barriers to ICT
penetration. Schemes on universal coverage through low pricing and provision of ICT
infrastructure are some steps in this direction. Hence, ICT can play the role of an interface
between openness policies, business constraints and entrepreneurs (present and potential).
Such interfaces can be facilitated if ICT policies are designed to enhance, inter alia:
cost-effectiveness, adoption, efficiency, access, reach and interactions.
4.2.2 Theoretical contributions/implications
Two main theoretical contributions of this study are connected to the literature,
notably, complementary narratives on reducing information asymmetry and catch-up in the
20 negative effects on doing business constraints is an indication that ICT reduces information
asymmetry related to openness by providing timely information that facilitates the doing of
business. Moreover, the inference also accords with the established evidence that ICT is
negatively (positively) associated with the formal (informal) economic sector of economies in
Africa (Asongu, 2013b), which further implies that entrepreneurial activities owing to
increased globalisation are not exclusively limited to the formal economic sector and large
companies. In a nutshell, openness-driven by ICT policies enable conditions that reduce
informational rents that previously constrained the doing of business. In other words, the
complementarity between ICT and openness improves business efficiency, which is broadly
consistent with the theoretical underpinnings on financial allocation efficiency by means of
information sharing in the banking industry (Claus & Grimes, 2003). In the light of these
analogies, the theoretical basis of information sharing in the financial industry can be
extended to information asymmetry associated with increasing economic and financial
openness.
Second, it is apparent from the findings that some doing business indicators are more
stationary (or non-persistent or convergent) than others. For instance three main tendencies
are apparent, namely: (i) consistently stationary (cost of business start-up procedure; number
of procedures to enforce a contract; number of start-up procedures to enforce a contract; time
required to build a warehouse and time required to register a property); (ii) consistently
non-stationary (time required to prepare and pay taxes) and (iii) both non-stationary and non-non-stationary
(time required to enforce a contract; time required to start a business; time to export and time
to resolve an insolvency) business variables. From an economic interpretative standpoint,
stationary (or evidence of convergence) implies that common policies on doing business can
be adopted among countries because cross-country differences in the observed business
variables are decreasing. The economic interpretation further indicates that theoretical
underpinnings in the catch-up can be understood beyond income convergence (Asongu,
2014b). Such a theoretical insight is consistent with both studies on the neoclassical growth
models (Solow, 1956; Swan, 1956; Baumol, 1986; Barro, 1991; Barro & Sala-i-Martin, 1992,
1995; Mankiw et al., 1992; Fung, 2009) and other fields of economic development, notably:
the knowledge economy (Asongu, 2017b); financial markets (Narayan et al., 2011; Bruno et
al., 2012); negative government signals in the prediction of social unrests (Asongu &
21 5. Conclusion and future research directions
This study has examined how ICT influences openness to improve conditions of doing
business in sub-Saharan Africa for the period 2000-2012. ICT is proxied with Internet and
mobile phone penetration rates whereas openness is measured in terms of financial and trade
globalisation. Ten doing business indicators are used. The empirical evidence is based on
GMM with forward orthogonal deviations.
It is apparent from the findings that while there is substantial evidence that ICT
complements openness to improve conditions for entrepreneurship, the effects are contingent
on the dynamics of openness, ICT and entrepreneurship. Theoretical and practical policy
implications have been discussed. Future research can improve extant literature by assessing
how other policy variables can complement the ineluctable phenomenon of globalisation to
improve entrepreneurship in SSA. Exploring good governance mechanisms should be a good
step in this direction. Moreover, assessing how such interactions directly affect inclusive
22 Appendices
Appendix 1: Definitions of variables
Variables Signs Definitions of variables (Measurements) Sources
Cost of starting business
Costostart Cost of business start-up procedures (% of GNI per capita)
World Bank (WDI)
Contract enforcement
Contractenf Procedures to enforce a contract (number) World Bank (WDI) Start-up
procedure
Startupproced Start-up procedures to register a business (number) World Bank (WDI) Ware house time Timewarehouse Time required to build a warehouse (days) World Bank
(WDI) Time to enforce a
contract
Timenforcontr Timenforcontr: Time required to enforce a contract (days)
World Bank (WDI)
Time to register a property
Timeregprop Time required to register a property (days) World Bank (WDI) Time to start a
business
Timestartbus Time required to start a business (days) World Bank (WDI) Time to export Timexport Time to export (days) World Bank
(WDI) Time to pay
taxes
Timetaxes Time to prepare and pay taxes (hours) World Bank (WDI) Resolving an
insolvency
Timeresinsolv Time to resolve insolvency (years) World Bank (WDI) Trade Openness Trade Imports plus Exports of Commodities (% of GDP) World Bank
(WDI)
Foreign investment
FDI Foreign Direct Investment inflows (% of GDP) World Bank (WDI) Mobile phones Mobile Mobile phone subscriptions (per 100 people) World Bank
(WDI) Internet Internet Internet penetration (per 100 people) World Bank
(WDI)
GDP growth GDPg Gross Domestic Product (GDP) growth (annual %) World Bank (WDI) Population
growth
Popg Population growth rate (annual %) World Bank (WDI)
Foreign aid Aid Total Development Assistance (% of GDP) World Bank (WDI) Educational
Quality
Educ Pupil teacher ratio in Primary Education World Bank (WDI)
23 Appendix 2: Summary statistics (2000-2012)
Mean SD Minimum Maximum Observations
Cost of starting business 156.079 219.820 0.300 1540.2 445 Contract enforcement 39.305 5.224 23.000 54.000 445 Start-up procedure 9.856 3.005 3.000 18.000 445 Ware house time 195.760 98.496 48.000 599 367 Time to enforce a contract 683.024 277.839 230.000 1715 445 Time to register a property 82.592 74.197 9.000 389 412 Time to start a business 49.884 43.658 5.000 260 445 Time to export 33.789 14.344 10 78 375 Time to pay taxes 319.382 196.048 66 1120 375 Resolving an insolvency 3.094 1.129 1.7 6.2 372 Mobile phone penetration 23.379 28.004 0.000 147.202 572 Internet penetration 4.152 6.450 0.005 43.605 566 Trade Openness 78.177 36.138 20.964 209.87 597 Foreign Direct Investment inflows 5.332 8.737 -6.043 91.007 603 GDP growth 4.714 6.322 -47.552 63.379 608 Population growth 2.361 0.948 -1.081 6.576 588 Educational Quality 43.601 14.529 12.466 100.236 444 Foreign aid 11.687 14.193 -0.253 181.187 606
24 Appendix 3: Correlation matrix
Cost- ostart
Contra- ctenf
Startup- proced
Timeware- house
Timen- forcontr
Time- regprop
Time- startbus
Time- xport
Time- taxes
Time- resinsolv
Trade FDI GDPg Popg Educ Aid Mobile Internet
1.000 0.268 0.303 0.120 -0.110 0.169 -0.032 0.463 0.241 0.390 -0.048 -0.135 0.020 0.389 0.362 0.133 -0.541 -0.385 Costostart 1.000 0.180 0.025 0.080 -0.040 0.028 0.216 0.345 0.276 0.036 0.149 -0.022 0.144 0.094 0.049 -0.324 -0.093 Contractenf
1.000 -0.037 -0.065 -0.093 0.311 0.204 0.129 0.170 0.024 -0.128 0.109 0.100 0.154 -0.136 -0.275 -0.164 Startupproced 1.000 0.150 0.221 0.094 0.012 -0.022 0.087 0.119 -0.059 -0.113 -0.093 -0.003 0.125 0.086 -0.121 Timewarehouse
1.000 -0.213 0.344 -0.197 -0.060 0.048 0.172 0.184 -0.034 -0.212 -0.285 0.209 0.047 0.098 Timenforcontr 1.000 -0.129 -0.054 -0.009 -0.015 -0.067 -0.179 0.004 0.039 0.087 0.040 -0.193 -0.056 Timeregprop
1.000 -0.011 0.158 0.165 0.265 0.236 -0.049 -0.263 -0.149 -0.093 0.043 0.046 Timestartbus 1.000 0.212 0.386 -0.146 -0.063 0.181 0.327 0.589 0.031 -0.554 -0.476 Timexport
1.000 0.167 0.010 0.027 -0.090 0.103 0.187 -0.164 -0.141 -0.161 Timetaxes 1.000 -0.215 -0.026 -0.004 0.316 0.408 0.221 -0.435 -0.261 Timeresinsolv
1.000 0.338 0.093 -0.325 -0.348 -0.061 0.243 0.182 Trade 1.000 0.065 0.116 -0.135 0.342 0.063 0.067 FDI
1.000 0.252 0.213 0.260 -0.247 -0.049 GDPg 1.000 0.360 0.497 -0.458 -0.431 Popg
1.000 0.120 -0.571 -0.526 Educ 1.000 -0.259 -0.207 Aid
1.000 0.661 Mobile 1.000 Internet
Costostart: cost of business start-up procedure. Contractenf: Procedure to enforce a contract. Startupproced: Start-up procedures to register a business. Timewarehouse: Time required to build a warehouse.