Reactive Diffusion between Ag–5Pt Alloy and Sn at Solid-State Temperatures
Shunsuke Sasaki
*1and Masanori Kajihara
*2Department of Materials Science and Engineering, Tokyo Institute of Technology, Yokohama 226-8502, Japan
The kinetics of the reactive diffusion between a binary Ag–5 at% Pt alloy and Sn was experimentally studied at solid-state temperatures using sandwich Sn/Ag0:95Pt0:05/Sn diffusion couples. The diffusion couple was prepared by a diffusion bonding technique and then isothermally
annealed at temperatures ofT¼433, 453 and 473 K for various times up to 408 h in an oil bath with silicone oil. During annealing, an intermetallic layer of Ag3Sn dispersed with fine particles of PtSn4is formed at each interface in the diffusion couple. The mean thickness of the
intermetallic layer is expressed as a power function of the annealing time. The exponent of the power function takes values around 0.35 at
T¼433{473K. Thus, the growth of the intermetallic layer is controlled by grain boundary diffusion as well as volume diffusion. The growth rate of the intermetallic layer is greater for the Sn/Ag0:95Pt0:05/Sn diffusion couple than for the Sn/Ag/Sn diffusion couple atT¼433{473K.
However, the temperature dependence of the growth rate shows that the growth rate may be smaller for the Sn/Ag0:95Pt0:05/Sn diffusion couple
than for the Sn/Ag/Sn diffusion couple atT¼393K. Thus, addition of 5 at% Pt into Ag accelerates the kinetics of the reactive diffusion between Ag and Sn atT>400K but decelerates the kinetics atT<400K. [doi:10.2320/matertrans.MRA2007149]
(Received July 2, 2007; Accepted August 2, 2007; Published September 12, 2007)
Keywords: diffusion bonding, intermetallic compounds, bulk diffusion, solder, conductor
1. Introduction
Copper-base conductor alloys are widely used in electronic industry. In order to improve the corrosion resistance, however, the Cu-base alloy is usually plated with a Au layer. If the Cu-base alloy plated with the Au layer is interconnected with a Sn-base solder alloy, Au–Sn com-pounds are formed at the interconnection during soldering and then grow during usual energization heating on condition that the Au layer is sufficiently thick. The Au–Sn compounds are brittle and possess high electrical resistivities, and hence their growth deteriorates the electrical and mechanical properties of the interconnection. The reactive diffusion between the Sn-base solder and Cu-base conductor alloys was experimentally studied at various solid-state temper-atures by many investigators.1–15)In most of the experiments,
however, diffusion couples were prepared from the solder and conductor alloys by a soldering technique. In the soldering technique, compound layers with certain thick-nesses are formed at the interface between the solder and conductor alloys during soldering. The formation of the compound layers before annealing will affect their growth behavior during annealing at solid-state temperatures. There-fore, the soldering technique may not be appropriate to observation of the kinetics for the reactive diffusion at solid-state temperatures.
The solid-state reactive diffusion was experimentally observed for various binary and ternary systems in previous studies.16–35) For the binary Au/Sn system, Sn/Au/Sn
diffusion couples were prepared by a diffusion bonding technique and then isothermally annealed at various solid-state temperatures.16–19)Due to annealing, AuSn
4, AuSn2and
AuSn compound layers are produced at the Au/Sn interface in the diffusion couple at temperatures betweenT¼393and 473 K. The total thickness of the Au–Sn compound layers is mathematically expressed as a power function of the
annealing time, and the exponent of the power function is equal to 0.48, 0.42, 0.39 and 0.36 atT ¼393, 433, 453 and 473 K, respectively.17–19) Thus, the exponent monotonically
increases from 0.36 to 0.48 with decreasing annealing temperature from 473 K to 393 K.
A similar experiment was carried out for the reactive diffusion in the binary Ag/Sn system in a previous study.20) In that experiment, Sn/Ag/Sn diffusion couples were prepared by the diffusion bonding technique and then isothermally annealed at temperatures of T ¼433{473K. Owing to annealing, compound layers consisting of Ag3Sn
and the phase are formed at the Ag/Sn interface in the diffusion couple. Like the Au–Sn compound layers, the total thickness of the Ag–Sn compound layers is described as a power function of the annealing time. The exponent of the power function is equal to 0.40, 0.38 and 0.36 atT ¼433, 453 and 473 K, respectively. Thus, the temperature depend-ence of the exponent is almost equivalent for the binary Ag/ Sn and Au/Sn systems. However, the overall growth rate of the compound layers is one order of magnitude smaller for the binary Ag/Sn system than for the binary Au/Sn system.17–20)
As well as Ag and Au, binary Ag–Au alloys are used as corrosion-resistant conductor materials in electronic indus-try. In the binary Ag–Au system,36) the complete
solid-solution phase with the face-centered cubic (fcc) structure exists in a wide temperature range. If the Ag–Au conductor alloy is interconnected with the Sn-base solder alloy and then heated at solid-state temperatures under usual energization conditions, Ag–Sn and Au–Sn compounds are produced at the interconnection and then grow gradually. Such growth also deteriorates the electrical and mechanical properties of the interconnection. In order to examine the growth behavior of the Ag–Sn and Au–Sn compounds at the interconnection, the reactive diffusion in the ternary (Ag–Au)/Sn system was experimentally observed in previous studies.22,23) Here, the notation (A–B)/C means that reactive diffusion occurs between a binary A–B alloy and a pure C metal at appropriate annealing temperatures. In those experiments, Sn/Ag1zAuz/
*1Graduate Student, Tokyo Institute of Technology
than atz¼0:37{1but greater atz¼0:25than atz¼0. Thus, the growth rate seems to decrease monotonically with decreasing compositionz. However, the growth rate becomes slightly smaller at z¼0:13 than atz¼0. This means that addition of Au with 13 at% into Ag decelerates the growth of compounds at the interconnection between Ag and Sn during energization heating.
Since addition of Pt as well as that of Au improves the corrosion-resistance of Ag, Ag–Pt alloys can be used as corrosion-resistant conductor materials like Ag–Au alloys. Also at the interconnection between the Ag–Pt conductor and Sn-base solder alloys, however, certain compounds are produced during energization heating.37) Considering the effect of Au on the kinetics of the reactive diffusion between Ag and Sn, we may expect that addition of a small amount of Pt into Ag may also decelerate the growth of compounds at the interconnection. Unfortunately, however, no reliable information is available for the influence of Pt. Consequently, the reactive diffusion in the ternary (Ag–Pt)/Sn system was experimentally examined at solid-state temperatures in the present study. Unlike the binary Ag–Au system,36)however,
the solubility of Pt in Ag is restricted in the binary Ag–Pt system.38)Hence, only a binary Ag–Pt alloy containing 5 at%
of Pt was used to prepare Sn/(Ag–Pt)/Sn diffusion couples by the diffusion bonding technique. The diffusion couple was isothermally annealed at temperatures betweenT ¼433and 473 K, and then the growth behavior of compounds was observed metallographically. The rate-controlling process of the growth was discussed on the basis of the observation.
2. Experimental
A polycrystalline binary Ag–Pt alloy with a concentration of 5 at% Pt was prepared as a 25 g button ingot by argon arc melting from pure Ag and Pt with purity of 99.99%. Plate specimens with a size of 10mm5mm2mm were cut from the ingot and cold rolled to a thickness of 0.1 mm. Sheet specimens with a dimension of 20mm7mm0:1mm were cut from the plate specimen and then chemically polished in an etchant consisting of 12 vol% of nitric acid, 38 vol% of hydrochloric acid and 50 vol% of ethanol. The chemically polished sheet specimens were separately an-nealed in evacuated silica capsules at 1223 K for 1440 h, followed by water quenching without breaking the capsules. The annealed sheet specimens were again chemically
a diameter of 1mm.
After chemical polishing, a Ag–Pt sheet specimen was immediately sandwiched between the finished surfaces of two freshly prepared Sn plate specimens in ethanol by a technique used in previous studies.17–19)The Sn/(Ag–Pt)/Sn
couples were completely dried and then isothermally heated for diffusion bonding in an oil bath with silicone oil at temperatures of T¼433, 453 and 473 K for times of 20, 8 and 2 h, respectively. After heating, the diffusion couples were isothermally annealed at T ¼433, 453 and 473 K for various times up to 400 h. The summation of the heating and annealing times is hereafter merely called the annealing time
t. Cross-sections of the annealed diffusion couples were mechanically polished using diamond with diameters of 15, 3 and 1mmand then finished with an OP-S liquid by Struers Ltd. The microstructure of the cross-section was observed with an optical microscope (OM). The observation of the microstructure was carried out also with a back-scattered electron image (BEI) by scanning electron microscopy (SEM). Concentrations of Ag, Pt and Sn in each phase on the cross-section were measured by electron probe micro-analysis (EPMA).
3. Results and Discussion
3.1 Microstructure
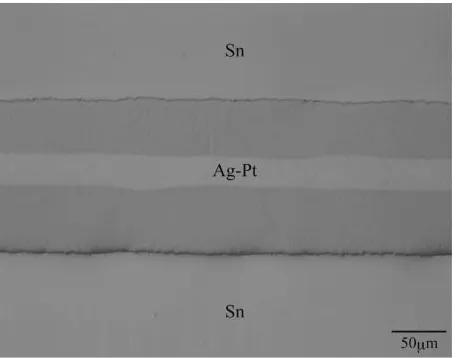
A typical micrograph of OM for the cross-section of the annealed diffusion couple is shown in Fig. 1. This figure indicates the micrograph for the diffusion couple with
T ¼473K andt¼8h (2:88104s). In Fig. 1, the regions on the upper and lower sides are Sn, and the horizontal band with a thickness of about 30mmis the Ag–Pt alloy. As can be seen in this figure, an intermetallic layer with a thickness of about 50mmis formed at each interface between Sn and the Ag–Pt alloy. In order to identify the intermetallic layer, concentration profiles of Ag, Pt and Sn were measured by EPMA along the direction normal to the interface. A result for the diffusion couple with T ¼473K and t¼17:5h (6:3104s) is shown in Fig. 2. In this figure, the ordinate
and the abscissa indicate the mol fractionyiof componenti
(i¼Ag, Pt, Sn) and the distance x, respectively, and open squares, rhombuses and circles show the mol fractions yAg,
solid-solution () phase of Ag with the fcc structure atT¼ 1223K. As can be seen in Fig. 2, the homogeneous single-phase microstructure of thephase was realized for the Ag– Pt alloy by annealing atT ¼1223K fort¼1440h (5:18 106s). On the other hand, for the intermetallic layer, the
plotted points are considerably scattered, and thus the identification cannot be carried out conclusively. The result in Fig. 2 is plotted as a diffusion path with open circles in a composition triangle of the ternary Ag–Pt–Sn system in Fig. 3. In this figure, open rhombuses show the initial compositions of Sn and the Ag–Pt alloy. As can be seen, the open circles for Sn and the Ag–Pt alloy coincide well with the open rhombuses. This guarantees that the EPMA measure-ment is sufficiently reliable. As measure-mentioned in Sect. 1, the solid-state reactive diffusion in the binary Ag/Sn system was experimentally observed using Sn/Ag/Sn diffusion couples in a previous study.20)According to the observation, layers of Ag3Sn and the phase are formed in the diffusion couple
during annealing at T ¼433{473K. In the binary Ag–Sn system,39) Ag
3Sn and the phase are the only stable
compounds, and Sn is in equilibrium with Ag3Sn at T ¼
433{473K. On the other hand, in the binary Pt–Sn system,40)
Sn is in equilibrium with PtSn4 at T¼433{473K. The
chemical compositions of Ag3Sn and PtSn4 are indicated as
open squares in Fig. 3. As can be seen, the open circles for the intermetallic layer are located well on a straight line interconnecting the open squares. Such a relationship was observed for the EPMA measurements withT ¼433{473K. Therefore, we may expect that the intermetallic layer is composed of Ag3Sn and PtSn4. Unfortunately, however, only
a very fine two-phase microstructure was realized in the intermetallic layer even at the longest annealing time of
t¼20h (7:2104s) at T¼473K. For such a two-phase
microstructure, the chemical composition of each phase cannot be measured reliably by EPMA. This is the reason why the plotted points for the intermetallic layer are considerably scattered in Fig. 2.
In order to identify the constituent phases of the inter-metallic layer, the diffusion couple was isothermally an-nealed at T ¼473K for a longer time of t¼670h (2:4 106s). At this annealing time, the Ag–Pt alloy is completely consumed to produce the intermetallic layer. A typical BEI micrograph for the cross-section of the diffusion couple with
T ¼473K andt¼670h (2:4106s) is shown in Fig. 4. In
this figure, the regions on the upper and lower sides are Sn and the intermetallic layer, respectively. In the intermetallic layer, fine bright particles with sizes around 2mm are dispersed in a dark matrix. According to the EPMA measurement, the fine bright particle and the dark matrix are PtSn4and Ag3Sn, respectively, and the solubility of Ag in
PtSn4 and that of Pt in Ag3Sn are negligible. Hence, the
chemical compositions of PtSn4 and Ag3Sn coincide well
with the open squares in Fig. 3. Consequently, it is concluded that the Ag3Sn layer dispersed with PtSn4particles is formed
at the interface in the Sn/Ag0:95Pt0:05/Sn diffusion couple
during annealing at T ¼433{473K. This yields that the
Fig. 1 Optical micrograph of cross-section for Sn/Ag0:95Pt0:05/Sn
diffu-sion couple annealed atT¼473K fort¼8h (2:88104s).
Fig. 2 Concentration profiles of Ag, Pt and Sn across intermetallic layer for Sn/Ag0:95Pt0:05/Sn diffusion couple annealed atT¼473K for t¼
17:5h (6:3104s).
[image:3.595.317.535.70.264.2] [image:3.595.56.284.72.251.2] [image:3.595.62.276.303.510.2]three-phase equilibrium of Sn + PtSn4 + Ag3Sn appears at
T ¼433{473K in the phase diagram of the ternary Ag–Pt–
Sn system.
3.2 Growth behavior of intermetallic layer
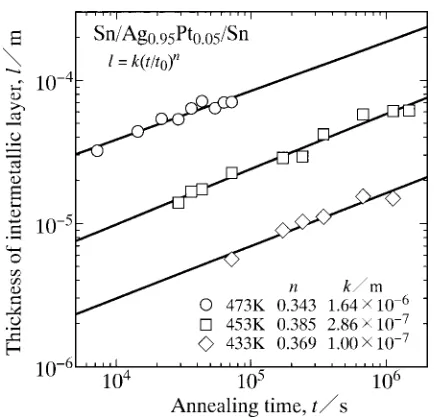
From the OM micrographs like Fig. 1, the mean thicknessl
of the intermetallic layer was evaluated by the following equation at each annealing time:
l¼A=w; ð1Þ
wherewandAare the total length parallel to the interface and the total area of the intermetallic layer, respectively, on the cross-section. The result is shown in Fig. 5. In this figure, the ordinate indicates the logarithm of the thickness l, and the abscissa shows the logarithm of the annealing timet. Open rhombuses, squares and circles indicate the results at T¼ 433, 453 and 473 K, respectively. As can be seen, the thicknessl monotonically increases with increasing
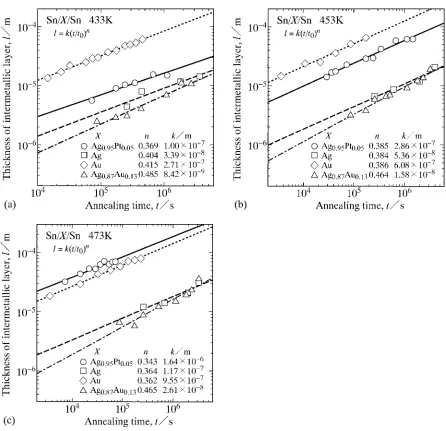
anneal-shown again as open circles with solid lines in Fig. 6(a), (b) and (c), respectively. As mentioned in Sect. 1, the kinetics of solid-state reactive diffusion was experimentally observed for the ternary (Ag–Au)/Sn system22,23)as well as the binary
Au/Sn17–19) and Ag/Sn20) systems in previous studies. In
[image:4.595.55.282.72.243.2]those experiments, Sn/Ag1zAuz/Sn diffusion couples with z¼0{1 were prepared by the diffusion bonding technique and then isothermally annealed at solid-state temperatures. Here, z is the mol fraction of Au in the Ag–Au alloy. In Fig. 6, the results of the Sn/Ag/Sn, Sn/Ag0:87Au0:13/Sn and
Sn/Au/Sn diffusion couples are indicated as open squares with dashed lines, open triangles with dashed-and-dotted lines and open rhombuses with dotted lines, respectively. Hereafter, the Sn/Ag/Sn, Sn/Au/Sn, Sn/Ag0:87Au0:13/Sn
and Sn/Ag0:95Pt0:05/Sn diffusion couples are called diffusion
couples AG, AU, GU and AP, respectively. As can be seen in Fig. 6, the growth rate of the intermetallic layer is one order of magnitude greater for diffusion couple AU than for diffusion couple AG but slightly smaller for diffusion couple GU than for diffusion couple AG. Therefore, the minimum growth rate is realized atz¼0:13.23)Here, the intermetallic
layer is composed of AuSn4, AuSn2 and AuSn for diffusion
couple AU, but mainly of Ag3Sn for diffusion couples AG
and GU. Consequently, addition of Au with 13 at% into Ag decelerates the kinetics of the reactive diffusion between Ag and Sn atT¼433{473K. On the other hand, atT¼433and 453 K, the growth rate of the intermetallic layer is greater for diffusion couple AP than for diffusion couple AG but smaller for diffusion couple AP than for diffusion couple AU. At
T ¼473K, however, the growth rate becomes greater for diffusion couple AP than even for diffusion couple AU. Hence, addition of Pt with 5 at% into Ag accelerates the kinetics of the reactive diffusion between Ag and Sn at
T ¼433{473K. The acceleration effect of Pt becomes more
remarkable with increasing annealing temperature.
3.3 Rate-controlling process
The exponentnof diffusion couple AP is plotted as open circles against the annealing temperatureT in Fig. 7. In this figure, the results of diffusion couples AG,20) GU23) and AU17–19)are also represented as open squares, triangles and rhombuses, respectively. If the reactive diffusion is con-trolled by the volume diffusion of the constituent components in each phase, the exponentnis equal to 0.5. In contrast, the grain boundary diffusion across the intermetallic layer will
Fig. 4 Back-scattered electron image of cross-section for Sn/Ag0:95Pt0:05/
Sn diffusion couple annealed atT¼473K fort¼670h (2:41106s).
Fig. 5 The thicknesslof the intermetallic layer versus the annealing timet
atT¼433, 453 and 473 K shown as open rhombuses, squares and circles, respectively, for Sn/Ag0:95Pt0:05/Sn diffusion couple. Straight lines
[image:4.595.61.278.293.502.2]govern the reactive diffusion at low temperatures where the volume diffusion is practically frozen out. When the reactive diffusion is purely controlled by the grain boundary diffusion and grain growth occurs in the intermetallic layer according to the parabolic law, the exponent takes a value of n¼ 0:25.41)Here, the parabolic law means that the grain size in
the intermetallic layer is proportional to the square root of the annealing time. According to the result of diffusion couple AU, n is equal to 0.36 at T ¼473K and monotonically increases with decreasing annealing temperature. At T¼ 393K,nbecomes close to 0.5. Even if the reactive diffusion is purely controlled by the grain boundary diffusion, n is equal to 0.5 unless the grain growth occurs.18) Thus, for diffusion couple AU, the grain boundary diffusion contrib-utes to the rate-controlling process, and the grain growth takes place at a certain rate atT ¼473K. However, at T¼ 393K, the grain growth will slow down, though the contribution of the grain boundary diffusion becomes more
remarkable.18) As can be seen in Fig. 7, the open squares coincide well with the open rhombuses. This deduces that the same temperature dependence of the rate-controlling process as diffusion couple AU works also for diffusion couple AG. On the other hand, for the open triangles,nis close to 0.5 at
T ¼433{473K. This indicates that the volume diffusion is
mostly the rate-controlling process for diffusion couple GU.23) Although the intermetallic layer mainly consists of
Ag3Sn for both diffusion couples AG and GU, the grain
boundary diffusion considerably contributes to the rate-controlling process for diffusion couple AG but hardly for diffusion couple GU. This is the reason why the growth rate of the intermetallic layer is smaller for diffusion couple GU than for diffusion couple AG. In contrast, for diffusion couple AP, the exponent takes values aroundn¼0:35atT ¼433{ 473K. Furthermore, there is no systematic temperature dependence of the exponent. This means that the grain boundary diffusion appreciably contributes to the
rate-Fig. 6 The thicknesslof the intermetallic layer versus the annealing timet. The result of Sn/Ag0:95Pt0:05/Sn diffusion couple in Fig. 5 is
shown again as open circles with solid lines at temperatures of (a) 433 K, (b) 453 K and (c) 473 K. The corresponding results of Sn/Au/ Sn,17–19)Sn/Ag/Sn20)and Sn/Ag
0:87Au0:13/Sn23)diffusion couples are indicated as open rhombuses, squares and triangles, respectively.
[image:5.595.75.521.67.498.2]controlling process. Actually, the very fine two-phase micro-structure is realized in the intermetallic layer for diffusion couple AP at T ¼433{473K. In such a two-phase micro-structure, the effective cross-section for the grain boundary diffusion is fairly large. As a result, the growth rate of the intermetallic layer becomes greater for diffusion couple AP than for diffusion couple AG.
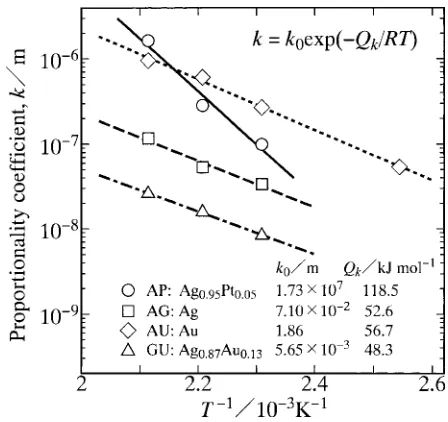
The logarithm of the proportionality coefficient k for diffusion couple AP is plotted as open circles against the reciprocal of the annealing temperatureTin Fig. 8. As can be seen, the open circles are located rather well on a straight line. Thus,kis expressed as a function ofTby the following equation:18)
k¼k0expðQk=RTÞ: ð3Þ
Here, k0 is the pre-exponential factor, Qk is the activation
enthalpy, andRis the gas constant. From the open circles in Fig. 8,k0andQkwere evaluated by the least-squares method.
The evaluated values are shown in Fig. 8. Using these values, the temperature dependence ofkwas calculated from eq. (3). The result is shown as a solid line in Fig. 8. In this figure, the corresponding results of diffusion couples AU,17–19) AG20)
and GU23) are indicated as open rhombuses, squares and
triangles, respectively. According to the results in Fig. 7, the almost same temperature dependence of n is actualized between diffusion couples AU and AG. As shown in Fig. 6, however, l is one order of magnitude greater for diffusion couple AU than for diffusion couple AG at each annealing time. Thus, from eq. (2), k is also one order of magnitude greater for diffusion couple AU than for diffusion couple AG. In contrast,lis slightly smaller for diffusion couple GU than for diffusion couple AG, butnis greater for diffusion couple GU than for diffusion couple AG. Consequently,kbecomes smaller for diffusion couple GU than for diffusion couple AG. For diffusion couples AG and AU, the rate-controlling process varies depending on the annealing temperature as
mentioned earlier, and thus complex information for the temperature dependence of the kinetics is included in the value ofQk. In such a case, it is not valid to estimate the rate-controlling process only from the value ofQk. On the other hand, for diffusion couple GU, n is close to 0.5 at T ¼
433{473K as indicated in Fig. 7. Hence, atT ¼433{ 473K,
the volume diffusion is mainly the rate-controlling process. Nevertheless, Qk¼48kJ/mol of diffusion couple GU is
rather close toQk¼53and 57 kJ/mol of diffusion couples
AG and AU, respectively. The growth rate of the interme-tallic layer is predominantly determined by the interdiffusion across the intermetallic layer.42,43)The temperature
depend-ence of the interdiffusion coefficientDfor the intermetallic layer is described by the following equation of the same formula as eq. (3) with certain accuracy.44)
D¼D0expðQ=RTÞ ð4Þ
Here,D0is the pre-exponential factor, andQis the activation
enthalpy. Since the volume diffusion is the rate-controlling process for diffusion couple GU, we may expect that Q is close to Qk¼48kJ/mol. However, there exists a rather
complicated relationship between QandQk.44–48)Thus, the
value ofQcannot be readily estimated from that of Qk in a
straightforward manner, even if the volume diffusion is the rate-controlling process.
As mentioned earlier, the two-phase microstructure con-sisting of the Ag3Sn matrix dispersed with the very fine PtSn4
particle is realized in the intermetallic layer for diffusion couple AP at T ¼433{473K. In such a case, the grain boundary diffusion remarkably contributes to the rate-controlling process. The growth rate of the intermetallic layer is predominantly determined by the interdiffusion across the intermetallic layer,42,43) and the interdiffusion is dominated by the intrinsic diffusion of the most minor component.49) In the case of the grain boundary diffusion Fig. 7 The exponentnversus the annealing temperatureTshown as open
circles for Sn/Ag0:95Pt0:05/Sn diffusion couple. The corresponding results
of Sn/Au/Sn,17–19) Sn/Ag/Sn20) and Sn/Ag
0:87Au0:13/Sn23) diffusion
couples are indicated as open rhombuses, squares and triangles,
Fig. 8 The proportionality coefficient k versus the reciprocal of the annealing temperatureTfor Sn/Ag0:95Pt0:05/Sn diffusion couple shown as
open circles. The corresponding results of Sn/Au/Sn,17–19)Sn/Ag/Sn20) and Sn/Ag0:87Au0:13/Sn23) diffusion couples are indicated as open
[image:6.595.62.279.67.282.2] [image:6.595.314.538.70.281.2]across the Ag3Sn matrix in the intermetallic layer for
diffusion couple AP, Pt is the most minor component. Unfortunately, however, no reliable information of the intrinsic diffusion of Pt is available for the grain boundary diffusion in Ag3Sn. The melting temperature Tm of pure
component is 505, 1235, 1337 and 2042 K for Sn, Ag, Au and Pt, respectively.36,38–40)Thus,Tm is much higher for Pt than
for Sn, Ag and Au. For a component with a high melting temperature, the intrinsic diffusion coefficient may be small, but the activation enthalpy will be large. The mean composition of the intermetallic layer for diffusion couple AP is obtained to be yAg¼0:626, yPt¼0:033 and ySn¼ 0:341 from the intersection of the dashed and dashed-and-dotted lines in Fig. 3. Assuming equivalent molar volumes of Ag3Sn and PtSn4, the volume fraction f of PtSn4 in the
Ag3Sn + PtSn4two-phase microstructure is estimated by the
equation
f ¼ySny 3
Sn y4
Sny
3
Sn
; ð5Þ
wherey3
Snandy4Snare the mol fractions of Sn for Ag3Sn and
PtSn4, respectively. Inserting ySn¼0:341, y3Sn¼0:25 and y4
Sn¼0:8 into eq. (5), we obtain f ¼0:165. The value f ¼ 0:165indicates that a rather large amount of PtSn4is included
in the intermetallic layer for diffusion couple AP. Conse-quently, the interdiffusion in PtSn4 as well as the grain
boundary diffusion in Ag3Sn contributes to the overall
interdiffusion across the intermetallic layer. In a previous study,37) Sn/Pt/Sn diffusion couples were isothermally annealed at T¼473K for various times. The Sn/Pt/Sn diffusion couple is hereafter called diffusion couple PT. During annealing, an intermetallic layer of PtSn4is formed at
each interface in diffusion couple PT. The growth rate of the intermetallic layer is slightly smaller for diffusion couple PT than for diffusion couple AG. This implies that the interdiffusion coefficient D is smaller for PtSn4 than for
Ag3Sn and thus the activation enthalpyQis greater for PtSn4
than for Ag3Sn. Since the activation enthalpy is large for the
interdiffusion in PtSn4 and the grain boundary diffusion in
Ag3Sn, the value of Qfor the overall interdiffusion may be
also large. Although there is a rather complicated relationship betweenQandQk,44–48)the large value ofQwill result in that ofQk. This may be the reason whyQkis greater for diffusion couple AP than for diffusion couples AU, AG and GU in Fig. 8.
On the basis of the temperature dependence ofkin Fig. 8, the value ofkatT¼393K was calculated from eq. (3). The calculation provides k¼3:08109, 7:22109 and 2:18109m for diffusion couples AP, AG and GU,
respectively. On the other hand, the mean value of n¼ 0:366 is obtained from the experimental values at T¼
433{473K for diffusion couple AP. Since no systematic
temperature dependence ofnis observed,nis assumed to be 0.366 atT¼393K for diffusion couple AP. As to diffusion couples AG and GU, however, n is almost equal to 0.5 at
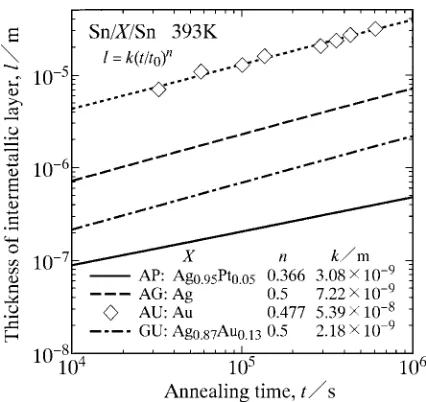
T ¼393K. Using such values ofkandn,lwas calculated as a function of t at T¼393K from eq. (2). The results of diffusion couples AP, AG and GU are shown as solid, dashed and dashed-and-dotted lines, respectively, in Fig. 9. In this figure, the ordinate and the abscissa indicate the logarithms of
landt, respectively. In contrast, the dependence oflontwas experimentally observed atT ¼393K for diffusion couple AU.18) The experimental result of diffusion couple AU is shown as open rhombuses with a dotted line in Fig. 9. The dotted line givesk¼5:39108m andn¼0:477. As can be seen in Fig. 9, the growth rate of the intermetallic layer is greater for diffusion couple AU than for diffusion couple AG but smaller for diffusion couple GU than for diffusion couple AG. Unlike Fig. 6, however, the growth rate becomes much smaller for diffusion couple AP than for diffusion couples AU, AG and GU. Consequently, it is concluded that the addition of Pt with 5 at% into Ag accelerates the kinetics of the reactive diffusion between Ag and Sn atT¼433{473K but may decelerate the kinetics at T ¼393K. This means that the binary Ag–5Pt alloy is a superior conductor material resistant to the deterioration of the mechanical and electrical properties at the interconnection with the Sn-base solder alloy during energization heating unless the heating temper-ature is higher than 400 K.
4. Conclusions
The solid-state reactive diffusion in the ternary (Ag–Pt)/ Sn system was experimentally examined using the Sn/ Ag0:95Pt0:05/Sn diffusion couple prepared by the diffusion
bonding technique. The diffusion couple was isothermally annealed in the temperature range between T¼433 and 473 K for various times in the oil bath with silicone oil. Owing to annealing, the intermetallic layer consisting of the Ag3Sn matrix dispersed with fine PtSn4particles is produced
at the (Ag–Pt)/Sn interface in the diffusion couple. The mean thickness of the intermetallic layer is expressed as a power function of the annealing time. The exponent of the power function takes values around 0.35 atT ¼433{473K. Con-sequently, the grain boundary diffusion across the interme-tallic layer considerably contributes to the rate-controlling
Fig. 9 The thicknesslof the intermetallic layer versus the annealing timet
estimated atT¼393K. The results of Sn/Ag0:95Pt0:05/Sn, Sn/Ag/Sn and
Sn/Ag0:87Au0:13/Sn diffusion couples are shown as solid, dashed and
[image:7.595.320.533.69.270.2]Acknowledgement
The present study was supported by the Iketani Science and Technology Foundation in Japan.
REFERENCES
1) L. Zakraysek: Welding Research Supplement Nov. (1972) 536–541. 2) K. N. Tu: Acta Metall.21(1973) 347–354.
3) H. N. Keller: IEEE Trans. Components, Hybrids, Manuf. Tech. CHMT-2 (1979) 180–195.
4) H. N. Keller and J. M. Morabito: Surface and Interface Analysis3 (1981) 16–22.
5) J. O. G. Parent, D. D. L. Chung and I. M. Bernstein: J. Mater. Sci.23 (1988) 2564–2572.
6) A. J. Sunwoo, J. W. Morris, Jr. and G. K. Lucey, Jr.: Metall. Trans. A 23A(1992) 1323–1332.
7) P. T. Vianco, P. F. Hlava and A. L. Kilgo: J. Elect. Mater.23(1994) 583–594.
8) D. R. Frear and P. T. Vianco: Metall. Trans. A25A(1994) 1509–1523. 9) S. Choi, T. R. Bieler, J. P. Lucas and K. N. Subramanian: J. Elect.
Mater.28(1999) 1209–1215.
10) P. G. Kim and K. N. Tu: J. Appl. Phys.80(1996) 3822–3827. 11) A. M. Minor and J. W. Morris, Jr.: Metall. Mater. Trans. A31A(2000)
798–800.
12) J. H. Lee, J. H. Park, Y. H. Lee and Y. S. Kim: J. Mater. Res.16(2001) 1249–1251.
13) H. G. Song, J. P. Ahn, A. M. Minor and J. W. Morris, Jr.: J. Electron. Mater.30(2001) 409–414.
14) M. O. Alam and Y. C. Chan: Chem. Mater.15(2003) 4340–4342. 15) M. O. Alam and Y. C. Chan: J. Mater. Res.19(2004) 1303–1306. 16) M. Kajihara, T. Yamada, K. Miura, N. Kurokawa and K. Sakamoto:
Netsushori43(2003) 297–298.
17) T. Yamada, K. Miura, M. Kajihara, N. Kurokawa and K. Sakamoto:
Sakamoto: Mater. Sci. Eng. B126(2006) 37–43.
27) Y. Yato and M. Kajihara: Mater. Sci. Eng. A428(2006) 276–283. 28) Y. Yato and M. Kajihara: Mater. Trans.47(2006) 2277–2284. 29) T. Takenaka and M. Kajihara: Mater. Trans.47(2006) 822–828. 30) A. Furuto and M. Kajihara: Mater. Sci. Eng. A445–446(2007) 604–
610.
31) D. Naoi and M. Kajihara: Mater. Sci. Eng. A459(2007) 375–382. 32) Y. Muranishi and M. Kajihara: Mater. Sci. Eng. A404(2005) 33–41. 33) T. Hayase and M. Kajihara: Mater. Sci. Eng. A433(2006) 83–89. 34) K. Mikami and M. Kajihara: J. Mater. Sci. doi 10.
1007/s10853-007-1700-0, in press
35) T. Sakama: Bachelor Eng. Thesis, Tokyo Institute of Technology, 2006.
36) T. B. Massalski, H. Okamoto, P. R. Subramanian and L. Kacprzak:
Binary Alloy Phase Diagrams(ASM International, Materials Park, OH, 1990) vol. 1, p. 12.
37) S. Sasaki: Master Eng. Thesis, Tokyo Institute of Technology, 2007. 38) T. B. Massalski, H. Okamoto, P. R. Subramanian and L. Kacprzak:
Binary Alloy Phase Diagrams(ASM International, Materials Park, OH, 1990) vol. 1, p. 78.
39) T. B. Massalski, H. Okamoto, P. R. Subramanian and L. Kacprzak:
Binary Alloy Phase Diagrams(ASM International, Materials Park, OH, 1990) vol. 1, p. 96.
40) T. B. Massalski, H. Okamoto, P. R. Subramanian and L. Kacprzak:
Binary Alloy Phase Diagrams(ASM International, Materials Park, OH, 1990) vol. 3, p. 3132.
41) Y. L. Corcoran, A. H. King, N. de Lanerolle and B. Kim: J. Electron. Mater.19(1990) 1177–1183.
42) M. Kajihara: Acta Mater.52(2004) 1193–1200.
43) M. Kajihara and T. Yamashina: J. Mater. Sci.42(2007) 2432–2442. 44) M. Kajihara: Mater. Sci. Eng. A403(2005) 234–240.
45) M. Kajihara: Mater. Trans.46(2005) 2142–2149.
46) M. Kajihara: Defect and Diffusion Forum249(2006) 91–95. 47) M. Kajihara: Mater. Trans.47(2006) 1480–1484.
48) Y. Tanaka and M. Kajihara: Mater. Trans.47(2006) 2480–2488. 49) L. S. Darken and R. W. Gurry:Physical Chemistry of Metals