Munich Personal RePEc Archive
A Replicator Dynamic and Simulation
Analysis of Network Externalities and
Compatibility Among Standards
Heinrich, Torsten
Institute for Institutional and Innovation Economics, University of
Bremen, Bremen, Germany
12 October 2015
Online at
https://mpra.ub.uni-muenchen.de/67198/
A Replicator Dynamic and Simulation Analysis of Network
Externalities and Compatibility Among Standards
Torsten Heinrich
∗October 12, 2015
DRAFT
-Contents
1 Introduction 2
2 Literature Review 2
3 A Model of Network Externalities and Tied Standards 3
3.1 Replicator Dynamic Model with Implicit Network Structure . . . 3
3.2 Agent-Based Simulation Model with Explicit Network Structure . . . 5
4 Simulation Analysis 6 4.1 Experimental Design . . . 6
4.2 Monte Carlo Simulation of the Replicator Dynamic Model . . . 8
4.2.1 One-Segment Setting . . . 8
4.2.2 Effect of Initial Usage Share (Effects 1, 2) . . . 9
4.2.3 Effect of Inter-Segmental Compatibility with Tied Partner Standard (Effect 3) . . . . 9
4.2.4 Effect of Inter-Segmental Compatibility with Other Standard(s) (Effect 4) . . . 9
4.2.5 Interaction of Inter-Segmental Compatibilities with Tied Partner and Other Standards (Effect 5) . . . 9
4.2.6 Compatibility Reduction (Effect 6) . . . 9
4.2.7 Expansion into the Other Segment (Effects 7, 8, 9) . . . 10
4.3 Agent-Based Simulation . . . 10
5 Evidence from the ICT Sector 14
6 Conclusions 18
A Derivation of the Marginal Effects of the Compatibility Terms in the 2-Segment
Repli-cator Model 20
B Equilibrium and Stability Analysis of the Symmetric 2-Segment Replicator Model 21
Abstract
In the presence of network externalities, compatibility and tying or bundling of standards may be employed as strategic tools. This has reportedly been done by, e.g., many competitors in ICT industries. It remains, however, less clear which mechanisms exactly are exploited and in what way. The present paper investigates the economic role of compatibility or incompatibility of tied standards for the dynamics of competition between standards. A replicator model operating on an aggregated level is complemented by an agent-based simulation that takes into account the network structure among users and by an
∗Institute for Institutional and Innovation Economics (IINO), University of Bremen, Bremen, Germany,
empirical example from the information technology sector. A variety of effects and strategic options of vendors of the standards are studied, including the role of initial usage share distribution, controlling the inter-subsectoral compatibility, setting up new competitors, and utilizing properties of the network such as central or peripheral positioning of agents (Feld’s friendship paradox). The agent-based model contrasts a complete network and a regular ring network with asymmetric network structures derived from Barab`asi and Albert’s preferential attachment mechanism and triadic closure. Though this explores only a small subset of the theoretically possible effects, it may contribute to a better understanding of strategic interaction in the presence of network externalities.
Keywords: network externalities platform competition standard tying information and communication technology agent-based modeling replicator dynamics preferential attach-ment networks
1
Introduction
The digital economy has drawn the attention of economists not only for its growth potential but also for its many features that are distinct from other, older sectors. The importance of communication and exchange results in heavy network externalities goods gaining value with the number of users and increasing returns to scale, which are amplified by the digital nature of the goods (close to zero marginal costs of production) and the dense interconnections between standards relying on each other.
Besides network externalities, increasing returns, purely digital goods, standard wars, and other phenomena, modern information economics has shed light on tied standards. This refers to competing standards that correspond and align to other competing standards in other segments of the sector. To cite a classical example, such a tie exists between operating systems, web browsers, and office software. Network externalities will then develop not only within but also across segments. This has a strong implications for the dynamics of the competition but also for the strategic options of the commercial vendors or public institutions controlling the respective standards. However, features of real-world networks such as asymmetric, scale-free degree distributions, high clustering and small diameter (small-world property) also affect the dynamic which puts the problem beyond the reach of simple macro-level models.
The present contribution offers a replicator dynamic model of standard competition with cross-segment ties which is then extended into an agent-based simulation model that explicitly takes into account the network structure among the users. A standard replicator equation is used in which the compatibility with and the usage shares of standards in one or several other segments take the role of the evolutionary fitness. The replicator model yields a first-order dynamic system that allows to investigate the impact of initial conditions and of compatibility terms. These would be what governs the strategic actions of major competitors in sectors with densely interconnected standards such as the information and communication technology.
However, direct interaction between agents on the micro-level sometimes leads to the emergence of non-trivial macro-level dynamics. Therefore, it is necessary to show that benchmark models operating at an aggregated macro-level will still work if a micro-layer of massive numbers of interacting agents is included. For this, an agent-based version of the model is added. The deterministic dynamics resulting from the (aggregated level) replicator model are replaced by transition probabilities between user groups of standards. For the trivial network structure of a complete graph, this results in a stochastic dynamic system which is equivalent to the macro-level model in its behavior while for other network structures, the probabilities change locally, i.e. between agents, depending on their neighborhood.
Obvious strategies to gain an advantage for a competing standard in such a setting include increasing the compatibility to major competitors in other segments for small competitors, introducing spin-off standards in other segments for larger competitors, and keeping compatibility to other competitors in some segments low in order to drive these out of business. These strategies are studied in the replicator dynamic model before the effects of the network structure are considered using the agent-based simulation. Strategic options based on the network structure, e.g. using Feld’s friendship paradox, are also briefly discussed.
2
Literature Review
While there were some earlier considerations of increasing returns in economic theory (see, e.g. [Sraffa, 1926, Young, 1928]), the specific role of increasing returns to the number of consumers, and thus the phenomenon of network externalities, was only analyzed to some depth starting in the 1980s.1
There are two major schools to approach the modeling of network externalities: One relies on game theory and the analysis of equilibria for rational agents in a game theoretic setting. This approach was pioneered by Katz and Shapiro [Katz and Shapiro, 1985, Katz and Shapiro, 1986] and received much attention and drew a large number of contributions in the subsequent years; Farrell and Klemperer [Farrell and Klemperer, 2007] provide an overview. The other line of research emphasized path dependence, self-reinforcing feedbacks, and dynamics. Nelson’s [Nelson, 1968] replicator dynamic model of technological change may, without directly focusing on network externalities, have been the first predecessor of this class of models. The tradition of literature fully developed in the 1980s with David’s [David, 1985, David, 1992] historical analyses and Arthur et al.’s [Arthur et al., 1982, Arthur et al., 1987, Arthur, 1988, Arthur, 1989] urn scheme (Eggenberger-P´olya process) models. The consensus between the two tradi-tions holds that network effects tend to lead to a lock-in with only one alternative as the uncontested standard which may bring certain disadvantages in the form of technological alternatives that are not viable any more because the user base concentrates on another, potentially inferior technology.2
As the body of literature and evidence grew, scholars turned to further details including tying of standards across sectors, or rather across subsectors/segments within a larger sector. As an example, this may be thought of as an operating system, an office software package, a web browser, a database system and numerous other categories of software and hardware products that require a certain compatibility with one another in order to work properly. (For more concrete examples, see section 5.) Many of the larger vendors are active in several or almost all of these subsectors. It is obvious that network externalities across sectors may also unfold indirectly3
across sectors and that it opens a large variety of strategic options to any commercial vendor. The idea of tied standards was initially proposed by Choi [Choi, 2004] and analyzed in a game theory framework. Later, an evolutionary replicator model was put forward [Heinrich, 2014]; this model will be used and extended for the analysis in the present article.
With recent advances of network theory [Watts and Strogatz, 1998, Barab´asi and Albert, 1999, V´azquez, 2003] and their application to the field of technology diffusion and network externality models, it became clear that the result of swift and complete lock-in and monopolization relied crucially on the implicitly assumed network structure of a complete network. The properties of different other network structures in this respect including lattice networks, Watts-Strogatz random graphs (i.e., small world networks), and scale free networks (both Barab`asi-Albert preferential attachment networks and and Vazquez’ connect nearest neighbor (CNN) networks) were investigated subsequently [Delre et al., 2007, Lee et al., 2006, Uchida and Shirayama, 2008, Pegoretti et al., 2009]. It was found that networks with large diameter effectively inhibited complete lock-in [Uchida and Shirayama, 2008]. Small world networks on the other hand4
resemble the findings of the complete network [Delre et al., 2007, Lee et al., 2006, Pegoretti et al., 2009]. Some of the findings by Uchida and Shirayama [Uchida and Shirayama, 2008] also hint that clustering (CNN instead of BA scale free networks) may reduce the probability of a lock-in as well.
However, comprehensive studies of mechanisms and market-strategic and economic consequences of complex (tied multi-sector or multi-segment) network externality systems have yet to be conducted. One difficulty of this is the dimension of the resulting problems with many free variables the effect of which would need to be systematically analyzed. This and the need to take the network structure into account suggests simulation as the best option for this analysis which will form the centerpiece of the present article. This allows not only to investigate the effect of neighborhood structures but also the possible role and plausibility of strategic use of tying and network externalities.
1Though Demsetz [Demsetz, 1968] quotes an 1859 paper by Chatwick who may have been the first who realized the strategic
consequences for commercial vendors of standards in sectors with network externalities when he distinguished between ”compe-tition in a market” and ”compe”compe-tition for a market”.
2
Aside from these asymptotically stable equilibria, the complete monopolization of the sector for just one alternative, there is also an unstable tipping-point equilibrium between the basins of attraction of the stable equilibria.
3Note that this is not the same as Katz and Shapiros’s [Katz and Shapiro, 1985] indirect network effect, which is a network
effect that unfolds not directly via the number of users but by means of another mechanism, perhaps reduced costs.
4
3
A Model of Network Externalities and Tied Standards
3.1
Replicator Dynamic Model with Implicit Network Structure
The present study will be based on a replicator model that largely follows the model proposed in Heinrich [Heinrich, 2014]. The numerical study below requires assuming specific parameter sets. Different values for several of the more inter-esting parameters (with otherwise plausible parameter settings) will be considered in order to study the sensitivity of the system with respect to those parameters.
The starting point of the model is a replicator equation5
pi,j,t+1=pi,j,t(1 +fi,j,t−φj,t)
wherepi,j,tare the usage shares of standardiin segment6jat timet,fi,j,tis the corresponding individual evolutionary
fitness term of this standard, andφj,tis the average evolutionary fitness in segmentjat timet.
φj,t=fjT′,tpj′,t
The fitness term must include measures of the size of the standard’s network or usage share and, if tying between standards across segments is to be taken into account, also such measures for compatible standards in other segments.
Consider the vector of the fitnesses of standards in segmentj′ at timet,f
j′,t
fj′,t=wj′,j′Aj′pj′,t+
X
j6=j′
wj′,jCj′,jpj,t.
where pj,t is the vector of the corresponding population shares, wj′,j are parameters indicating the weight of the
compatibility with standards in segment j on the fitness terms in segment j′, and A and C are matrices of the compatibilities of standards in two segments (Cj′,j between segments j and j′) or between standards in the same
segment (A). Let the elements of those matrices be denotedai′i andci′irespectively and hold values between 0 and
1 which indicate to what degree standardiis compatible to standardi′ from the point of view of a user of standard
i′. Note that for most technologies, this compatibility structure would be assumed to be symmetric7
but there may be exceptions.8
Consider for illustrative purposes a system with one segment and two standards. The above function would become
f1,1,t
f2,1,t
=w1,1
a11,1,t a12,1,t
a21,1,t a22,1,t
p1,1,t
p2,1,t
.
and would not have to contain any cross-segmental compatibility matricesC. In case of a two-segment system with two standards in each segment, the fitness function would read
f1,1,t
f2,1,t
=w1,1
a11,1,t a12,1,t
a21,1,t a22,1,t
p1,1,t
p2,1,t
+w1,2
c11,1,2,t c12,1,2,t
c21,1,2,t c22,1,2,t
p1,2,t
p2,2,t
. (1)
Note that this is still a very general model except for two aspects: First, the fitness terms resulting from compatibilities across different segments are additive in this model. They could also9
be connected multiplicatively, but this would lead to a very strong effect of single segments in a very large model,10
while an additive model allows the effects to be tuned with the parametersw. Second, no standalone-fitness term (one without relation to network externalities)
5This is a discretization of the canonical form dpi,j
dt =pi,j,t(fi,j,t−φj,t)
6
This refers to a subsector or one of several types of goods within the same sector such that interacting network externalities can be expected (as in the above example of operating systems, office software, web browsers etc.). Of course, in reality the sector association of these segments would not be unique or homogeneous, but different segments and even different standards within segments would align only to varying degrees. This is reflected in the compatibility matricesAand C in the present model, which allow the level of interaction of network externalities to be fine-tuned or investigated.
7In formal terms,Awould be a symmetric matrix andC
j,j′ would be the transpose ofCj′,j,Cj,j′=CjT′,j. Since a standard
should be perfectly compatible with itself, all main diagonal elements ofAshould further equal 1.
8For instance, a software may offer to read, open, and transform but not to write file types of a competing software. 9
It is unlikely that all network effects follow the same functional form, therefore an approach was chosen that seemed relatively universal and flexible yet integrates easily with the evolutionary model and the simulation below. For a comprehensive account of proposed functional forms of network externalities, see Swann [Swann, 2002].
10Incompatibility with all standards in one segment would lead to the fitness term being multiplied by zero for this segment
is included. This would only add additional variables without contributing substantially to the purpose of the model, to investigate and illustrate the effect of compatibility on the development of usage shares and market power.
For this model, the direct effects of different variables can now be studied; particularly of interest is whether the compatibility terms have a positive or a negative effect. This is derived in appendix A. For the terms of matrixA, this yields ∂p1,1,t+1
∂a11,1 ≥0,
∂p1,1,t+1 ∂a12,1 ≥0,
∂p1,1,t+1 ∂a21,1 ≤0,
∂p1,1,t+1
∂a22,1 ≤0, and, specifically ifA is to be symmetric, hence
α=a12,1 =a21,1, further that
∂p1,1,t+1
∂α >0 if, and only if 0< p1,1, t <0.5. For the direct influence of the terms of
the inter-segmental compatibility martixC, it is obtained that∂p1,1,t+1 ∂c11,1,2 ≥0,
∂p1,1,t+1 ∂c12,1,2 ≥0,
∂p1,1,t+1 ∂c21,1,2 ≤0,
∂p1,1,t+1 ∂c22,1,2 ≤0.
However, in the inter-segmental case, there may be irreducible indirect effects that work by first influencing the usage shares in the other segment and then taking an indirect effect by means of these. This will be discussed in more detail in section 4.2. The proper way to analyze this is by computing the attractors in this dynamical system and assessing their stability. For a single segment with two standards with symmetricAandα <1, this unsurprisingly yields the result that there are two stable equilibria (the monopolization of the segment by the two standards respectively) and one unstable tipping equilibrium (for detailed derivation, see appendix B).
This is in agreement with the present analysis and the previous literature: network externalities must, if present, have a very strong effect towards asymmetric market power and usage shares and ultimately towards monopolization. However, the analysis becomes much more complex for multi-segmental versions of the model in which more than one compatibility matrix remains. In fact, non-trivial indirect effects appear as well as is shown below. To analyze this more deeply and comprehensively before proceeding to agent-based versions of the model, Monte Carlo simulations were conducted and are discussed in section 4.2.
3.2
Agent-Based Simulation Model with Explicit Network Structure
Macro-level models like the replicator dynamics above and like many of the network externality models in the literature generally assume a complete network between the agents and often also - sometimes depending on the interpretation - generally homogeneous agents. This does not live up to accurately representing what is observed in the real world. The purpose of those models, creating simplified mathematical representations of the real world in order to identify general characteristics, should therefore be complemented by analyses that drop these simplifications, that allow for heterogeneity and, perhaps more importantly, for a greater variety of network structures. It must be shown that the general characteristics identified in macro-level models continue to hold there. Further, the effect of network structures can be investigated as can be mechanisms that rely on their characteristics (the friendship paradox as addressed in a simulation in section 4.3 for instance).
The proper tool for such an analysis is agent-based modeling and simulation [Pyka and Fagiolo, 2005, Elsner et al., 2015, Gr¨abner, 2015]. Specifically, the aggregated level development equations from the above replicator model are dropped; agents are modelled explicitly and are periodically allowed to reconsider their adoption decision. In doing so, they do take network externalities into account but only those that arise from their direct neighbors. That is, connections indicate nothing more and nothing less than the potential need to interact by making use of the standard in question such that the choice of the connected neighbor causes an external effect on the agent.11
This would, in turn, prompt the agent to take her information about previous adoption decisions by neighbors into account in her own adoption decision. It is reasonable to assume that agents are perfectly informed about their neighbors adoption decisions, since the network externality gives incentive to try to be coordinated and neighbors would therefore have an incentive to announce their adoption decisions both immediately and truthfully. In order to keep the model close and comparable to the aggregated level replicator model above, the future population sharespi,j,t+1in the replicator model are used
as probabilities for the agent to adopt the respective technologies, hence
pi,j,t+1=pLi,j,t(1 +fi,j,tL −φLj,t)
with
fjL′,t=wj′,j′Aj′pLj′,t+
X
j6=j′
wj′,jCj′,jp L j,t.
φLj,t= (f L j′,t)
T
pLj′,t
where the variables with superscriptLindicate quantities in the immediate neighborhood of the respective agent that are not necessarily constant across the network. Furthermore the usage sharespLj′,tare absolute, not relative, usage
shares, that is non-adopters count as a seperate share which means that agents who encounter no adopters in their neighborhood will also not adopt any technologies (since all adoption probabilities are then multiplied with 0), agents
11A potential extension for a more elaborate model would be to consider links of different strength; the present model considers
with a small share of adopters in their vicinity will also only have a small (but positive) share to join a standard’s usage network.
Five network structures will be studied:
1. Complete network. All agents are direct neighbors of all other agents. This should correspond most directly to the aggregated level replicator model above (with minor changes, such as a stochastic term for the agent’s technology adoption decision instead of deterministic development equations for the shares). It is meant as a mere benchmark case.
2. Regular 1-d grid. Agents are arranged in a circle and directly connected to n neighbors (out of a total ofN agents) to both sides. For the following simulations the parameter setting n= 30, N = 1000 are used. Grid networks are known to have constant betweenness centrality, high clustering, and a large diameter relative to the number of vertices. As discussed in the literature review above, they tend to cancel out monopolization effects in network externality models of technology diffusion.
3. Barab`asi-Albert preferential attachment networks. Starting with one agent, new agents are added and connected toknodes with a probability proportional to their current degree (number of direct neighbors). This produces a heavily asymmetric degree distribution which is, in fact, scale free; such networks are known to also have a small diameter. The parameter settings used below arek= 2,N= 1000.
4. Barab`asi-Albert preferential attachment networks with triadic closure. Since real-world networks tend to be highly clustered, something which is not the case for Barab`asi-Albert networks, clustering is increased here by using triadic closure. mopen triads, unconnected nodes which have a common neighbor, are randomly selected and closed. The parameter setting used in the simulations below isk= 1,N= 1000,m= 1000 which gives the network as many edges as network (3) but a larger diameter. Note that triadic closure is similar to V´azquez’ [V´azquez, 2003] connect nearest neighbor (CNN) network generating mechanism: as nodes of higher degree are more likely to be selected, this should increase the asymmetry of the degree distribution (and indeed combine two power-law generating mechanisms).
5. Barab`asi-Albert preferential attachment networks with triadic closure like network (4) but with parameters k = 2, N = 1000, m = 1000 which gives the network a diameter similar to that of network (3) but higher density.
These five structures cover both basic benchmark cases for comparison with the simple aggregated level replicator (the complete network, and, to a lesser extent, the grid network) and network structures that include many realistic features also observed in real life networks including clustering (grid network, preferential attachment with triadic closure) and small diameter (small-world property) as well as scale-free degree distribution (preferential attachment networks). The literature discussed in section 2 offers some guidance on what to expect in models with these network structures: clustering should tend to reduce network externalities and subsequent monopolization effects, high density and scale-free degree distributions may counteract this reduction.
4
Simulation Analysis
Simulation offers a convenient and reliable method to study the behavior of complex systems at least in parts of their potentially vast possibility space. With the limits of analytical resolvability of the general model exhausted in the face of a large number of free parameters, this section first turns to Monte Carlo simulation to study the development of some representatives of the general class of models before proceeding to agent-based simulation in order to analyze effects of the network structure and to verify that the general characteristics derived for the aggregated level model continue to hold with an agent-based micro-level.
4.1
Experimental Design
Most of the following simulation studies will consider two segment models with two standards in each of them (hence quadratic 2×2 matricesAand C). It is further assumed that all standards are ”tied” to one other standard in the other segment, hance havong higher compatibility with this that with the other one; for convenience the first standard in both segments and the second standard in both segments are considered ”tied” (hencec11will for instance generally
be larger thanc12 except in runs in which variation of these terms is studied). MatricesC1,2andC2,1are assumed to
be transposes, i.e. inter-segmental compatibility is symmetric.12
12
The parameters for the fitness weight of the two segments will be set to 1 for intra-segmental influence,w1,1=w2,2= 1,
and 2 for inter-segmental influence,w1,2 =w2,1 = 2 but some of the runs will be contrasted by runs without intra-segmental
0.2 0.0 0.2 0.4 0.6 0.8 1.0 1.2 0.2
0.0 0.2 0.4 0.6 0.8 1.0 1.2
(a) Grid (multiple ring)
0.2 0.0 0.2 0.4 0.6 0.8 1.0 1.2
0.2 0.0 0.2 0.4 0.6 0.8 1.0 1.2
(b) Preferential attachment
0.2 0.0 0.2 0.4 0.6 0.8 1.0 1.2
0.2 0.0 0.2 0.4 0.6 0.8 1.0 1.2
(c) Preferential attachment with triadic closure
0.2 0.0 0.2 0.4 0.6 0.8 1.0 1.2
0.2 0.0 0.2 0.4 0.6 0.8 1.0 1.2
[image:8.595.99.544.223.634.2](d) Preferential attachment with triadic closure (with diameter similar to (1b))
The specific effects that are to be studied with either aggregated level Monte Carlo simulation (MC) or agent-based simulation (ABM) are:
1. effect of the initial usage share of standardi,pi,j,0, on the development of its usage share, hence onpi,j,t(MC)
2. effect of the initial usage share of standardi in segmentj,pi,j,0 on the development of the usage share of a
standard in segmentj′ that is ”tied” to standardi, hence onp
i′,j′,t(MC)
3. effect of the inter-segmental compatibility with a standard in segmentj′that is ”tied” to standardiin segment
j,cii,j,j′, onpi,j,t(MC)
4. effect of the inter-segmental compatibility with a standard in segmentj′that is ”tied” to another standard but iin segmentj,cii′,j,j′, onpi,j,t(MC)
5. interaction of the two inter-segmental compatibility terms onpi,j,t(MC)
6. effect of reducing the the inter-segmental compatibility with a standard in segmentj′that is ”tied” to another standard butiin segmentj,cii′,j,j′, after a certain thresholdthin terms of network size compared to the other
standard is reached onpi,j,t(MC)
7. effect of expanding into another segmentj′by the vendor of standardiin segmentjestablishing a new standard
with higher inter-segmental compatibility withi,cii∗,j,j′, (with a very small but positive initial usage share) on
pj,t andpj′,t(MC)
8. effect of the initial usage share of standardiin segmentjbefore expanding into segmentj′ as described above
onpj,t andpj′,t(MC)
9. effect of the inter-segmental compatibility between standard iin segment jand its new subsidiary in segment j′,cii∗,j,j′, when expanding as described above onpj,tandpj′,t(MC)
10. interaction of the network structure with the effect of initial usage share (effect 1, ABM)
11. interaction of the network structure with the effect of inter-segmental compatibility with a ”tied” standard (effect 3, ABM)
12. interaction of the network structure with the effect of inter-segmental compatibility with another but the ”tied” standard (effect 4, ABM)
13. effect of the initial total usage shares,P
ipi,j,0, on the development of the relative usage shares in the same and
”tied” segments,pj,tandpj′,t
14. effect of Feld’s [Feld, 1991] friendship paradox, the fact that an agent’s neighbors (”friends”) in a network with asymmetric degree distribution do on average have more neighbors and are thus more central. This effect has been proposed to be used in various fields, most importantly, immunisation against infectious diseases in order to contain epidemics in a complex social network. The suggested procedure works by selecting a random neighbor (friend) of arbitrarily chosen agents. The effect of this procedure applied to the initial users of one of two competing standards on the final usage share of this standard is studied for the network structures listed above.
The simulation study starts by investigating effects 1 through 9 in one-, two-, and (in case of effects 1 - 4) three-segment replicator models. These are fully deterministic, hence a single-run Monte Carlo simulation suffices. For this part of the study, the variable of interest as indicated in the list above is varied while the other parameters are kept constant.
If not indicated otherwise, the parameters for the following Monte Carlo simulations are set as follows: A =
1 0.9 0.9 1
, C =
0.1 0 0 0.1
, w1,1 = w2,2 = 1, w1,2 = w2,1 = 2; the settings for the initial usage shares
vary according to the scenario needed for the study of the respective effect.
The agent-based simulation follows the same principle (just one effect or variable is varied ceteris paribus) but with 100 runs per effect and setting with all studies repeated for all five network types under investigation. The illustrations in figures 11 through 15 show the average and the 90% intervals. The most central purpose of the agent-based simulation is to confirm that the findings of the aggregated level models persist in the agent-based version. Further, the effects of the network structure etc. are to be assessed.
4.2
Monte Carlo Simulation of the Replicator Dynamic Model
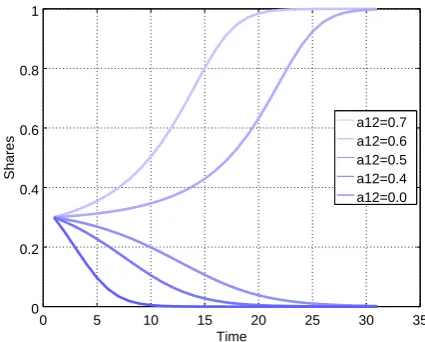
4.2.1 One-Segment Setting
For comparison to the two-segment model below, a one segment Monte Carlo simulation is included to show the effect
ofp1 (figure 2a) with A=
1 0.9 0.9 1
and ofa12 withA=
1 0.9 a12 1
andpt=0=
0.3 0.7
results are as predicted analytically in section (3.1), but it becomes clear that a high one-way compatibility (a12 but
nota21) can help recovering from an inferior position with low usage share but only ifa12exceeds a certain threshold
(which is between 0.4 and 0.5 for the current settings). From the theoretical analysis in section 3.1 and appendices A and B it becomes clear that this must be the case for all models of this type. For the multi-segment models, however, this is less easy to assess.
4.2.2 Effect of Initial Usage Share (Effects 1, 2)
In figures (3) it can be seen that initial usage shares in both segments matter in the currently studied case of tied standards, both have a positive effect on the final usage shares (and dominance of the two segments) and this always happens in conjunction for the two tied standards, if one succeeds, the other succeeds as well. The two figures give the development in the first (upper graphs) and the second (lower graphs) segments for both the basic setting as defined above (3a) and the setting without intra-segmental effects (hence more pronounced inter-segmental effect, 3b). Note
that the tipping equilibrium atpj,tmax=
0.5 0.5
that results from one of the runs in both settings is unstable and
would not occur in either the agent-based version or a simple stochastic version of the model. Larger multi-segment models yield similar results as seen in figure 9a for a three-segment model.13
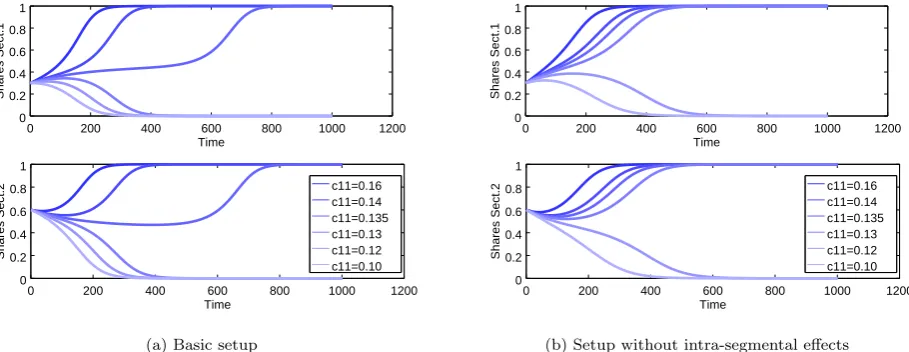
4.2.3 Effect of Inter-Segmental Compatibility with Tied Partner Standard (Effect 3)
Starting with slightly asymmetric initial usage shares,p1,0=
0.3 0.7
,p2,0=
0.6 0.4
, the compatibility term of the
first (tied) standards in both segments is increased beyond the basic setting ofc11= 0.1. For the basic setting, this
would result in the tied pair being eliminated (as was seen in figure 3), but high enough (aboutc= 0.135 in the basic setting, figure 5a) inter-segmental compatibility recovers their dominance simultaneously in both segments as seen in figure 5.
4.2.4 Effect of Inter-Segmental Compatibility with Other Standard(s) (Effect 4)
Increasing the compatibility with the other standard (not the tied partner standard) fromc12= 0.0 towardsc12= 0.1
does not stop the decline of a pair of tied standards in an inferior position (low usage shares), not even when it approachesc12= 0.1 at which point the standard could be considered tied to both standards in the other segment.
Standards in a superior position can, however, speed up their development to dominance of its segment at the expense of its tied partner in the other segment as shown in figure 4. It should be noted, that this is, however, not a monotonic process as maintaining incompatibility with the opposing team of tied standards would at the same time slow the initial increase in usage shares and make the approach of complete dominance after this initial phase significantly faster. This constitutes a true indirect effect that works via usage shares in the other segment and contradicts the direct effects analyzed in the theoretical model above in appendix A where it was found that any compatibility with a standard i has a positive direct effect on its usage share - this is evidently superseeded by an indirect effect in the present case. Figure 9b shows that the same effect is present in multi-segment (here three-segment) models with similar setup.14
4.2.5 Interaction of Inter-Segmental Compatibilities with Tied Partner and Other Standards (Effect 5)
Figure 6 shows the effect of increasingc12simultaneously to a higherc11= 0.14 as studied in the run depicted in figure
5a. Also in this case, a quicker increase in usage share can be obtained at the expense of the tied partner standard in the other segment by increasing the compatibility to its competitor.
13The three-segment model uses the same matricesAfor all segments and the basic inter-segmental compatibility matrices
C=
0.1 0 0 0.1
between segments 1 and 3 and between segments 2 and 3 while only varyingc12between segments 1 and 2.
(w1,1=w2,2=w3,3= 1,w1,2=w2,1=w3,1=w1,3=w3,2=w2,3= 2.) 14
0 5 10 15 20 25 30 35 0
0.2 0.4 0.6 0.8 1
Time
Shares
p1=0.9 p1=0.8 p1=0.7 p1=0.6 p1=0.5 p1=0.4 p1=0.3 p1=0.2 p1=0.1
(a) Effect of initial usage share
0 5 10 15 20 25 30 35 0
0.2 0.4 0.6 0.8 1
Time
Shares
a12=0.7 a12=0.6 a12=0.5 a12=0.4 a12=0.0
[image:11.595.329.542.126.297.2](b) Effect of intra-segmental compatibility
Figure 2: One-segment model
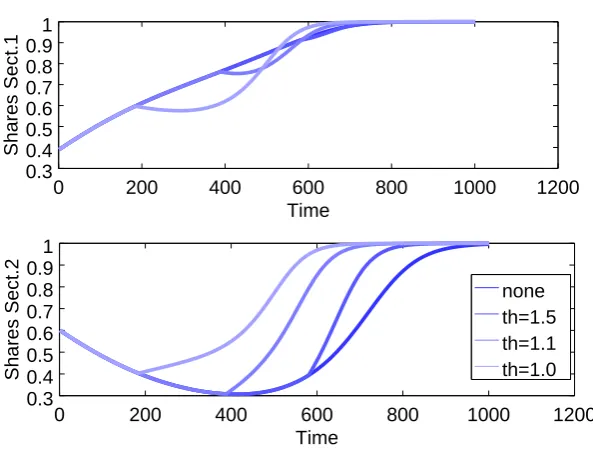
4.2.6 Compatibility Reduction (Effect 6)
A standard in a pair of compatible standards but with comparatively low usage share may try to improve its position by increasing compatibility (c12) to (the) other standard(s) in the other segment - or there may just accidentally be
some basic compatibility between all standards. When is it time, if at all, to reduce that compatibility? Figure 7
shows a setting with a slightly different compatibility matrixC =
0.103 0.05 0 0.1
and assumes that a standard’s
vendor is theoretically capable to reduce compatibility terms by inserting artificial obstacles preventing interaction between the standards. In these simulation runs,c12 is reduced to 0 if the usage share of standard 1 in segment 1,
p1,1,t reaches a threshold level thanth×max(p2,t). The analytical findings above suggest that compatibility results
in positive direct effects, hence any positive result of reducing compatibility would be expected to originate from an indirect effect. Figure 7 suggests that this is actually the case and that it takes a form similar to the findings in the runs in figure 4 above.
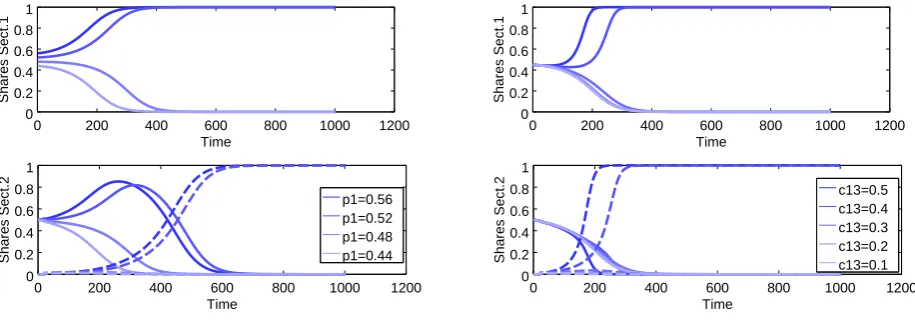
4.2.7 Expansion into the Other Segment (Effects 7, 8, 9)
The commercial vendor of a standard in segment 1, standard i= 1 which is dissatisfied with her standard’s com-patibility with standards in segment jmay consider to expand into this segment creating a standard with a higher compatibility withi= 1. Starting with the basic setup as introduced above, a new standard in segment 2 is created
with an initial usage share ofp3,2,t= 0.01 and the compatibility matrices are changed to A2 =
1 0.9 0.9 0.9 1 0.9 0.9 0.9 1
,
C=
0.1 0 c13
0 0.1 0
. Both the effect of the usage share of standardiin segment 1 (withc13= 0.2) and the
com-patibility term with the new standardc13(withp1,1,0 = 0.45) are studied with the remainder of the second segment
initially shared withp2,0=
0.5 0.5
between the initial two standards in this segment (figure 8). It is shown that the
newly introduced standard is quickly able to corner the second segment (improving the position of standardiin the first segment in the process) if the usage of standardiin the first segment was large enough before expanding into the second segment.
4.3
Agent-Based Simulation
The agent-based simulation is conducted in two steps: First, it is to be shown that the characteristic effects found for the macro-level replicator model either in the analytical setup or in the Monte Carlo simulations above, are still present in the agent-based version (otherwise they might be accidental results of the macro-level model). Second, the impact of the network structure and that of the initial share of total adopters (P
0 100 200 300 400 500 600 700 0 0.2 0.4 0.6 0.8 1 Time Shares Sect.1
0 100 200 300 400 500 600 700 0 0.2 0.4 0.6 0.8 1 Time Shares Sect.2 p1=0.5 p1=0.4 p1=0.3 p1=0.2 p1=0.1
(a) Basic setup
0 100 200 300 400 500 600 700 0 0.2 0.4 0.6 0.8 1 Time Shares Sect.1
0 100 200 300 400 500 600 700 0 0.2 0.4 0.6 0.8 1 Time Shares Sect.2 p1=0.5 p1=0.4 p1=0.3 p1=0.2 p1=0.1
[image:12.595.88.543.138.312.2](b) Setup without intra-segmental effects
Figure 3: Two-segment model: Effect of initial usage share
0 200 400 600 800 1000 1200 0.65 0.7 0.75 0.8 0.85 0.9 0.95 1 Time Shares Sect.1
0 200 400 600 800 1000 1200 0 0.2 0.4 0.6 0.8 1 Time Shares Sect.2 c12=0.10 c12=0.05 c12=0.00
(a) Basic setup
0 200 400 600 800 1000 1200 0.65 0.7 0.75 0.8 0.85 0.9 0.95 1 Time Shares Sect.1
0 200 400 600 800 1000 1200 0 0.2 0.4 0.6 0.8 1 Time Shares Sect.2 c12=0.10 c12=0.05 c12=0.00
[image:12.595.86.545.365.542.2](b) Setup without intra-segmental effects
Figure 4: Two-segment model: Effect of inter-segmental compatibility between tied partner standards,c11
0 200 400 600 800 1000 1200
0 0.2 0.4 0.6 0.8 1 Time Shares Sect.1
0 200 400 600 800 1000 1200
0 0.2 0.4 0.6 0.8 1 Time Shares Sect.2 c11=0.16 c11=0.14 c11=0.135 c11=0.13 c11=0.12 c11=0.10
(a) Basic setup
0 200 400 600 800 1000 1200
0 0.2 0.4 0.6 0.8 1 Time Shares Sect.1
0 200 400 600 800 1000 1200
0 0.2 0.4 0.6 0.8 1 Time Shares Sect.2 c11=0.16 c11=0.14 c11=0.135 c11=0.13 c11=0.12 c11=0.10
(b) Setup without intra-segmental effects
[image:12.595.89.544.595.771.2]0 200 400 600 800 1000 1200 0.2
0.4 0.6 0.8 1
Time
Shares Sect.1
0 200 400 600 800 1000 1200
0 0.2 0.4 0.6 0.8 1
Time
Shares Sect.2
[image:13.595.207.414.176.338.2]c12=0.15 c12=0.12 c12=0.11 c12=0.10 c12=0.05 c12=0.00
Figure 6: Interaction between inter-segmental compatibility terms between tied partners and other standards,
c11 andc12
0 200 400 600 800 1000 1200
0.3 0.4 0.5 0.6 0.7 0.8 0.9 1
Time
Shares Sect.1
0 200 400 600 800 1000 1200
0.3 0.4 0.5 0.6 0.7 0.8 0.9 1
Time
Shares Sect.2
none th=1.5 th=1.1 th=1.0
[image:13.595.162.459.493.718.2]0 200 400 600 800 1000 1200 0 0.2 0.4 0.6 0.8 1 Time Shares Sect.1
0 200 400 600 800 1000 1200 0 0.2 0.4 0.6 0.8 1 Time Shares Sect.2 p1=0.56 p1=0.52 p1=0.48 p1=0.44
(a) Effect of initial usage share
0 200 400 600 800 1000 1200 0 0.2 0.4 0.6 0.8 1 Time Shares Sect.1
0 200 400 600 800 1000 1200 0 0.2 0.4 0.6 0.8 1 Time Shares Sect.2 c13=0.5 c13=0.4 c13=0.3 c13=0.2 c13=0.1
(b) Effect of inter-segmental compatibility
Figure 8: Effect of expansion into the second segment
0 100 200 300 400 500 600 700
0 0.2 0.4 0.6 0.8 1 Time Shares S.1
0 100 200 300 400 500 600 700
0 0.2 0.4 0.6 0.8 1 Time Shares S.2
0 100 200 300 400 500 600 700
0 0.2 0.4 0.6 0.8 1 Time Shares S.3 p1=0.9 p1=0.8 p1=0.7 p1=0.6 p1=0.5
(a) Effect of initial usage share
0 100 200 300 400 500 600 700
0 0.2 0.4 0.6 0.8 1 Time Shares S.1
0 100 200 300 400 500 600 700
0 0.2 0.4 0.6 0.8 1 Time Shares S.2
0 100 200 300 400 500 600 700
0 0.2 0.4 0.6 0.8 1 Time Shares S.3 c12=0.15 c12=0.10 c12=0.05 c12=0.00
[image:14.595.88.546.195.356.2](b) Effect of inter-segmental compatibility
[image:14.595.154.537.533.698.2]The agent-based simulations use the same parameter setup as the Monte Carlo simulations (where not indicated otherwise). Further, where not indicated otherwise, they start withP
ipi,j,t = 0.75 in both segments (25% of the
agents as non-adopters). A single time step indicates one agent reevaluating her adoption decisions, i.e. withN= 1000 agents andtmax= 10000 time steps, the average agent will reevaluate her decision 10 times. As seen below, this leads
to a rather slow development compared to what is to be expected in the real world and compared to the replicator dynamic above.
Figure 10 shows the result of 9 example runs in a complete network for 9 different initial relative shares of the second
segment while the first segment is dividedp1,0=
0.6 0.4
for all 9 runs. The simulations show that the monopolization
towards the pair of tied standards with the larger overall usage share as predicted above does occur and that it does occur in both segments. This was to be expected since this case used the complete network. Results for all network structures under consideration here (for 100 runs per setting) are found in a more compressed form (not the entire development, just the final usage shares) in figure 11. As would be expected, the resulting curve is s-shaped with very asymmetric starting distributions converging to monopolization much quicker; the effect can be reproduced for all network structures.
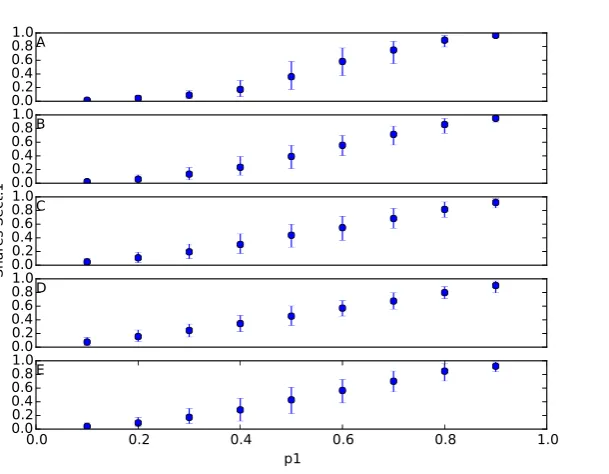
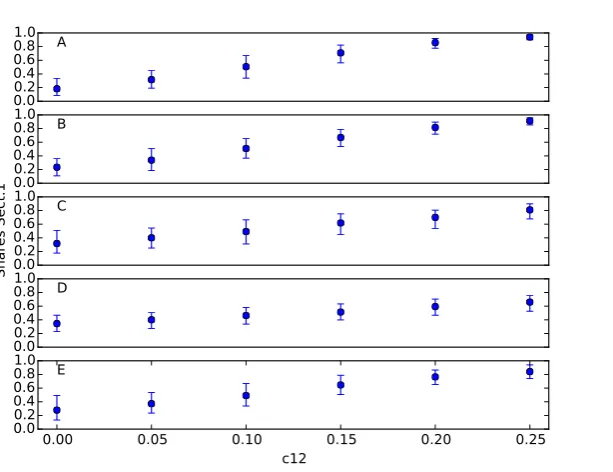
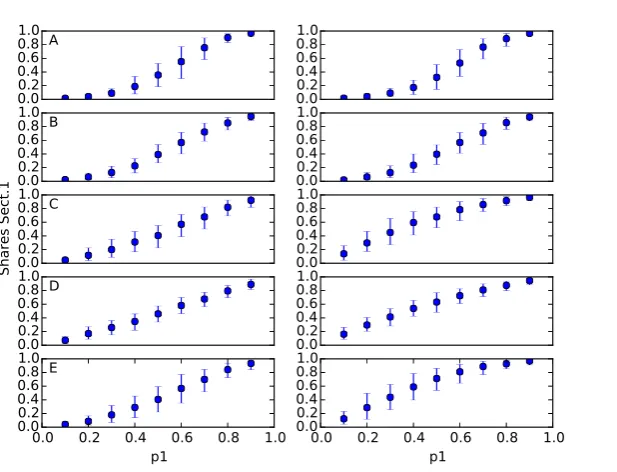
To a somewhat lesser degree, this does also hold for the effects of inter-segmental compatibility as analyzed above and as shown in the results of agent-based studies in figures 13 and 12. Considerable variation remains for some parameter values and some network structures; for thek = 1 preferential attachment network with triadic closure (diagram D in figures 12 and 13), the effects are much less pronounced than for the other network types, but certainly remain detectable. The effects are strongest in the case of the complete network (diagrams A) and the regular grid (diagrams B). Interestingly, this can also be said for values betweenp1= 0.2 andp1= 0.8 in the effect of the initial usage share
in figure 11. Here too, the preferential attachment networks (and to a lesser degree the grid network in diagram B) lead to slightly less pronounced effect. The effect is clearly detectable but with a lot or variation in the center the clear s-shape of the curve does not appear to emerge in these cases. The most likely explanation for this is that asymmetric network structures (C through E) allow for more isolated (even clustered in cases D and E) subcommunities and consequently tend to preserve initial usage shares compared to any outside effects homogenizing the network.
The effect of the initial total usage share (P
ipi,j,0) is given in figure 14. Starting from an initial equal sharing
(pj,0=
0.5 0.5
) between the standards, the shares of the then largest standard are studied aftertmax= 10000 time
steps. While the complete network leads to an asymmetric final distribution, particularly if the initial total usage share was low, this is not so much the case for the other network structure; particularly network structure D (k= 1
preferential attachment network with triadic closure) does not deviate far from the initial distributionpj,0=
0.5 0.5
and also has a markedly lower standard deviation. This is probably also a result of the presence of multitudes of isolated clusters.
Finally, Feld’s [Feld, 1991] friendship paradox as introduced above is studied with the results shown in figure 15. Unsurprisingly, it is found to have no effect in the network structures with homogeneous degree distributions (complete network and regular grid, A and B) while for all other network structures, this leads to the s-shaped curve being changed to a concave one with the lower end (low initial shares) being inflated upwards, hence developing to moderately high to high final usage shares as a result of the well-connected initial adopters. It should be noted that commercial vendors frequently seek to employ such a strategy (trying to win over more well-connected individuals first) by approaching institutions like universities with favorable contracts etc.
5
Evidence from the ICT Sector
While the literature does not offer any previous models on strategic use of network externalities and market power in the case of tied standards, there is a small literature tradition on product bundling [Choi, 2004, Nalebuff, 2004, Miao, 2010, Eisenmann et al., 2011] and there are some empirical observations that strongly imply the systematic employment of such strategies. This section will discuss a few examples from the ICT sector.
0 2000 4000 6000 8000 10000
0.2
0.3
0.4
0.5
0.6
0.7
0.8
0.9
1.0
Shares Sect.1
0 2000 4000 6000 8000 10000
Time
0.0
0.2
0.4
0.6
0.8
1.0
Shares Sect.2
0 2000 4000 6000 8000 10000
0.2
0.3
0.4
0.5
0.6
0.7
0.8
0.9
1.0
0 2000 4000 6000 8000 10000
Time
[image:16.595.162.472.143.381.2]0.0
0.2
0.4
0.6
0.8
1.0
Figure 10: Development of usage shares in a two-segment model with two standards each, complete network, initial total usage shares 0.75. Absolute shares on the left hand side (blue curve: shares of standard 1, p1, the green curve gives 1−p2, i.e. if read with an inverted scale the shares of standard 2), relative shares on
the right hand side.
0.0 0.2 0.4 0.60.8 1.0 A
0.0 0.2 0.4 0.60.8 1.0B
0.0 0.2 0.4 0.60.8 1.0
Shares Sect.1
C
0.0 0.2 0.4 0.60.8 1.0D
0.0 0.2 0.4 0.6 0.8 1.0
p1 0.0
0.2 0.4 0.60.8 1.0 E
Figure 11: Initial relative usage shares: Final usage share of standard 1, p1, depending on its initial relative usage shares, average and 90% interval of 100 runs for each setting. Network structures: (A) complete network, (B) regular ring grid, (C) Barab`asi-Albert, (D) k = 1 Barab`asi-Albert with triadic closure, (E)
[image:16.595.166.471.487.724.2]0.0 0.2 0.4 0.60.8 1.0 A
0.0 0.2 0.4 0.60.8 1.0
B
0.0 0.2 0.4 0.60.8 1.0
Shares Sect.1
C
0.0 0.2 0.4 0.60.8 1.0 D
0.10 0.15 0.20 0.25 0.30
c11 0.0
[image:17.595.166.472.143.379.2]0.2 0.4 0.60.8 1.0 E
Figure 12: Inter-segmental compatibility: Final usage share of standard 1, p1, depending on inter-segmental compatibility with the tied partner standard, average and 90% interval of 100 runs for each setting. Network structures: (A) complete network, (B) regular ring grid, (C) Barab`asi-Albert, (D) k = 1 Barab`asi-Albert with triadic closure, (E)k= 2 Barab`asi-Albert with triadic closure.
0.0 0.2 0.4 0.60.8 1.0
A
0.0 0.2 0.4 0.60.8 1.0 B
0.0 0.2 0.4 0.60.8 1.0
Shares Sect.1
C
0.0 0.2 0.4 0.60.8 1.0 D
0.00 0.05 0.10 0.15 0.20 0.25 c12
0.0 0.2 0.4 0.60.8 1.0
E
[image:17.595.165.472.487.723.2]0.5 0.60.7 0.8 0.9 1.0 A 0.5 0.60.7 0.8 0.9 1.0 B 0.5 0.60.7 0.8 0.9 1.0 Shares Sect C 0.5 0.60.7 0.8 0.9 1.0 D
0.0 0.2 0.4 0.6 0.8 1.0
[image:18.595.165.472.138.376.2]Initial Share of Adopters 0.5 0.60.7 0.8 0.9 1.0 E
Figure 14: Initial total usage shares: Final usage share of largest standard in segment 1, max(p1, p2), depend-ing on initial total usage shares, average and 90% interval of 100 runs for each settdepend-ing. Network structures: (A) complete network, (B) regular ring grid, (C) Barab`asi-Albert, (D) k = 1 Barab`asi-Albert with triadic closure, (E)k= 2 Barab`asi-Albert with triadic closure.
0.0 0.2 0.4 0.60.8 1.0 A 0.0 0.2 0.4 0.60.8 1.0 B 0.0 0.2 0.4 0.60.8 1.0 Shares Sect.1 C 0.0 0.2 0.4 0.60.8 1.0 D
0.0 0.2 0.4 0.6 0.8 1.0 p1 0.0 0.2 0.4 0.60.8 1.0 E 0.0 0.2 0.4 0.6 0.8 1.0 0.0 0.2 0.4 0.6 0.8 1.0 0.0 0.2 0.4 0.6 0.8 1.0 0.0 0.2 0.4 0.6 0.8 1.0
0.0 0.2 0.4 0.6 0.8 1.0 p1 0.0 0.2 0.4 0.6 0.8 1.0
[image:18.595.163.472.479.715.2]by bundling products (across tied segments), particularly, in case of firms that offer a wide variety of related products like Sun (at the time), Google, Apple, and Microsoft. It can also be accomplished by acquiring more well-connected users (say, university students and faculty) and perhaps by coercing the help of prominent institutions (say, by offering special deals to universities) - in fact, aggressive marketing to otherwise privileged user groups is rather common. The case of Sun’s Java offers a prime example of a huge marketing campaign that was run to position the new standard in the mid 1990s, probably in full awareness of the intricacies of network externalities [Garud et al., 2002].
Further, many successful commercial ICT standards started out by securing a temporary bundling or at least a licensing cooperation with one of the major players in a tied subsector: Microsoft’s success in the 1980s came after (and as a direct consequence of) its alliance with IBM in the 1970s; one of the first strategic actions of Sun’s deployment of Java in 1995 was a licensing agreement with Microsoft [Garud et al., 2002]; the three successful mobile operating systems (Android, iOS, Windows Mobile) were established by major vendors of other (tied) standards, the Google search engine (in combination with other Google online services) in case of Android and PC operating systems in case of Apple’s iOS and Microsoft’s Windows Mobile. Sure enough they swiftly displaced the early mobile operating systems by less well-positioned vendors, such as Blackberry and Symbian [West and Mace, 2010].
More recently there has been speculation about which segment is likely to determine the future development of the ongoing mobile device platform competition with some scholars arguing that attracting third-party developers is the most important aspect [Ghazawneh and Henfridsson, 2013] while others contend that mobile online services (app stores, integration with social networks) play a crucial role compared to more traditional (software and hardware) segments [Kenney and Pon, 2011]. Specifically, the platforms that emerged as superior, Apple iOS, Google Android, and Windows Mobile were identified as those able to generate revenue in those services. An interesting strategy may be that of Google, which generates its revenue and the network externalities crucial in keeping the platform competitive in entirely different segments [Kenney and Pon, 2011]. Note, however, that this particular analysis in [Kenney and Pon, 2011] does not place too much value on the integration of and compatibility among the segments; as the simulations above suggest, this may be another crucial effect, which may be at the bottom of the success of the tightly closed Apple platform.
6
Conclusions
One of the open problems of the economic analysis of information and communication technologies is the problem of ”tied” segments, i.e. in segments that are subject not only to network externalities originating in the same segments but also to those that unfold in other, connected segments. A practical example is provided by the large number of integrated software products in the ICT sector with the vendors of these products partly locked in fierce battles for dominance of one segment or another, and partly engaged in quests of integrating their products across segments and cementing their commanding position in those markets.
The present article proposed a model for the analysis of standards in tied segments. Starting with a macro-level replicator dynamic, an agent-based version with a plausible micro-level was added. The complexity of both models required their analysis by means of simulation methods, Monte Carlo simulations in the case of the replicator dynamic, agent-based simulations in the case of the fully agent based model. This approach allowed a number of effects to be studied including the central role of initial usage shares and - in many cases - compatibility with other standards within and across segments. There are, however, a number of limitations to this finding: Reducing compatibility with certain other standards may be a strategically preferable option for successful standards (that is, those with a large usage share), the effect of compatibility terms is much less pronounced in user network structures with asymmetric degree distributions and especially in those with local clusters (introduced in this case by triadic closure), and many network structures tend to preserve at least isolated niches of competing standards.
Other strategic options such as expanding into other segments and focusing on well-connected agents when trying to establish an initial installed base (here modeled using Feld’s friendship paradox) were studied as well. However, the number of potentially available strategies is certainly far larger. Some possible examples for the identified effects were studied in section 5. While it may appear trivial that tying between segments, possibly into large integrated platforms as well as the management of compatibility within and between platforms is crucial for competitors in industries with network extermalities, these effects and their interaction have not yet been investigated systematically. More complex strategies, that rely on the network structure (such as appealing to more well-connected users as discussed above) do exist and interfere with the simple effects.
However, the present analysis has identified some general features, such as the existence of various basins of attraction, the role of network structures, and the nature of interference between effects. The exact shapes including the sizes of the basins of attraction, the tipping points, the relative strengths of the effects would change depending on the details of the models. The study of those details would have to be conducted on a calibrated version of a model that would take the industry-specific characteristics into account.
For many helpful and instructive comments and discussions, I am grateful to Sidonia von Proff, Ben Vermeulen, Claudius Gr¨abner, Wolfram Elsner, and to the participants of the Annual Meeting of the Evolutorischen Ausschuss of the Verein f¨ur Socialpolitik 2015, the Annual Conference of the European Association for Evolutionary and Political Economy 2015, and the Conference on Complex Systems 2015. All remaining errors are my own.
Compliance with Ethical Standards
There are no conflicts of interest. The research presented in this paper is in compliance with accepted ethical standards for good science.
References
[Arthur, 1988] Arthur, W. B. (1988). Self-reinforcing mechanisms in economics. In Anderson, Philip, K. J. A. and Pines, D., editors, The Economy as an Evolving Complex System, pages 9–31. Santa Fe Institute Studies in the Sciences of Complexity, Redwood City California, Addison Wesley.
[Arthur, 1989] Arthur, W. B. (1989). Competing technologies, increasing returns, and lock-in by historical events.
Economic Journal, 99(394):116–31.
[Arthur et al., 1982] Arthur, W. B., Ermoliev, Y. M., and Kaniovski, Y. M. (1983 [1982]). A generalized urn problem and its applications. Cybernetics, 19:61–71. Translated from Russian (Kibernetica 1:49-56).
[Arthur et al., 1987] Arthur, W. B., Ermoliev, Y. M., and Kaniovski, Y. M. (1987). Path dependent processes and the emergence of macro-structure. European Journal of Operational Research, 30:294–303.
[Barab´asi and Albert, 1999] Barab´asi, A.-L. and Albert, R. (1999). Emergence of scaling in random networks.Science, 286(5439):509–512.
[Choi, 2004] Choi, J. P. (2004). Tying and innovation: A dynamic analysis of tying arrangements. The Economic Journal, 114(492):83–101.
[David, 1985] David, P. A. (1985). Clio and the economics of QWERTY.American Economic Review, 75(2):332–337.
[David, 1992] David, P. A. (1992). Heroes, herds and hysteresis in technological history: Thomas Edison and the battle of the systems reconsidered. Industrial and Corporate Change, 1(1):129–180.
[Delre et al., 2007] Delre, S., Jager, W., and Janssen, M. (2007). Diffusion dynamics in small-world networks with heterogeneous consumers. Computational Mathematical Organization Theory, 13:185–202.
[Demsetz, 1968] Demsetz, H. (1968). Why regulate utilities? Journal of Law and Economics, 11(1):55–65.
[Eisenmann et al., 2011] Eisenmann, T., Parker, G., and Van Alstyne, M. (2011). Platform envelopment. Strategic Management Journal, 32(12):1270–1285.
[Elsner et al., 2015] Elsner, W., , Heinrich, T., and Schwardt, H. (2015). Microeconomics of Complex Economies: Evolutionary, Institutional, Neoclassical, and Complexity Perspectives. Academic Press, Amsterdam, NL, San Diego, CA, et al.
[Farrell and Klemperer, 2007] Farrell, J. and Klemperer, P. (2007). Chapter 31 coordination and lock-in: Competi-tion with switching costs and network effects. In Armstrong, M. and Porter, R., editors, Handbook of Industrial Organization, volume 3 ofHandbooks in Economics, pages 1967 – 2072. Elsevier.
[Feld, 1991] Feld, S. L. (1991). Why your friends have more friends than you do. American Journal of Sociology, 96(6):1464–1477.
[Garud et al., 2002] Garud, R., Jain, S., and Kumaraswamy, A. (2002). Institutional entrepreneurship in the spon-sorship of common technological standards: The case of sun microsystems and java. The Academy of Management Journal, 45(1):196–214.
[Gr¨abner, 2015] Gr¨abner, C. (2015). Agent-based computational models - a formal heuristic for institutionalist pattern modelling? Journal of Institutional Economics, FirstView:1–21.
[Heinrich, 2014] Heinrich, T. (2014). Standard wars, tied standards, and network externality induced path dependence in the ICT sector. Technological Forecasting and Social Change, 81:309–320.
[Katz and Shapiro, 1985] Katz, M. L. and Shapiro, C. (1985). Network externalities, competition and compatibility.
American Economic Review, 75(3):424–440.
[Katz and Shapiro, 1986] Katz, M. L. and Shapiro, C. (1986). Technology adoption in the presence of network exter-nalities. Journal of Political Economy, 94(4):822–41.
[Kenney and Pon, 2011] Kenney, M. and Pon, B. (2011). Structuring the smartphone industry: Is the mobile internet os platform the key? Journal of Industry, Competition and Trade, 11(3):239–261.
[Lee et al., 2006] Lee, E., Lee, J., and Lee, J. (2006). Reconsideration of the winner-take-all hypothesis: Complex networks and local bias. Management Science, 52:1838–1848.
[Luksha, 2008] Luksha, P. (2008). Niche construction: The process of opportunity creation in the environment.
Strategic Entrepreneurship Journal, 2(4):269–283.
[Miao, 2010] Miao, C.-H. (2010). Tying, compatibility and planned obsolescence.The Journal of Industrial Economics, 58(3):579–606.
[Nalebuff, 2004] Nalebuff, B. (2004). Bundling as an entry barrier. The Quarterly Journal of Economics, 119(1):159– 187.
[Nelson, 1968] Nelson, R. R. (1968). A ”diffusion model” of international productivity differences in manufacturing industry. American Economic Review, 58:1219–48.
[Pegoretti et al., 2009] Pegoretti, G., Rentocchini, F., and Vittucci Marzetti, G. (2009). An agent-based model of com-petitive diffusion: network structure and coexistence. OPENLOC working paper series, No. 16/2009, Department of Economics, University of Trento, Italy.
[Pyka and Fagiolo, 2005] Pyka, A. and Fagiolo, G. (2005). Agent-based modelling: A methodology for neo-Schumpeterian economics. In Hanusch, H. and Pyka, A., editors, The Elgar Companion to Neo-Schumpeterian Economics. Edward Elgar, Cheltenham.
[Sraffa, 1926] Sraffa, P. (1926). The laws of returns under competitive conditions.The Economic Journal, 36(144):535– 550.
[Swann, 2002] Swann, G. P. (2002). The functional form of network effects. Information Economics and Policy, 14(3):417–429.
[Uchida and Shirayama, 2008] Uchida, M. and Shirayama, S. (2008). Influence of a network structure on the network effect in the communication service market. Physica A: Statistical Mechanics and its Applications, 387(21):5303 – 5310.
[V´azquez, 2003] V´azquez, A. (2003). Growing network with local rules: Preferential attachment, clustering hierarchy, and degree correlations. Phys. Rev. E, 67:056104.
[Watts and Strogatz, 1998] Watts, D. J. and Strogatz, S. H. (1998). Collective dynamics of ’small-world’ networks.
Nature, 393(6684):440–442.
[West and Mace, 2010] West, J. and Mace, M. (2010). Browsing as the killer app: Explaining the rapid success of apple’s iphone. Telecommunications Policy, 34(5-6):270 – 286.
[Young, 1928] Young, A. A. (1928). Increasing returns and economic progress. The Economic Journal, 38(152):527– 542.
A
Derivation of the Marginal Effects of the Compatibility Terms
in the 2-Segment Replicator Model
From equation (1) the evolutionary fitness of standard 1 in segment 1 follows as
f1,1,t=w1,1a11,1p1,1,t+w1,1a12,1p2,1,t+w1,2c11,1,2p1,2,t+w1,2c12,1,2p2,2,t
φ1,t= w1,1a11,1p21,1,t+w1,1a12,1p2,1,tp1,1,t+w1,1a21,1p1,1,tp2,1,t+w1,1a22,1p22,1,t
+w1,2c11,1,2p1,2,tp1,1,t+w1,2c12,1,2p2,2,tp1,1,t+w1,2c21,1,2p1,2,tp2,1,t
+w1,2c22,1,2p2,2,tp2,1,t
and the usage share of standard 1 in segment 1 at timet+ 1 follows as
p1,1,t+1= p1,1,t+w1,1a11,1p21,1,t+w1,1a12,1p2,1,tp1,1,t+w1,2c11,1,2p1,2,tp1,1,t+w1,2c12,1,2p2,2,tp1,1,t
−w1,1a11,1p31,1,t−w1,1a12,1p2,1,tp21,1,t−w1,1a21,1p21,1,tp2,1,t−w1,1a22,1p22,1,tp1,1,t−w1,2c11,1,2p1,2,tp21,1,t
−w1,2c12,1,2p2,2,tp12,1,t−w1,2c21,1,2p1,2,tp2,1,tp1,1,t−w1,2c22,1,2p2,2,tp2,1,tp1,1,t.
and forp2,1,t+1analogously. The direct effects of different variables can now be studied; particularly the compatibility
terms are of interest. For the terms of matrixA,
∂p1,1,t+1
∂a11,1
=w1,1p 2
1,1,t−a11,1p
3
1,1,t≥0
∂p1,1,t+1
∂a12,1
=w1,1p2,1,tp1,1,t−w1,1p2,1,tp21,1,t≥0
∂p1,1,t+1
∂a21,1
=−w1,1p 2
1,1,tp2,1,t≤0
∂p1,1,t+1
∂a22,1
=−w1,1p 2
2,1,tp1,1,t≤0
and, specifically ifAis to be symmetric, henceα=a12,1 =a21,1,
∂p1,1,t+1
∂α =w1,1p2,1,tp1,1,t−2w1,1p2,1,tp
2
1,1,t
which is ∂p1,1,t+1
∂α >0 if, and only, if 0< p1,1, t <0.5.
The direct influence of the terms of the inter-segmental compatibility matrixC are obtained in the same way as
∂p1,1,t+1
∂c11,1,2
=w1,2p1,2,tp1,1,t−w1,2p1,2,tp
2
1,1,t≥0
∂p1,1,t+1
∂c12,1,2
=w1,2p2,2,tp1,1,t−w1,2p2,2,tp
2
1,1,t≥0
∂p1,1,t+1
∂c21,1,2
=−w1,2p1,2,tp2,1,tp1,1,t≤0
∂p1,1,t+1
∂c22,1,2
=−w1,2p2,2,tp2,1,tp1,1,t≤0.
B
Equilibrium and Stability Analysis of the Symmetric 2-Segment
Replicator Model
In this case, we have
A=
1 α
α 1
p1,1,t+1= p1,1,t+w1,1p21,1,t+w1,1α(1−p1,1,t)p1,1,t−w1,1p31,1,t−w1,1α(1−p1,1,t)p12,1,t−w1,1αp12,1,t(1−p1,1,t)
−w1,1(1−p1,1,t)2p1,1,t
= p1,1,t+w1,1p1,1,t(1−p1,1,t)(p1,1,t+α−αp1,1,t−αp1,1,t−(1−p1,1,t))
= p1,1,t+w1,1p1,1,t(1−p1,1,t)(2p1,1,t−2αp1,1,t−1 +α)
= p1,1,t+w1,1p1,1,t(1−p1,1,t)(1−α)(2p1,1,t−1)
= −2w1,1(1−α)p31,1,t+ 3w1,1(1−α)p21,1,t+ (1−(1−α)w1,1)p1,1,t
which has the equilibrium set (most easily seen from the second-to last form)
with solutions (assumingw1,1 6= 0)
p∗1,1,1= 0 p
∗
1,1,2= 1 p
∗
1,1,3= 0.5
and stability conditions following from the system’s eigenvalue λ(linearized for the equilibria) with the equilibrium being stable if, and only if,|λ|<1.
λ= ∂p1,1,t+1(p1,1,t) ∂p1,1,t
=−6w1,1(1−α)p 2
1,1,t+ 6w1,1(1−α)p1,1,t+ (1−(1−α)w1,1),
thus
λ(p∗
1,1,1) =λ(0) = (1−(1−α)w1,1
λ(p∗
1,1,2) =λ(1) = (1−(1−α)w1,1
λ(p∗1,1,3) =λ(0.5) = 1
2(1−α)w1,1+ 1.
The first two equilibria are thus stable ifw1,1is small enough in comparison toα,15specifically if 2>(1−α)w1,1. These
are the monopolization equilibria. The third equilibrium, the tipping point, is never stable. An equilibrium and stabil-ity analysis for the continuous form of the system for specific numerical examples with non-vanishing inter-segmental compatibility matrix (but vanishing intra-segmental compatibility term) is conducted in Heinrich [Heinrich, 2014] with very similar results (i.e. stable monopolization equilibria but unstable tipping point equilibrium).
15Ifw1
,1is too large, the discrete system is not an adequate discretization to the continuous system from which it is derived