Critical Estimation of Relaxation Coefficient in TDGL Equation
Based on Path Probability Method
Munekazu Ohno
1;*and Tetsuo Mohri
2 1Institute of Metallurgy, Clausthal University of Technology, D-38678, Clausthal-Zellerfeld, Germany 2Division of Materials Science and Engineering, Graduate School of Engineering,
Hokkaido University, Sapporo 060-8628, Japan
A hybrid scheme of Cluster Variation Method (CVM) combined with Phase Field Method (PFM) is applied to multiscale analysis of disorder-B2 transition. By comparing the relaxation curves of Long-Range-Order (LRO) parameter obtained by the present hybrid model and by Path Probability Method (PPM), a critical estimation of the relaxation constant which determines the time scale of the temporal evolution process of microstructure is attempted for B2 ordering process. It is found that both the LRO relaxation curves are well described within the autocatalytic reaction model of chemical species. That both curves coincide satisfactorily assures the existence of a scaling property between PFM and PPM. Finally, microstructural evolution process is simulated within Time Dependent Ginzburg Landau equation.
[doi:10.2320/matertrans.47.2718]
(Received May 23, 2006; Accepted July 12, 2006; Published November 15, 2006)
Keywords: time dependent ginzburg landau equation, cluster variation method, path probability method, disorder-B2 transition, autocatalytic reaction
1. Introduction
Macroscopic properties of an ordered alloy such as mechanical, electrical and magnetic properties are dependent on non-equilibrium microstructure, and prediction of micro-structural evolution/devolution process is one of the most important subjects in materials science. The elementary process of microstructural evolution is ascribed to an atomic jump process on a discrete lattice, however incorporating the wide range of time scales covering atomistic and micro-structural processes in a single theoretical framework is not at all an easy task. And an interplay between atomistic and microstructural kinetics has not been fully addressed in most of theoretical works.
Phase Field Method (hereafter PFM)1,2)has been attracting
broad attentions as a powerful tool to describe temporal evolution/devolution processes of microstructure. The PFM consists of Cahn-Hilliard diffusion equation3) and
Time-Dependent Ginzburg-Landau (TDGL) equation.4)When the long range diffusion is negligible, the non-equilibrium evolution process is described only by the following TDGL equation,
@i @t ¼
X
j Lij
F j
; ð1Þ
whereiis a non-conserved field variable,Lijis a relaxation
constant which determines the time scale of the phenomenon andFis the free energy for the non-uniform system. Within the PFM, the microstructure is effectively characterized by the non-uniform distributions of field variables, {i}, which
constitute the free energy, F. Hence, by suitably defining both the free energy and field variable(s), one is capable of describing kinetic evolution process of various microstruc-tures1,2) from a given initial non-equilibrium state to a final equilibrium state. In most of the conventional PFM
calcu-lations, however, detailed information of atomic behavior is not explicitly dealt with, since the PFM assumes a continuum medium in which atomistic information is averaged out over the discrete lattice points.
In order to perform multiscale analysis of the ordering process from the atomistic to microstructural levels, we have attempted a hybridization of the PFM with Cluster Variation Method (CVM)5) which has been recognized as one of the most reliable atomistic models to predict phase equilibrium under a given set of atomic interaction energies. A key to the CVM is that a wide range of atomic correlations is explicitly considered in the free energy functional through a set of configurational variables. The hybrid model was applied to disorder-B26,7) and disorder-L1
07,8) transitions, and the
microstructural evolution process covering atomistic order-ing, wetting phenomena at an anti-phase boundary (APB) and growth and coalescence processes of ordered domains are successfully analyzed and predicted.8) Furthermore, it is
noteworthy that the hybrid model opens up an possibility of carrying out the first-principles calculation of microstructural evolution process by incorporating the electronic structure total energy calculations, and a preliminary attempt was recently demonstrated for the disorder-L10 transition in
Fe-Pd system.9–11)
As mentioned, within the PFM, the relaxation constants in the TDGL equation determine the time scale of the evolution/devolution process. For multiscale analysis cover-ing from atomistic to microstructural scales, the elementary step of the kinetic evolution is an atomic jump process. Therefore, in order to determine the time scales involved in the TDGL equation uniquely, the information of the atomic jump process is necessary. In the previous hybrid calculations, however, the relaxation constants are left as arbitrary parameters and no serious efforts to assign the relaxation constants based on atomistic information have been attempted.
Path Probability Method (PPM)12–14) is regarded as a natural extension of the CVM to time domain and describes
*Present address; Research Center for Integrated Quantum Electronics
(RCIQE), Hokkaido University, Sapporo 060-8628, Japan
the atomistic kinetic process by taking the wide range of atomic correlations into account. In our previous studies,6,7)it
was demonstrated that the hybrid model provides a relaxation curve of Long-Range-Order (LRO) parameter which is nearly isomorphic to the one calculated by PPM when particular values are assigned to the relaxation constants. However, the time scales of resultant LRO curves obtained by both the methods differ with each other. Hence, for a fully justified determination of the relaxation constants, a scaling parameter coordinating the time scales of PFM and PPM is of utmost importance. In the present study, we reattempt to determine the relaxation constants which are to be incorpo-rated into the hybrid model. For this, both the relaxation curves of the LRO obtained by the hybrid model and the PPM are fitted into a function which has been employed to describe an autocatalytic reaction. The actual procedure is presented in the third section. The obtained relaxation constants are employed to calculate the microstructural evolution process in the two dimensional space. The main focus of the present study is placed on the disorder-B2 transition at a fixed 1:1 stoichiometric composition. The calculation procedure is summarized in the next section and the results and discussion are presented in the third section followed by conclusion in the last section.
2. Calculation Method
2.1 Hybrid model of CVM and PFM
The detailed formulation of the present hybrid model is beyond the scope of this report. In the following, we simply provide important formulas necessary for the present study.
Within the PFM, the non-uniform chemical free energy is constituted by the free energy density for local uniform system and the gradient energy term which corresponds to the excess free energy contribution due to the non-uniformity of the field variables. In the present hybrid model, the CVM free energy is adopted as the free energy density of the local uniform system and the non-uniformities of the Short-Range-Order (SRO) as well as those of the LRO and the concentration are taken into account through the gradient energy terms. For disorder-B2 transition, we employ the pair approximation in the CVM and, then, the non-uniform free energy is given as,6,7)
Fchem¼ Z
ðfCVM½c; 1; 2 þcðrcÞ2
þ1 ðr1Þ2þ2 ðr2Þ2ÞdV; ð2Þ
where fCVM½c; 1; 2 is the CVM free energy for the local
uniform system, which is a function of the concentration,c, the LRO,1, and the SRO,2. fCVM is given as,
fCVM¼4N
X
ij eijy
ij NkBT
7
2
X
i
ðxi lnxi þxi lnxiÞ 4X ij
yij lnyij !
; ð3Þ
where N is number of lattice points, eij is the atomic
interaction energy for i-j pair cluster, kB the Boltzmann
constant, T the absolute temperature. xki and yij are the cluster probabilities of finding atomic configuration denoted
by subscript(s) on the point and pair clusters, respectively.
and of the superscript distinguish the sublattice for B2 ordered structure andþ1 and1 are assigned toiand jto specify A and B atoms, respectively. The concentration and the LRO parameter in eq. (2) are given in terms of the point cluster probabilities as c¼ ðx
1 þx
1Þ=2 and 1¼x1x
1,
respectively, and the SRO parameter,2, corresponds to the
pair correlation function.15)
In eq. (2), rc,r1 andr2 represent the spatial
deriva-tives of concentration, LRO and SRO, respectively and these terms correspond to gradient energy term.c,1 and2are
the gradient energy coefficient forc,1and2, which controls
the spatial scale and the morphology of the microstructure. In the present calculation, the gradient energy coefficients are assumed to be constant. The microscopic derivation of the gradient energy coefficient based on the CVM is presented elsewhere.16)
As mentioned in the introduction, the PFM is formally constructed by both Cahn-Hilliard equation for conserved variables such as concentration and TDGL equation for the LRO and SRO parameters. Our main concern in the present study is the configurational evolution manifested by the LRO parameter at a fixed composition of 1:1 stoichiometry. Hence, the temporal and spatial evolutions of the concen-tration are not taken into account and Cahn-Hilliard equation is neglected. The time evolutions of correlation functions are described by the following set of TDGL equations,
@1
@t ¼ L1 @fCVM
@1
21r21
; ð4Þ
@2
@t ¼ L2 @fCVM
@2
22r22
; ð5Þ
where L1 andL2, which are the main focus of the present
study, are the relaxation constants for the LRO and the SRO parameters, respectively, and both the relaxation constants determine the time scale of the ordering process in the PFM calculation.
It should be noted that the kinetic evolution within the TDGL equation is based on the principle that the evolution/ devolution rate of a field variable is proportional to the gradient of the free energy, which is rationalized only in the near-equilibrium regime.
2.2 Path probability method
The PPM formula depends on the type of elementary process of transition adopted in the study. In an alloy system, atomic migration takes place mostly by vacancy-mediated mechanism. In the present study, however, we deal with a simpler spin flipping kinetics (Glauber dynamics17)). It is
noted that the spin flipping kinetics generally does not conserve the species with time, however the conservation is assured at 1:1 stoichiometric composition without imposing any additional constraints. In this regard, the spin kinetics at 1:1 stoichiometry can be regarded as the first approximation to an alloy system.14) Our focus is placed on the binary system in which A and B atoms have one-to-one corre-spondence to up and down spins, respectively.
correlates the cluster probabilities at timetandtþtas are exemplified for the following point path variables12)
x1ðtÞ ¼X1;1ðt;tþtÞ þX1;11ðt;tþtÞ; ð6Þ
and
x1ðtþtÞ ¼X1;1ðt;tþtÞ þX11;1ðt;tþtÞ; ð7Þ
whereXi;jðt;tþtÞis the point path variable of describing
the configurational transition on a lattice point fromiat timet
to jattþt.
By using path variables, a Path Probability Function, P, which corresponds to a free energy in the CVM, is written as the product of three terms,P1,P2andP3. Each term for the
disorder-B2 transition is given in the following logarithmic expression,
lnP1¼ ðN=2Þ
ðX1;11þX11;1þX
1;11þX
11;1Þ lnðtÞ
þ ðX1;1þX11;11þX1;1þX
11;11Þ lnð1tÞ
; ð8Þ
lnP2¼
E
2kBT
; ð9Þ
lnP3¼N
7 2
X
ij
ðXi;jlnXi;jþXi;jlnXi;jÞ
4X
ijkl
Yij;kllnYij;kl
; ð10Þ
whereYij;klis the path variable for a pair cluster,the spin flipping probability per unit time which corresponds to the diffusivity in an alloy system and E is the change of the internal energy duringt.P1given by eq. (8) represents the
statistical average of individual events of spin flipping over the whole system and P2 given by eq. (9) describes the
conventional thermal activation process. The characteristic of the PPM isP3which counts the freedom of paths from one
configuration to another one. In eq. (10), the pair approx-imation is employed in order to keep the consistency between the CVM and PPM calculations. It is noteworthy that the free energy and/or its derivative are not explicitly considered in the path probability function.
The most probable path of time evolution is determined by maximizing path probability function with respect to a set of path variables, which is equivalent to the minimization condition of the free energy in the CVM. By optimizing the path variables for each time step, the cluster probability at time tþt is uniquely determined with the knowledge of cluster probabilities at timet. Such a relation is exemplified in the following,
x1ðtþtÞ ¼x1ðtÞ þX11;1ðtþtÞ X1;11ðt;tþtÞ; ð11Þ which is readily obtained from eqs. (6) and (7). Hence, once the initial equilibrium state is calculated by the CVM, non-equilibrium process is described by the PPM. Moreover, it has been demonstrated that the final equilibrium state predicted by the PPM at t! 1 agrees with the one independently calculated by the CVM.
3. Results and Discussion
3.1 Equilibrium state
By minimizing the CVM free energy given by eq. (3), the
transition temperature at 1:1 stoichiometry is calculated to be
T ¼1:739.7)The temperature is normalized byk
B=v2, where
v2ð¼e11þe11112e111Þis the nearest neighbor effective pair
interaction energy,7)and this convention is held throughout
the present study. The main focus of the present study is placed on the disorder-B2 transition at a fixed 1:1 stoichio-metric composition during aging operation at T ¼1:0
quenched fromT ¼2:0.
In the following, we compare the B2 ordering behavior described by PPM and the hybrid model in the homogeneous limit, and we attempt to determine the relaxation constant by assuming an existence of scaling property between both the methods. For this, the gradient energy contribution in the TDGL equations (4) and (5) is firstly neglected. By employ-ing the obtained relaxation coefficient, two-dimensional calculation for non-uniform system is conducted to examine the microstructural evolution process. It is pointed out that the transition proceeds without fluctuation since the disorder-B2 transition is of the second order.
3.2 Ordering process in a uniform system
Within the PPM, the kinetics of the spin system is entirely determined by the spin flipping probability once the initial equilibrium state is assigned by the CVM, and the relaxation behavior of LRO and SRO are uniquely described. The relaxation curves of LRO and SRO during aging operation at
T ¼1:0are shown in Figs. 1(a) and (b), respectively.6)The aging time,tPPM, is normalized as tPPM¼t. One sees that
the ordering process spontaneously proceeds without fluctu-ation and the cooperative relaxfluctu-ation process between the LRO and SRO takes place, following the preceding relax-ation of the SRO in the initial period. The system finally attains the steady state which is confirmed to be the equilibrium state at T ¼1:0 independently calculated by the CVM.
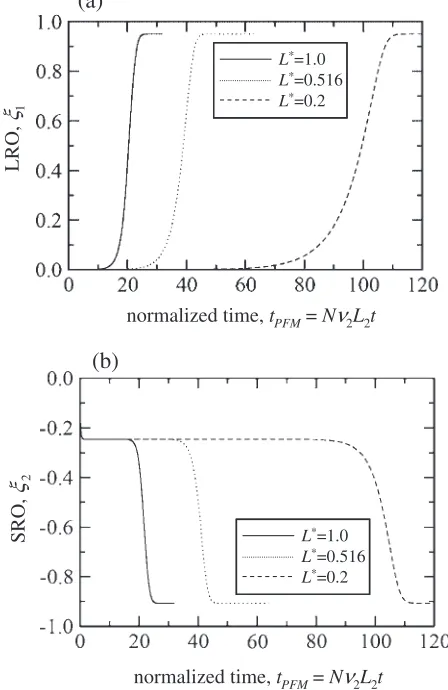
In the PFM calculation, the ordering behavior depends on both the relaxation constants, L1 and L2. Shown in Fig. 2
are the relaxation curves calculated by the PFM with
Lð¼L
1=L2Þ ¼1:0, 0.516 and 0.2. The time axis is
normal-ized with respect to tPFM¼Nv2L2t. One can see that the
onset and the speed of the relaxation are quite different, depending on the value of L. However, in all cases, the
transition spontaneously proceeds without fluctuation and the system attains the same steady state which is confirmed to be the equilibrium one calculated by the CVM and, also, the ordering behavior characterized by the three distinctive stages are quite similar to the one obtained by the PPM. In spite of the difference between the underlying kinetic principles, an existence of scaling property between two models is suggestive. In the following, we attempt to determine the relaxation constant,L, based on the
assump-tion that there exists a scaling property between both the models. For this, our focus is directed only to the temporal profile of LRO.
3.3 Determination of relaxation constant
ðtÞ ¼e
2 1þtanh
tth
; ð12Þ
whereðtÞis the LRO which is a function of aging time,t,e
the equilibrium value of the LRO,th the time at which¼ e=2is attained andis a fitting parameter. By using the least
square method, the fitting parameter for the relaxation curve of the PPM shown in Fig. 1(a), PPM, is calculated as PPM¼1:325. Demonstrated in Fig. 3 are the comparison
between the original relaxation curve (Fig. 1(a)) and the fitted one withPPM¼1:325.
The physical implications of eq. (12) is discussed at this point. First, we consider a chemical reaction in which a chemical species,X, encounters another species,A, yielding two molecules of X. This irreversible chemical reaction is represented by the following reaction formula,
AþX!k1 2X; ð13Þ
where k1 is a rate constant, and the temporal change of
concentration ofX,xðtÞ, is given as
dx
dt ¼k1ðaxÞ x; ð14Þ
wherea is an initial concentration of A. This rate equation represents a typical autocatalytic reaction.18)It is realized that the derivative of eq. (12) with respect to aging time,t,
dðtÞ dt ¼
2 1
ðtÞ
e
ðtÞ; ð15Þ
is mathematically isomorphic with eq. (14). Hence, the relaxation kinetics characterized by eq. (12) can be inter-preted in the mold of such an autocatalytic reaction in the following manner.19)
In the system consisting ofN’s atoms, the number of the
L*=1.0 L*=0.516 L*=0.2
normalized time, tPFM= N
ν
2L2tLRO,
ξ
1L*=1.0 L*=0.516 L*=0.2 L*=1.0 L*=0.516 L*=0.2
(a)
L*=1.0
L*=0.516
L*=0.2
SRO,
ξ
2(b)
normalized time, tPFM= N
ν
2L2tL*=1.0
L*=0.516
L*=0.2
L*=1.0
L*=0.516
L*=0.2
Fig. 2 Time evolution processes of LRO (a) and SRO (b) calculated by PFM with different values ofL. Aging time is normalized ast0¼Nv
2L2t.
normalized time, tPPM=
θ
tLRO,
ξ
1PPM
Fitting function
Fig. 3 Relaxation curve of LRO calculated by PPM and fitting function given by eq. (17) withPPM¼1:325.
normalized time, tPPM
LRO,
ξ1
SRO,
ξ2
(a)
normalized time, tPPM=
(b)
t
θ
=θ
t [image:4.595.58.288.73.429.2] [image:4.595.314.538.80.425.2] [image:4.595.314.539.478.642.2]atoms contributing to the LRO at equilibrium state is represented by Ne which corresponds to the number of
atoms belonging to an ordered configuration. During the relaxation process towards an ordered state, a disordered region is invaded by an ordered region until the final equilibrium is attained. In an atomistic picture, this process is described as the collision process of an atom belonging to the disordered configuration (disordered species) with the one in the ordered configuration (ordered species) to be converted to an ordered species. Supposing that such a collision process is biased or stimulated by the existence of an ordered species, the transformation kinetics is regarded as autocatalytic and is represented by eq. (15). By regarding the disordered (or-dered) species as chemical species, AðXÞ, one can make an analogy between the chemical and ordering processes. Hence, the comparison between eqs. (14) and (15) yields the following relation,
k1¼ 2
Ne
; ð16Þ
and the parameter can be interpreted as the rate constant (relaxation time). In fact, a conventional transformation kinetics which is driven by the reduction of free energy is more or less autocatalytic. Both the shortage of the catalysis (Xor ordered species) at the initial stage of the reaction and the lacking of the driving force in the final stage near equilibrium state cause slow kinetics and the maximum velocity is attained in the middle stage.
It is noted that in the curve given by the function ðtÞin eq. (12), variation of th shifts the entire curves in the
horizontal direction, while controls the inclination. The fitting of the relaxation curves for L¼1:0, 0.516 and 0.2
shown in Fig. 2 into eq. (12) yieldsPFM¼2:486, 4.075 and
9.223, respectively. Noting that the time axestPFM(Fig. 2(a))
andtPPM(Fig. 1(a)) are defined in the different scales and are
related through,
tPPM¼ntPFM; ð17Þ
wherenis given as
n¼
Nv2L2
; ð18Þ
the correction is attempted for the relaxation times, PFM,
obtained above in the following way. We first note th in
eq. (12) obeys the same scaling relation as eq. (17) and the following relation is held,
th;PPM¼nth;PFM; ð19Þ
whereth;PPMandth;PFMrepresentthfor the relaxation curves
calculated by the PPM and PFM, respectively. If there exists a scaling property between the relaxation curves of the PPM and PFM, the same scaling relation should hold for the relaxation time,, which claims the following equation
PPM¼nPFM¼ th;PPM th;PFM
PFM: ð20Þ
For three curves in Fig. 2, nPFM¼ ðth;PPM=th;PFMÞ PFM is
calculated andnPFM¼1:545, 1.325 and 1.172 are obtained
forL¼1:0, 0.516 and 0.2, respectively. By comparing these values withPPM¼1:325, one can conclude that the scaling
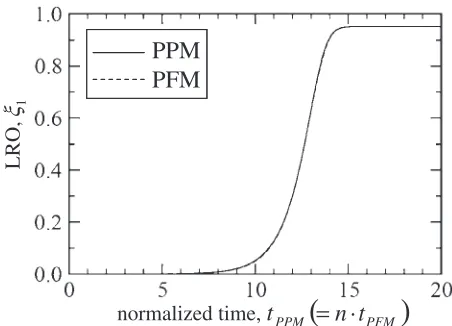
property between the PFM and PPM is assured when 0.516 is assigned toL. In fact, the relaxation curve calculated by the
PFM withL ¼0:516is compared with the one obtained by
PPM in Fig. 4 where the time axis is normalized by
t0
PFM¼nNv2L2tð¼tPPMÞ, and perfect coincidence is
con-firmed.
It should be pointed out that in the present discussion, only the relaxation behavior of LRO is focused. However, the SRO kinetics plays the significant role in the ordering transition.20,21)As shown in Fig. 1, the preceding relaxation of the SRO takes place in the early period, followed by the cooperative relaxation of LRO and SRO. Hence, the relaxation behavior of the SRO cannot simply be described by eq. (12) and, a more proper chemical reaction model and fitting function are necessary to extend the present approach to the SRO relaxation process. A unified analysis including the relaxation process of the SRO remains as a future work.
3.4 Microstructural process in non-uniform system
In the calculation of the microstructure, the system is partitioned into small regions which consist of a number of unit cells and each small region is regarded as the local uniform system. A set of values of 1 and2, is defined at
each small region and, then, the microstructure is charac-terized by the spatial distributions of1and2. In the actual
computation, the system is discretized into a number of grid points, each of which represents the local uniform system.
We employ a two-dimensional space discretized into
200200’s grid points to calculate the microstructural evolution process during the disorder-B2 transition. It should be noted that each grid point,i.e., the local uniform system consists of a number of unit cells (bcc in this study) as mentioned above and, hence, the thermodynamic quantities at each grid point are the one for three-dimensional lattice system, while only two-dimensional non-uniformity of such quantities are focused in the present simulation. The initial condition is assigned by distributing random values of LRO close to 0 to each grid point. Then, the initial value of SRO is calculated so that the CVM free energy at T ¼2:0 is minimized with respect to the SRO under a given value of LRO.
LRO,
ξ
1normalized time,
t
PPM(
=
n
·
t
PFM)
PPM
PFM
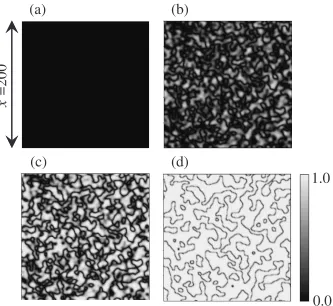
[image:5.595.312.538.72.235.2]The microstructural evolution process during aging oper-ation at T¼1:0 is demonstrated in Fig. 5. These micro-structures are visualized by gray levels representing different square values of the LRO, which corresponds to a dark field image of transmission electron microscopy. Dark and bright regions correspond to a disordered phase or the APB and the B2 ordered phase, respectively. In these microstructure, the spatial scale is indicated and is normalized as x0¼
xðNv2=ð21ÞÞ1=2. One sees that the ordered domains are
formed from the disordered matrix in the early period and the entire system transforms to the ordered phase separated by the APB. In the resultant microstructure, the morphology of the APB is isotropic and a triple junction of the APB is not observed. Such microstructural features are qualitatively in agreement with those observed, for instance, in -Fe(bcc)! FeAl(B2)22,23)in which elastic effects on
micro-structural feature are insignificant.
Shown in Fig. 6 is the evolution process of SRO. By comparing these snapshots with those of Fig. 5, it can be realized that the non-uniformities of SRO cooperatively develop with those of the LRO and, in the later period, the SRO takes a high value in regions where the APB exists in the microstructure of Fig. 5. As demonstrated here, the hybrid model enables one to carry out the detailed analysis on the temporal evolution process of not only LRO but also SRO once a proper value is assigned to the relaxation constant.
4. Conclusion
In the present work, focusing on the disorder-B2 transition, we compared the temporal profiles of LRO obtained by the PPM and the hybrid model of the CVM and the PFM. It was demonstrated that both the profiles of PPM and PFM can be well described in the mold of autocatalytic kinetics. Then, by introducing the scaling parameter coordinating the time scales for the PFM and PPM calculations, we determined the values of the relaxation constants. The resultant relaxation curve of the LRO provides nearly the perfect coincidence with the one calculated by the PPM. By using the obtained relaxation constant, moreover, we performed two-dimen-sional calculation to examine the formation process of APB structure.
As mentioned in the introduction, the present hybrid model can be applied to the first-principles investigation on microstructural evolution process in combination with the electronic structure total energy calculations. In our pre-liminary attempt of the first-principles calculation,9–11) the
quantitative description of the spatial scale is successfully achieved, while time scale is not explicitly specified. For quantitative description of time scale, it is necessary to determine the relaxation constant based on the atomistic model and the present results will contribute to develop a general framework to derive the relaxation constant from the PPM.
(a)
(b)
(c)
(d)
0.0
1.0
x’
=200
[image:6.595.135.468.73.379.2]Acknowledgement
The present work was supported by a financial assistance of engineering research from the foundation ‘‘Hattori-Hokokai’’ and by Grant-in-Aid for Scientific Research from Ministry of Education, Culture, Sports, Science and Tech-nology.
REFERENCES
1) L. Q. Chen: Annu. Rev. Mater. Res.32(2002) 113–140.
2) A. Karma: Encyclopedia of Materials Science and Technology (Elsevier Oxford, 2001) 6873–6886.
3) J. W. Cahn and J. E. Hilliard: J. Chem. Phys.28(1958) 258–267. 4) D. Fan and L. Q. Chen: Acta mater.45(1997) 3297–3310. 5) R. Kikuchi: Phys. Rev.81(1951) 988–1003.
6) M. Ohno and T. Mohri: Mater. Sci. Eng. A312(2001) 50–56. 7) M. Ohno and T. Mohri: Complex Inorganic Solids,—Structural
Stability and Magnetic Properties of Alloys—, ed. by P. E. A. Turchi et al., (Springer, 2005), 187–202.
8) M. Ohno and T. Mohri: Phil. Mag.83(2003) 315–328.
9) T. Mohri, M. Ohno and Y. Chen: Mater. Sci. Forum457–479(2005) 3075–3080.
10) T. Mohri, M. Ohno and Y. Chen: J. Phase Equilibria and Diffusion27 (2006) 47–53.
11) T. Mohri:The Science of Complex Alloy Phases, ed. by T. B. Massalski and E. A. Turchi, (The Minerals, Metals & Materials Society, 2005) 109–145.
12) R. Kikuchi: Prog. Theor. Phys. Suppl.35(1966) 1–64.
13) K. Gschwend, H. Sato and R. Kikuchi: J. Chem. Phys.69(1978) 5006– 5019.
14) T. Mohri: Modeling Simul. Mater. Sci. Eng.8(2000) 239–249. 15) J. M. Sanchez and D. de Fontaine: Phys. Rev. B17(1978) 2926–2936. 16) M. Ohno and T. Mohri (in preparation).
17) R. J. Glauber: J. Math. Phys.4(1963) 294–307.
18) K. Kitahara and K. Yoshikawa:Hiheikoukei no Kagaku(Kodansya Co. Ltd., 1994) in Japanese.
19) M. Ohno and T. Mohri: Proceedings of the 15th International Symposium on Transport Phenomena (2004) 420–425.
20) C. Dimitrov, X. Zhang and O. Dimitrov: Acta mater.44(1996) 1691– 1699.
21) P. Vennegues, M. C. Cadeville, V. Pierron-Bohnes and M. Afyouni: Acta mater.38(1990) 2199–2213.
22) P. R. Swann, W. R. Duff and R. M. Fisher: Metall. Trans.3(1972) 409– 419.
23) D. G. Morris, M. Leboeuf, S. Gunther and M. Nazmy: Phil. Mag. A70 (1994) 1067–1090.
(a)
(b)
(c)
(d)
-0.11
-0.91
x’
=200
Fig. 6 Temporal evolution process of SRO during disorder-B2 transition which corresponds to the one shown in Fig. 5. These snapshots are visualized by gray level representing different values of the SRO. (a) ntPFM¼1:0, (b) ntPFM¼7:5, (c) ntPFM¼8:5 and
[image:7.595.134.465.74.364.2]