Influence of Load Dependency and Coating Anisotropy on Calculated
Young’s Modulus of TBCs by Indentation Test
Motofumi Ohki
1, Tatsuya Ishibashi
1and Jun Kinoshita
1;* 1Department of Materials Science and Technology, Faculty of Engineering, Niigata University, Niigata 950-2181, Japan
Thermal Barrier Coatings (TBCs) are developed as a method for increasing the operation gas temperature of gas turbines for electric power stations, and recently they are applied to 1500C class gas turbines. On the other hand, they have been reported that the repetition of thermal stress caused by a difference in the thermal expansion coefficient between thermal barrier ceramic layer and metallic layer in TBCs promotes coating damage. Therefore, understanding the accurate value of top-coat (TC) Young’s modulus that can estimate the extent of generated thermal stress is necessary to ensure material reliability. However, because TBCs are formed as a composite material of combined thin layer coatings, the essential problem that TBCs can’t apply to general materials estimation experiment is obvious.
We have studied the estimation of TC Young’s modulus by using indentation hardness tests. In the former paper, we reported that the calculated TC Young’s modulus for TBCs specimens depends on the indentation load. Therefore, we first discuss such dependency in the present paper. As a result, we clearly show that the reason for the load dependency of the calculated TC Young’s modulus below 147 N of indentation load is the effect of under-coat (UC) and calculating TC Young’s modulus by using this procedure can eliminate the UC effect until an indentation load of 9.8 N. In addition, we examine the fracture behavior of TC following the indentation process and discuss the reason why does calculated TC Young’s modulus decrease above 147 N.
We also discuss the influence of TC anisotropy on calculated TC Young’s modulus, and then we confirm that the influence of TC anisotropy rarely appears using this procedure.
(Received September 2, 2005; Accepted January 31, 2006; Published April 15, 2006)
Keywords: thermal barrier coating, indentation hardness test, top-coat Young’s modulus, finite element analysis, acoustic emission measurement
1. Introduction
In view of the terrestrial environment and energy con-sumption, operation gas temperature elevation of gas turbines for electric power stations is required. As the key technology to achieve this, adding Thermal Barrier Coatings (TBCs) to blade metallic components has been a common procedure. Generally, TBCs consist of under-coat (UC) and top-coat (TC). UC (usually MCrAlY alloy is selected) prevents both oxidation and erosion of metallic substrate, and also main-tains adhesion between TC and substrate. TC (usually a low thermal conductivity ceramic is selected) has a thermal barrier property. By combining with TBCs and internal blade cooling, substrate temperature becomes about 100C lower
and operation gas temperature can be elevated.1)
On the other hand, the repetition of thermal stress caused by difference in the thermal expansion coefficient between ceramic TC and metallic UC/substrate promotes coating damage.2) Therefore, understanding the accurate value of top-coat (TC) Young’s modulus that can estimate the extent of generated thermal stress is necessary to ensure material reliability. However, because TBCs are formed as a compo-site material of combined thin layer coatings, the essential problem that TBCs can’t apply to general materials estima-tion experiment is obvious. Furthermore, occurrence of TC densification (decreasing TC porosity) with long time high temperature exposure is also reported,3) changing TC
Young’s modulus compared with modulus when gas turbines started operation. Therefore, simple, quick, accurate, and non-destructive measurement of TC Young’s modulus is needed, but such measurement is not established yet.
The indentation hardness test is one of non-destructive material tests. It is studied by a number of researchers
including us over wide range from theoretical discussion of the indentation process4)to practical application.5)Recently, nanoindentation measuring the indentation load and displace-ment during the indentation process for a very low load level has been developed. It can estimate some material properties that can’t be estimated by conventional hardness tests, such as Young’s modulus and yield stress. As it also can test simply and quickly, it seems appropriate for the method of TC Young’s modulus measurement.
We have studied estimating TC Young’s modulus by using the indentation hardness test. In the former paper,6) we
reported that the calculated TC Young’s modulus for TBCs specimen increases with the indentation load increasing below 147 N, while it begins to decrease above 147 N. We suggested that the phenomena are caused by the presence of UC and the fracture of TC. In the present paper, we first discuss the influence of such load dependency on calculated TC Young’s modulus in detail, using a FEM analysis and an acoustic emission sensor.
Furthermore, it have been reported by a number of researcher that some mechanical properties of TBCs, such as Young’s modulus, indicate anisotropy. Thus, we also discuss the influence of TC anisotropy on calculated TC Young’s modulus.
2. Experimental Procedures
2.1 Specimens
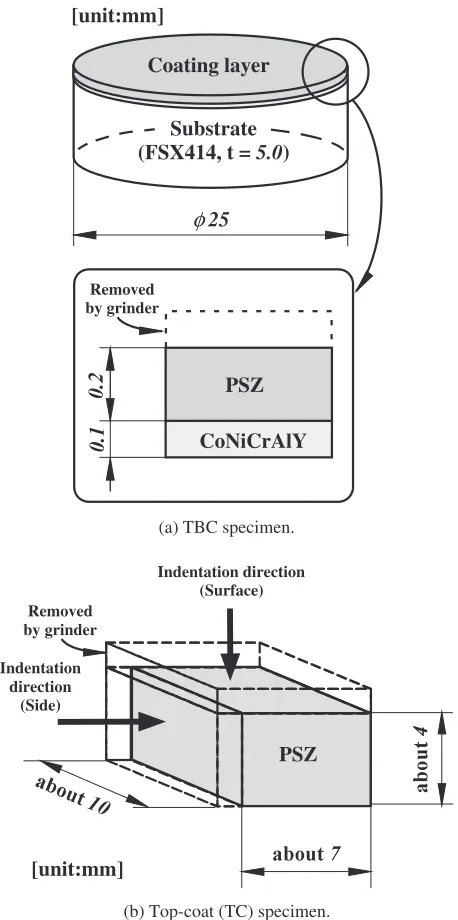
We prepared two kinds of specimens to discuss the influence of load dependency and TC anisotropy on calcu-lated TC Young’s modulus. Figure 1(a) shows the geometry and shape of general TBCs specimen used in the discussion about the influence of load dependency (after this, this specimen is referred to as a TBC specimen). In this specimen, Co-base super alloy FSX414 was used as substrate,
CoN-*Graduate Student, Niigata University
iCrAlY alloy as UC and 7 mass%Y2O3 partially stabilized ZrO2 (PSZ) as TC. The chemical composition of each element used in the specimen is shown in Table 1, and the spray condition in Table 2. Since as-sprayed specimens had some surface roughness caused by random deposition of splats, we ground specimen surface about 0.1 mm to avoid the effect of surface roughness.
To discuss the influence of both load dependency and TC anisotropy, we prepared free-standing top-coat specimens that were sprayed thickly until there was about 5 mm on the substrate. Then the substrate was removed chemically (after this, this specimen is referred to as a TC specimen). Both top and side surfaces of such TC specimen were ground, and then indentation tests were carried out on each surface. Figure 1(b) shows the geometry and shape of a TC specimen. The chemical composition and spray condition were the same as the TBC specimen.
2.2 Indentation tester
In the present paper, we used a mechanically-driving indentation tester developed in our laboratory. Schematic illustration of the tester is shown in Fig. 2. The spectacle shape component (material: brass for low loads and steel for high loads) with sticking strain gages was used as the load-cell. The bridge circuit was constructed with a bridge box and the load-cell, and this circuit was connected to the strain amplifier (Shinkoh DAS-406). As displacement measure-ment instrumeasure-ments, we used a linear proximity sensor (OMRON E2CA-X1R5A) with an amplifier unit (E2CA-AN4C). The resolution of this system was 0.6mm. To calibrate the inclination of the specimen table, four sensors were equipped at the ends of the specimen table, and displacement data from them were averaged. Indentation load and displacement data were inputted in a personal computer (PC) via an analog/digital transformer board inserted in the PC slot. The PC also controlled the tester movement. Other features of the tester were that the indenter was driven by mechanical elements with high reliability (stepping motor and ball screw, minimum displacement: 40 nm), and various types of indenters such as pyramidal, conical, and spherical, could be applied by using the holder.
Indentation loads were 98, 147, 294, 441 N (10, 15, 30, 45 kgf) for discussion term a), and 4.9, 9.8, 29.4, 49, 98, 147 N (0.5, 1, 3, 5, 10, 15 kgf) for the discussion terms b) and c). Indentations were carried out five times for all indentation loads.
2.3 Indenter
Another researcher reported that the results of indentation for TBCs top-coat, which has a porous body, were influenced by the indenter shape.7)
Namely, these were the results of indentation with a pyramidal indenter reflecting the property of a relatively small area. However, indentations with a conical or a spherical indenter, which has a relatively wide contact area compared with a pyramidal indenter, reflect the average property of a certain amount of area. The calculated TC Young’s modulus discussed in the present paper means Young’s modulus obtained from whole TC as an
accumu-PSZ
CoNiCrAlY
[image:2.595.55.284.72.532.2] [image:2.595.305.549.93.201.2] [image:2.595.305.549.230.277.2]Removed by grinder
[unit:mm]
φ
25 Coating layerSubstrate (FSX414, t =5.0)
(a) TBC specimen.
(b) Top-coat (TC) specimen.
[unit:mm]
Indentation direction (Surface)
PSZ
Indentation direction
(Side) Removed by grinder
Fig. 1 Geometry and shape of specimens used in this study.
Table 1 Chemical composition of materials used in this study.
(a) PSZ
SiO2 Al2O3 CaO Fe2O3 TiO2 MgO ZrO2 Y2O3
0.05 0.48 0.13 0.03 0.18 0.05 91.60 7.47
(b) CoNiCrAlY
Al C Co Cr Ni S Y O2 N2 H2 TaO
8.90 0.019 Bal. 21.42 32.84 <0:001 0.41 0.065 0.010 0.030 <0:4
(c) FSX-414
C Mn Si W Co Ni Cr B Fe
0.25 1.0 1.0 7.0 Bal. 10.5 29.5 0.012 <2:0
Table 2 Plasma spray conditions used in this study.
Power [kW]
Spray distance [mm]
Traverse speed
[mm/s] Environment
CoNiCrAlY 46.58 275 200 6.5 kPa (Ar gas)
lated body of PSZ particles, and not Young’s modulus obtained from only PSZ particle.
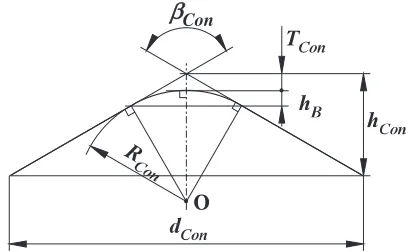
Therefore, it seems that a conical (or spherical) indenter is appropriate to use for such purposes. Then we chose a conical indenter for the Rockwell hardness test. Figure 3 indicates the indenter tip shape of a conical indenter. This indenter regulated tip angle Con and tip curvature radius RCon (tip
angleCon ¼119550, tip curvature radiusRCon ¼195mm),
so the truncation of tip TCon (difference between indenter
height for ideal shapehConand that for practical shape having
a tip curvature radius) was geometrically obtained, and it is shown in eq. (1).
TCon ¼RCon
1 sinðCon=2Þ
1
ð1Þ
Then, the relationship between the diameter of indenter bottom dCon and the indenter height for ideal shape hCon is
expressed in eq. (2).
dCon¼2hContan
Con
2
ð2Þ
2.4 Acoustic emission (AE) sensor
An acoustic emission (AE) sensor (AE901S, made by NF Corp.) was equipped on the indentation surface of the
specimen and connected to an AE tester (No. 9501, made by NF Corp.). AE output data was inputted into the PC, which also had the indentation load and displacement data input. By combining AE and indentation data, we could discuss the correlation between the indentation process and behavior of materials deformation and fractures.
2.5 Young’s modulus calculation theory
In the present paper, TC Young’s modulus was calculated by using the calculation theory of Young’s modulus with a conical indenter proposed by Amanoet al.8,9)The theory was described in detail in the former paper,6) so it is only described briefly here.
[image:3.595.323.527.75.201.2]Schematic illustration of the indentation load-displace-ment curve obtained from the indentation test is shown in Fig. 4. This figure suggests that it is necessary to consider the effect of the elastic deformation of the tester itself and the truncation of indenter’s tip. Thus, the true indentation depth
t f (¼tEþTCon) and the true elastic recovery r f
(¼tE) can be obtained.
From Hertz’s elastic contact theory,10)the relationship of
the indentation load LM, the contact diameter between the
indenter and specimen surfacedC, the true elastic recovery
r f and the elastic parameter between indenter and specimen FðEÞISis expressed in eq. (3).
LM¼
2
3
dCr f
FðEÞIS
ð3Þ
FðEÞISis expressed in eq. (4).
FðEÞIS¼
12
I EI
þ1
2
S ES
¼IðEÞ þSðEÞ ð4Þ
Here,I: Poison’s ratio of the indenter (¼0:07),EI: Young’s
modulus of the indenter (¼1140GPa),S: Poison’s ratio of
the specimen, ES: Young’s modulus of the specimen,IðEÞ:
the elastic parameter of the indenter, SðEÞ: the elastic parameter of the specimen.
In eq. (2),dConis replaced bydC, andhConis also replaced
by t f. Then eqs. (2) and (4) are substituted for eq. (3).
Finally, by rearrangement, calculation formula for Young’s modulus of the specimen ESðcÞ (note that suffix (c) means
calculated value) can be obtained.
ESðcÞ ¼ ð12SÞ
4
3pffiffiffi
K
0ðConÞt f r f
FðEÞIS
IðEÞ
ð5Þ
430
264
500
5 Phase Stepping motor
Reduction gear
Cross head Ball screw
and nut
Driving part of Indenter
Indenter
Measurement part Specimen
Front view Half sectional view
Fig. 2 Schematic illustration of mechanically-driving indentation tester.
β
Con [image:3.595.54.281.77.448.2]The elastic deformation of tester E is obtained by using
eq. (5) and practical test data recorded on HV500, which is the standard block for hardness tests and the specimen for calibration in this study because its properties are known (chemical composition and mechanical properties of HV500 are shown in Table 3).
2.6 Finite Element Method (FEM) stress analysis
[image:4.595.55.282.73.290.2]To discuss the distribution of strain in material during indentation, we carried out stress analysis with general Finite Element Method (FEM) analysis code MSC. Marc. The finite element model used in the present study is shown in Fig. 5. The element type was a two dimensional axisymmetric type with eight nodes, and the indenter was regarded as a rigid body. As boundary conditions, the nodes on the symmetric axis (in this analysis, x-axis was regarded as the symmetric axis) were restricted for horizontal displacement and nodes on the bottom surface were restricted for vertical displace-ment. To simplify the modeling of the indentation analysis on the TBC specimen surface using a conical indenter, it is regarded as elastic analysis. The analyzed area is limited until both 1 mm radius and 1.3 mm depth from indentation center. The critical condition to finish analysis is to reach an indenter displacement of 8 or 20mm in 10 steps. The materials properties used in the analysis are shown in Table 4.
3. Results and Discussion
3.1 Influence of load dependency on calculated TC
Young’s modulus above 147 N of indentation load
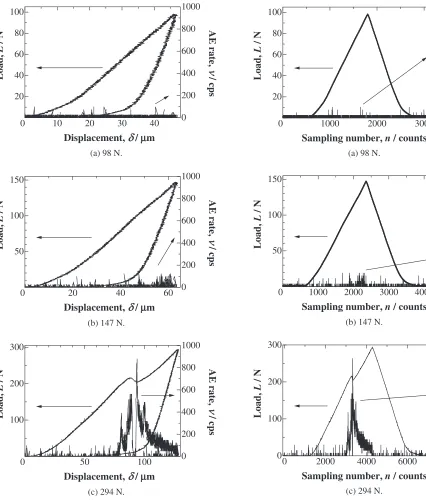
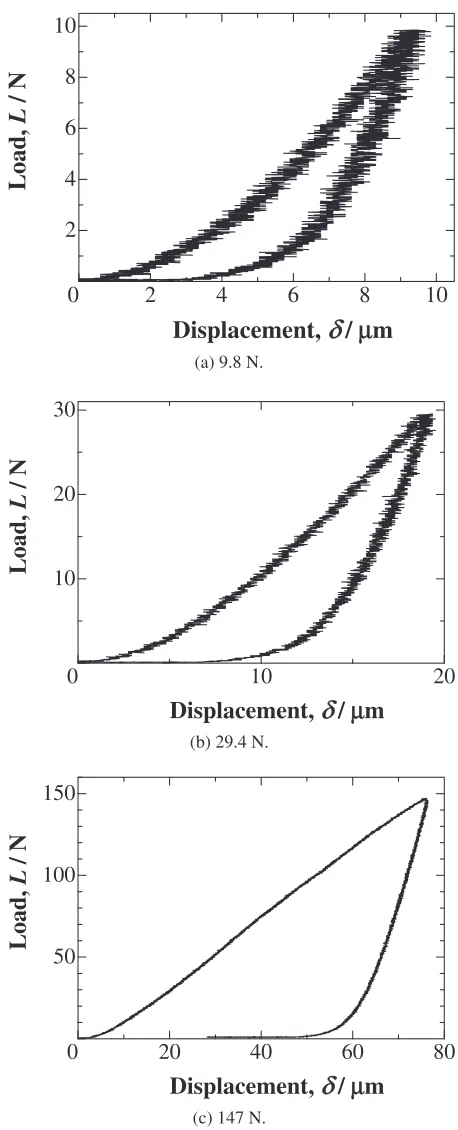
The indentation load, AE rate, and displacement curve at indentation loads 98, 147, and 294 N for the TBC specimen in Fig. 1(a) are shown in Figs. 6(a) to (c), and the indentation load, AE rate, and sampling number curve at indentation loads 98, 147, and 294 N for the TBC specimen in Fig. 1(a) are shown in Figs. 7(a) to (c), respectively (figures at indentation load 441 N are omitted due to limitations of space, and figures at indentation load 98 N are shown for reference). From these figures, the following facts were obvious: the load-displacement curve was smooth at 98 N and very few AE signals were generated; irregular behavior of the load-displacement curve and significant generation of the AE signals were recorded at 294 and 441 N. Irregular means a decreasing load at the moment and consequently promoting displacement. About the results of indentation load at 147 N, regular and irregular behavior of the load-displacement curve coexisted among the fifth indentations.
AE signals generation behavior was obvious as follows: AE signals began to generate significantly with irregular behavior (decreasing load) occurring. Then it indicated the maximum level with the section of the re-increasing load.
It is generally known that AE signals are generated from movements of dislocation with slip and twin.11)AE signals of
indentation loads at 98 and 147 N were almost at noise level, but sometimes meaningful signals were generated, especially in the region of maximum load at 147 N. Such sporadic signals correspond to signals generated by plastic deforma-tion mendeforma-tioned above. On the other hand, AE signals generation behavior of indentation load at 294 and 441 N was quite difference with its signal intensity compared with Measured curve
Corrected curve
[image:4.595.313.538.78.262.2]Fig. 4 Schematic illustration of relationships between indentation load and displacement.
Table 3 Chemical composition and mechanical properties of standard block HV500.
C Si Mn P S Cr W Fe
0.9–1.0 <0:35 0.90–1.20<0:030<0:0300.50–1.00 0.50–1.00 Bal.
JIS code Young’s modulus
[GPa]
Poisson’s ratio [—]
Hardness value [HV]
SKS3 (Alloy tool steel) 210 0.3 502 (10 kgf)
Fig. 5 Schematic illustration of FEM analysis model.
Table 4 Materials properties used in FEM analysis.
Young’s modulus
E[GPa]
Poison’s ratio
[—]
Density
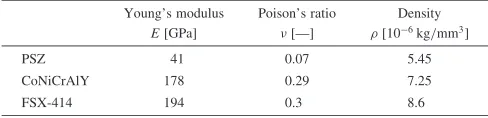
[106kg/mm3]
PSZ 41 0.07 5.45
CoNiCrAlY 178 0.29 7.25
[image:4.595.304.548.308.367.2] [image:4.595.46.292.372.438.2]lower load. Therefore, significant generation of AE signals on indentation load above 147 N wasn’t caused by plastic deformation, and a different mechanism must be related. In the former paper, we expected that irregular behavior of a load-displacement curve with indentation load above 147 N is due to a fracture from TC indentation near the contact area between indenter and specimen. Therefore the reason for the decrease in TC Young’s modulus with an increasing indentation load above 147 N is displacement promotion such as the pop-in phenomenon12) caused by such TC fracture. Results obtained from the present paper suggest that hypothesis in the former paper was reasonable.
In regard to the threshold load for TC fracture by indentation, it ranged from 147 N to near 300 N. This range
was caused by local deviation of mechanical properties, including influence of porosity, contact area, and splat lamella condition, around the contact region between indenter and specimen. TBCs specimen used in the present paper didn’t show any fractures by indentation below 147 N. Therefore the threshold load for TC fracture by indentation of this specimen could be defined as 147 N. However, this threshold load could vary by changing spray parameters because the local deviation of mechanical properties is influenced by spray parameters.
3.2 Influence of load dependency on calculated TC
Young’s modulus below 147 N of indentation load
The indentation load and displacement curve at
indenta-10 20 30 40
20 40 60 80 100 0 200 400 600 800 1000 0 Load, L / N
Displacement,
δ
/ µmAE rate,
ν
/ cps
(a) 98 N.
(b) 147 N.
20 40 60
50 100 150 0 200 400 600 800 1000 0 Load, L / N
Displacement,
δ
/ µmAE rate,
ν
/ cps 50 100 100 200 300 0 200 400 600 800 1000 0 Load, L / NDisplacement,
δ
/ µmAE rate,
ν
/ cps
(c) 294 N.
Fig. 6 Relationships between load, AE rate, and displacement of TBC specimen.
1000 2000 3000
20 40 60 80 100 0 200 400 600 800 1000 0
Sampling number, n / counts
Load, L / N AE rate,
ν
/ cps(a) 98 N.
1000 2000 3000 4000
50 100 150 0 200 400 600 800 1000 0 Load, L / N AE rate,
ν
/ cpsSampling number, n / counts
(b) 147 N.
0 2000 4000 6000
0 100 200 300 0 200 400 600 800 1000 Load, L / N AE rate,
ν
/ cpsSampling number, n / counts
(c) 294 N.
[image:5.595.285.532.70.578.2] [image:5.595.62.488.72.572.2]tion loads 9.8, 29.4, and 147 N for the top surface of the TC specimen in Fig. 1(b) are shown in Figs. 8(a) to (c) respectively. From comparison between these figures and the indentation curve of the TBC specimen shown in Fig. 6, non-linear elastic behavior in the lower part of the unloading curve for the top surface of the TC specimen would be more significant than that of the TBC specimen. This difference about the shape of the unloading curve has to be discussed in
future, but in the present paper we extrapolated it to the unloading curve as following TBC specimen. Then we decided the end of the unloading curve.
TC Young’s modulus is calculated by substituting ob-tained test data, the calculated elastic deformation of testerE
and the indenter shape parameter to eq. (5). Then it is shown as a function of the indentation load in Fig. 9. For comparison, the calculated TC Young’s modulus of the TBC specimen reported in the former paper is also shown in Fig. 9. From this result, load dependency of calculated TC Young’s modulus for the TBC specimen disappeared, and TC Young’s modulus for the top surface of the TC specimen showed as almost constant. In the former paper, we expected that the reason for the increase in TC Young’s modulus with the increasing indentation load below 147 N is the enlarge-ment of the deformation area and the increase of the UC elastic effect. The result in the present paper supported the above expectation. Therefore, it is obvious that if the TC thickness is sufficiently large compared to the deformation area caused by a specific indentation load, TC Young’s modulus can be calculated without the UC elastic effect. In other words, a pure TC Young’s modulus can be obtained by selecting an appropriate indentation load that causes a small deformation area compared with the TC thickness.
The distribution of the equivalent elastic strain in the specimen around the indenter is shown in Fig. 10, (a) indicates the case of indentation displacement of 8mm, which corresponds to an indentation load of 9.8 N, and (b) is that of 20mm, which corresponds to an indentation load of 49 N. These results indicated that the strained region at 9.8 N is fitted in TC, but it extend over TC and reached UC in the case of 49 N. Therefore, these results also suggested that the maximum load to calculate TC Young’s modulus without any UC effect for this TBC specimen is 9.8 N.
3.3 Influence of TC anisotropy on calculated TC
Young’s modulus
The indentation load and displacement curve at indenta-tion loads 9.8, 29.4, and 147 N for the side surface of the TC specimen in Fig. 1(b) are shown in Figs. 11(a) to (c),
(a) 9.8 N.
2
4
6
8
10
2
4
6
8
10
0
Load,
L
/ N
Displacement,
δ
/
µ
m
(b) 29.4 N.
5
10
15
10
20
30
0
Load,
L
/ N
Displacement,
δ
/
µ
m
(c) 147 N.
20
40
60
80
50
100
150
0
Load,
L
/ N
Displacement,
δ
/
µ
m
Fig. 8 Relationship between load and displacement on top surface indentation of TC specimen.
5
10
50
100
30
40
50
60
70
80
Young's modulus,
E
S(
c
)
/ GPa
Load,
L
M/ N
Top surface indentation: TBC specimen (t = 0.2 mm) : TC specimen (t = 4 mm) : Experimental value obtained by the bending test (41 GPa)
[image:6.595.53.286.66.638.2] [image:6.595.312.542.73.248.2]respectively. From these figures, non-linear elastic behavior in the lower part of the unloading curve was confirmed, the same as the case mentioned with the top surface.
The relationship between the calculated TC Young’s modulus on the side surface indentation of the TC specimen and the indentation load is shown in Fig. 12. For comparison, the calculated TC Young’s modulus on the top surface indentation mentioned above is also shown in Fig. 12. From these results, it was obvious that the results of the top surface and the side surface are almost same except for the results of indentation load over 98 N. Therefore, the effect of TC anisotropy on the calculated TC Young’s modulus doesn’t appear with a Young’s modulus estimation procedure that uses indentation.
It was reported that TC has anisotropy of mechanical properties from results of the general uniaxial estimation test.13)However, it was expected that a form of deformation
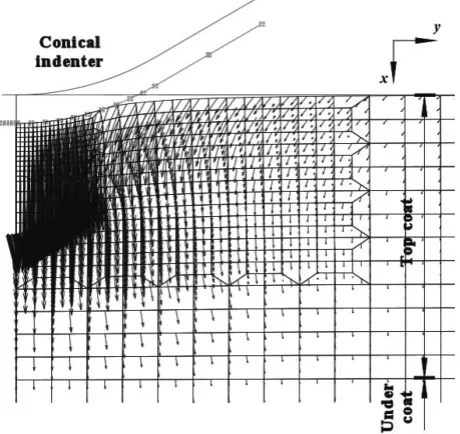
between general uniaxial test and indentation test may be different. Figure 13 shows the distribution of the displace-ment vector in the specimen around the indenter caused by indentation of 20mm depth. It clearly showed that the displacement vector in the specimen is not only uniaxial direction along indentation axis, and also showed that
deformation caused by indentation has a three-dimensional area centering on the part of contact between the indenter and specimen.
Therefore, it was supposed that there is difference of anisotropic tendency between general uniaxial test and indentation test. In addition, these results suggest the possibility of misunderstanding for the TC anisotropy estimated by using indentation test.
(a) 8 µm indentation.
[image:7.595.312.541.67.632.2](b) 20 µm indentation.
Fig. 10 Distribution of equivalent elastic strain calculated by FEM analysis.
(a) 9.8 N.
2
4
6
8
10
2
4
6
8
10
0
Displacement,
δ
/
µ
m
Load,
L
/ N
10
20
10
20
30
0
Displacement,
δ
/
µ
m
Load,
L
/ N
(b) 29.4 N.
(c) 147 N.
20
40
60
80
50
100
150
0
Displacement,
δ
/
µ
m
Load,
L
[image:7.595.51.286.74.457.2]/ N
4. Conclusion
We studied Thermal Barrier Coatings applied to gas turbine for electric power stations, in order to estimate top-coat (TC) Young’s modulus by using the indentation hard-ness test. In the present paper, we discussed the influence of load dependency on calculated TC Young’s modulus and the influence of TC anisotropy on calculated TC Young’s modulus. The summary of our conclusions is as follows:
(1) From the results of the indentation test with the AE sensor of the TBC specimen, it is confirmed that the reason for the decrease in TC Young’s modulus with an increasing indentation load over 147 N is displacement promotion due to TC fracture around the contact area caused by indentation.
(2) The threshold load for TC fracture by the indentation of this specimen can be defined as 147 N. However, this
value will vary by changing spray parameters since the local deviation of mechanical properties is influenced by spray parameters.
(3) From the results of the indentation test on the top surface indentation of the TC specimen, it is confirmed that the reason for the increase in TC Young’s modulus with an increasing indentation load below 147 N is the enlargement of the deformation area and the increase of the UC elastic effect.
(4) From the results of the indentation test on the top surface indentation of the TC specimen and finite element stress analysis, the maximum load to calculate TC Young’s modulus without the UC effect for this TBC specimen is 9.8 N.
(5) From the results of the indentation test on the side surface indentation of the TC specimen, it is obviously that the effect of TC anisotropy on the calculated TC Young’s modulus doesn’t appear by Young’s modulus estimation procedure that uses indentation. These results are caused by different form of deformation between general uniaxial test and indentation test, so it may be in danger of misunderstanding for the TC anisotropy estimated by using indentation test.
Acknowledgments
We wish to express our sincere thanks to Mr. Yoshiharu MUTOH, professor of Nagaoka University of Technology, for his constant encouragement and support.
Also, we are grateful to Mr. Masashi TAKAHASHI, researcher of Toshiba Corp., for preparing specimens.
REFERENCES
1) Y. Itoh, M. Saitoh, M. Takahashi, K. Ikeda, H. Okamoto and K. Takahara: J. High Temp. Soc.23(1997) 37–42.
2) M. Ohki, Y. Mutoh, T. Higashiwada, S. Adachi and M. Takahashi: J. Soc. Mater. Sci. Jpn.46(1997) 939–945.
3) M. Ohki, Y. Mutoh, M. Ohara, M. Takahashi and T. Ishibashi: Q. J. Jpn. Weld. Soc.16(1998) 395–404.
4) T. Ishibashi, M. Ohki, S. Katayama and S. Takagi: J. Mater. Test. Res. Association Jpn.50(2005) 35–42.
5) M. Ohki, T. Ishibashi, Y. Miyaji, E. Hatsugai, H. Amano and Y. Nakafuku: J. JRICu42(2003) 188–192.
6) M. Ohki, T. Ishibashi, T. Suzuki and M. Takahashi: J. Jpn. Spraying Soc.41(2004) 152–159.
7) J. Malzbender and R. W. Steinbrech: J. Mater. Res.18(2003) 1975– 1984.
8) H. Amano, T. Ishibashi, S. Sukigara, M. Fujitsuka and H. Sakurai: J. Mater. Test. Res. Association Jpn.47(2002) 26–33.
9) H. Amano, T. Ishibashi, M. Ohki, H. Sakurai and M. Fujitsuka: J. Mater. Test. Res. Association Jpn.48(2003) 9–16.
10) S. P. Timoshenko and J. N. Goodier:Theory of Elasticity, (McGraw-Hill, 1970) 339–344.
11) M. Ogami, K. Yamaguchi, H. Nakasa, K. Sano, E. Isono and T. Watanabe: Acoustic Emission—Bases and Applications, (CORONA, 1976) 97–117.
12) A. C. Fischer-Cripps:Nanoindentation, (Springer, 2002) 29–30. 13) L. Pawlowski: The Science and Engineering of Thermal Spray
Coatings, (John Wiley & Sons, 1995) 240–246.
5
10
50
100
30
40
50
60
70
80
: TC specimen, top surface indentation: TC specimen, side surface indentation : Experimental value obtained by the bending test (41 GPa)
Load,
L
M/ N
Young's modulus,
E
S(
c
)
[image:8.595.57.285.74.247.2]/ GPa
Fig. 12 Influence of TC anisotropy on calculated TC Young’s modulus.
[image:8.595.55.285.285.502.2]