Process Design of Extend Forging Process Using Numerical Simulation
Development of Process Design Method for the Finish Forging Process
Hideki Kakimoto
1, Yoichi Takashi
2, Hideki Takamori
2, Tatsuya Tanaka
3and Yutaka Imaida
3 1Materials Research Laboratory, Kobe Steel, Ltd., Kobe 651-2271, Japan 2Takasago Works, Kobe Steel, Ltd., Takasago 676-8670, Japan
3Faculty of Engineering and Science, Doshisha University, Kyoto 610-0321, Japan
The extend forging process is divided into the initial reduction, performing process (square process) and the finish forging process, and so on. High productivity and dimensional accuracy are desirable features in the finish forging process. In this paper, the relationship between forging conditions and dimensional accuracy was investigated in the finish forging process. The cross-section is deformed from square to octagon by a pair of flat dies, and from octagon to round by a pair of tap dies in the finish forging process. The equations for prediction of the width were developed using a numerical simulation, and a process design method in which the target size is achieved in 4 passes was developed in the octagon process. The width size of predictions using this method and the actual measurement width size were compared, and the accuracy was verified. As a result, it was clarified that the actual width size was predictable within 10 mm. The influence of the feed, the rotation angle, and the octagon size on dimensional accuracy was investigated in the spiral forging. The actual improved experimental conditions were decided on as a result of determining the improvement forging conditions using a numerical simulation. The results of the improved conditions were compared with the conventional ones. By using a numerical simulation, the optimum conditions for forging the octagon to the target round shape were calculated. Both satisfactory dimensional accuracy and productivity were achieved compared with the conventional conditions. [doi:10.2320/matertrans.P-M2009814]
(Received August 25, 2008; Accepted December 19, 2008; Published July 8, 2009)
Keywords: open die forging, numerical simulation, process design, extend forging process and finish forging process
1. Introduction
A round bar is made from a preheated steel ingot using a free forging press. It consists of three processes, reduction of the cross-section area, deformation of the cross-section shape by using the flat dies, then to formation of a round bar using the tap dies. These processes are referred to collectively as the extend forging process, and can be divided into the initial reduction, the preforming process (square process), and the finish forging process (octagon process, tap process) accord-ing to the cross-sectional shape or the usaccord-ing dies shape. Examples1) of the automatic process design of the extend forging process for an actual production have been reported. However, it is difficult to apply the automatic process design to manufacturing of a wide variety of products in small quantities. There are a lot of numbers of products, and making an optimum process design for each product is costly. In addition, if the process design is predicted by the off-line, the next process (pass) cannot actually be decided. The actual shape is different from the predicted shape because of the unequal temperature distribution.
The reduction ratio is increased in order to improve the productivity of the extend forging process, but it causes dimensional accuracy deterioration. On the other hand, it is necessary to reduce the reduction ratio in order to improve dimensional accuracy. As a result the process design depends on the experience or the skill of a press operator. The forging time and the dimensional accuracy vary depending on the skill of a press operator in the finish forging process because the material becomes longer. It is necessary to develop a process design method that does not depend on the experience or the skill of a press operator.
As previously mentioned, the finish forging process includes the octagon process and the tap process. The cross-sectional shape is deformed from the square to the
octagon and from the octagon to the round in each of these processes. In this paper, using same method2) as for the square process, the relationship between the bite ratio and the coefficient of the width spread in each pass was investigated using a numerical simulation, and an equation to predict the shape in each pass was developed in the octagon process. The influence of forging conditions (the octagon shape, the feed, the rotation angle) on dimensional accuracy was investigated in the tap process. The process design method of achieving both good dimensional accuracy and productivity in the finish forging process was developed.
2. Process Design Method for the Finish Forging Process
2.1 Process design method in the octagon process The cross-sectional shape in each pass is different because it deforms from the square to the octagon in the octagon process. It is necessary to predict the spread of the width in each pass. It is important to devise a process design method that does not depend on the experience or the skill of a press operator using the predicting equations. First, it is necessary to determine the number of the pass from the square to the octagon. Normally, the minimum number of passes from the square to the octagon is two. Figure 1 shows the cross-section of underfill using the flat dies. If the reduction ratio for one pass is large, underfill can be caused as shown in the schematic diagram in Fig. 1. In this paper four pass is decided on as a minimum number of the forging passes. Figure 2 shows the cross-sectional shape for a four pass in the octagon process viewed from longitudinal direction.
Numerical simulation to derive the spread of the width for the process design must consider the cases of the first, second, and third pass. In this paper, deformation shape is analyzed using a numerical simulation in the first, the second, and the third pass. The predict equation of the width spread is developed in each pass of the octagon process.
Table 1 shows the analysis conditions. Figure 3 shows the initial size and cross-sectional shape of each analytical model. The length of the material was 2000 mm, and the temperature distribution of material was given as 800C in
the center, and 650C at the surface. The flow stress was
obtained from compression tests. The flow stressused for the deformation analysis used the following equation that used strain rate sensitivity exponentm:
¼K""_m ð1Þ
K: the constant concerning temperature and the material,""_: strain rate. K and m are decided by the result of the compression tests. The conditions of the test are that the strain rate is changed to 0.02, 0.2 and 2 s1 at the 600, 700 and 800C. Because K and m are the function of the temperature, the flow stress using the deformation analysis is
predicted by the obtained result. Table 1 shows the example ofKandmin the case of 800C. The Coulomb coefficient of
the friction¼0:15were used. The Coulomb coefficient of the friction was determined by the actual width spread of the first pass at the octagon process.
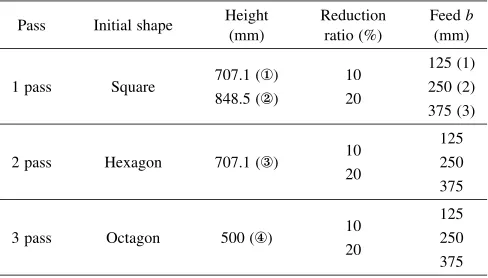
The forging speed was 5 mm s1. As shown in Table 2, the numerical simulation conditions were reduction ratios of 10% and 20% to the initial height, and feeds of 125, 250, and 375 mm. The 3-D finite element method software (FORGE3D) was used. The method of calculating the spread of the width was to measure the distance in the width direction of the nodes at the position of maximum width in the initial shape after deformation analysis. In Table 2,‹and 1 indicate the analysis numbers. For example, the analysis conditions in the 1 pass with height 707.1 mm, reduction ratio 10%, and feed 125 mm is indicated as the‹-10-1.
As described above, the contact area between the material and the dies varies according to the pass in the octagon process. The initial width contact length between the material and the dies was decided on the average length of initially and after forging width. Figure 4 shows each position and symbol for the 1 pass and 3 pass viewed from the longitudinal direction. As shown in this figure, the initial width is defined as W0, the maximum width of the material initial shape is
Wmax0, the maximum width of the material after forging is
Wmax1, the initial height is defined asH0 and after forging height isH1. The initial length isL0and after forging length isL1. It was assumed that the initial widthW0 is the dashed line portion in the figure. According to the literature2) on research conducted into the spread in the square process, the coefficient of the width spreadSwas defined by the following equation, using the volume constancy condition:
L1¼L0ðH0=H1Þ1S ð2Þ
Underfill
Material
Flat die
(2) After forging shape (1) Initial shape
Fig. 1 Appearance of underfill using a pair of flat dies viewed from width direction.
Forging shape Initial shape
(2) 1pass
(1) Initial (3) 2pass
(4) 3pass (5) 4pass
[image:2.595.50.289.73.156.2]Fig. 2 Cross-sectional shape of octagon process viewed from longitudinal direction.
Table 1 Example ofKandmin case of 800C.
Strain K m
0.2 211 0.058
0.4 230 0.068
0.6 235 0.072
0.8 237 0.075
1.0 239 0.077
707.1 or 848.5
707.1
500 565.7
262.8
(2) 2pass
(1) 1pass (3) 3pass
[image:2.595.315.536.75.170.2]Fig. 3 Initial size and cross-sectional shape of each analytical model.
Table 2 Analytical conditions in the octagon process.
Pass Initial shape Height
(mm)
Reduction ratio (%)
Feedb (mm)
707.1 (‹) 10 125 (1)
1 pass Square
848.5 (›) 20 250 (2)
375 (3)
10 125
2 pass Hexagon 707.1 (fi)
20 250
375
10 125
3 pass Octagon 500 (fl)
20 250
[image:2.595.77.261.209.367.2] [image:2.595.305.549.221.360.2] [image:2.595.46.290.429.505.2]On the other hand, during a normal bar forging, the bar is moved longitudinally between strokes in the square process. The stroke length newly presented to the dies on each stroke will be called the bite (or the feed) and when expressed as a proportion of the width of a bar will be termed the bite ratio. The following equation relating the coefficient of the spread Sand the bite ratiob=W0was defined in the square process. The coefficient a is a constant determined by the material anisotropy, the friction between the material and the dies, and other forging conditions:
S¼ ab=W0
1þab=W0
ð3Þ
[image:3.595.107.488.77.226.2]In the square process,a¼1:52. In this paper, the eqs. (2) and (3) were applied and the relationship between the bite ratio b=W0 and the coefficient of the width spread S was investigated. Now, in the case of forging the corner or the area of the material, the width of the after-forging shape is assumed by the width of before the forging shape and the width spread as reduction. This time, the width spread is calculated by predicting the material contact length of the width direction with the flat dies.
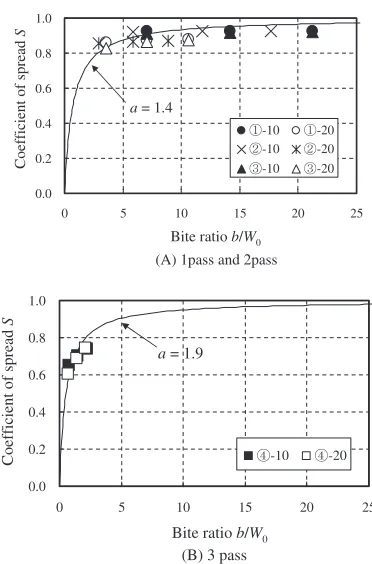
Figure 5 shows the analytical results. This figure is shown dividing to forge the corner (‹,›,fi) and the area (fl). The coefficient a was calculated using the eq. (3) from the relationship betweenSandb=W0obtained from the analysis in Fig. 5. From each result in Fig. 5 and the eq. (3), the coefficient a was calculated by using the method of the square process. From Fig. 5(A) the coefficient a¼1:4 and the following approximation equation was obtained in the octagon process. From Fig. 5(B) the coefficienta¼1:9and the following approximation equation was obtained in the octagon process in the case of the forging area. This equation is shown as the solid line in Fig. 5.
Now, when Fig. 5(A) and Fig. 5(B) are compared, the coefficientaof Fig. 5(A) is smaller. As for this, the result of Fig. 5(B) is the area forging but the result of Fig. 5(A) is the corner forging. Therefore the width spread of Fig. 5(A) is smaller than that of Fig. 5(B).
In the case of 1 pass and 2 pass the following equation is obtained by Fig. 5(A).
S¼ 1:4b=W0
1þ1:4b=W0
ð4Þ
And in the case of 3 pass and 4 pass the following equation is obtained by Fig. 5(B)
S¼ 1:9b=W0
1þ1:9b=W0
ð5Þ
Now, W is assumed for the width spread by reduction. After forging the widths of 1 pass and 2 pass are predicted by the following equation:
W1 ¼Wmax0þW
¼Wmax0þW0
H0
H1
S
¼Wmax0þW0
H0
H1
1:4b=W0 1þ1:4b=W0
ð6Þ
Initial widthW0
H0 H1
(1) 1 pass Wmax W W 0
Wmax W W 1
(2) 3 pass Initial widthW0
Wmin0
Wmax0
H0 H1 Hmin0
Fig. 4 Cross-section of each position and nomenclature in case of 1 pass viewed from the longitudinal direction.
0.0 0.2 0.4 0.6 0.8 1.0
0 5 10 15 20 25
-10 -20 -10 -20 -10 -20
Bite ratio b/W0
Coefficient of spread
S
a = 1.4
(A) 1pass and 2pass
0.0 0.2 0.4 0.6 0.8 1.0
0 5 10 15 20 25
-10 -20
Bite ratio b/W0
Coefficient of spread
S
a = 1.9
(B) 3 pass
[image:3.595.333.519.260.542.2]W0is the following equation:
W0¼
H0H1
2 ð7Þ
In the case of 3 pass and 4 pass, the following equation is obtained by the same method:
W1 ¼Wmax0þW
¼Wmax0þW0
H0
H1
S
¼Wmax0þW0
H0
H1
1:9b=W0 1þ1:9b=W0
ð8Þ
W0is the following equation:
W0¼
Wmax0þWmin0
H0Hmin0
ðH0H1Þ ð9Þ
Now, the eqs. (6) and (7) can be applied within the range of b=W0521:2 at 1 pass and 2 pass, and the eqs. (8) and (9) can be applied within the range of b=W0521:2 at 3 pass and 4 pass.
2.2 Verification of predictions of spread in the octagon process in actual process
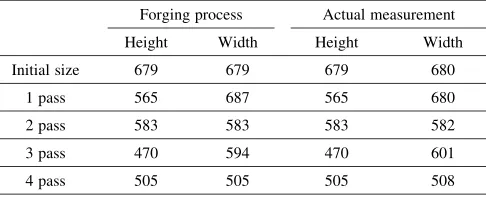
The predicting equations for width spread obtained as described above were applied to the actual process to verify their accuracy. Table 3 shows the forging process (predicted width) by using the predicting equations and the actual measurement results of the width in the case of an opposite side distance of 505 mm. It is confirmed that the predicted width size was accurately corresponding to the actual width size from this table.
2.3 Process design method in the tap process
The tap forging process is the process whereby the cross-sectional shape is deformed from the octagon to the round using the tap dies. One of the tap forging processes is spiral forging.3)The feed and the rotation are applied at the same time in spiral forging. Normal tap forging is applied as only rotation. Spiral forging is more efficient because of the constant deformation area in each pass. The same thing can be said even if the finish forging diameter and diameter of the tap dies are different. Spiral forging is considered to have better productivity if the material shape, the die shape, and the forging conditions are optimized. The influence of forging conditions on finished dimensional accuracy is investigated, and the forging conditions are optimized by using numerical simulation.
2.3.1 Influence of spiral forging conditions on dimen-sional accuracy
The effect on dimensional accuracy of the difference between the tap forging and the spiral forging was inves-tigated using numerical simulation. Figure 6 shows the analysis model.
The target diameter of round was 500, and the initial octagon size was 504.6 mm. In this case the ratio of increase in the cross-sectional area of the octagon relative to the cross-sectional area of the round cross-section is 7.5%. The material conditions were the same as the conditions in the octagon process. The shape of the tap dies was central angle 90, R250 and tangentially straight line. The height of the
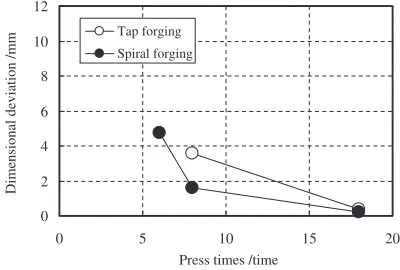
[image:4.595.298.539.77.230.2]caliber was 250 mm. In other words, when the gap between the upper and lower dies was 0, the diameter was500. The influences of the feed and the rotation angle on dimensional accuracy were investigated with the initial octagon shape. The finished shape and the dies shape remained constant. Table 4 shows the analytical conditions for the tap forging and the spiral forging. This table shows a comparison of the press time within the same length unit (in this case 300 mm) and the angle unit (in this case 180). Figure 7 shows the
variation of the radius along the axial direction for analysis No. 4. As shown in this figure, the radius varies periodically. The end parts between 0 mm to 500 mm and between 1500 mm to 2200 mm can be considered to be unsteady parts. The radius was evaluated in the constant part between 500 mm and 1500 mm. As an index for expressing dimen-sional accuracy, the deviation in the constant part (the maximum radius–the minimum radius) was used. Figure 8 shows the relationship between the rotation angle and the dimensional accuracy for tap forging and spiral forging. Table 3 Forging process by process design method and measurement
results of actual width in case of opposite side distance 505 (mm).
Forging process Actual measurement
Height Width Height Width
Initial size 679 679 679 680
1 pass 565 687 565 680
2 pass 583 583 583 582
3 pass 470 594 470 601
4 pass 505 505 505 508
Tap dies
Material
504.6
[image:4.595.45.294.78.269.2] [image:4.595.306.549.267.380.2]Fig. 6 Analytical model.
Table 4 Analytical conditions of tap forging and spiral forging.
Tap forging Spiral forging
No. 1 2 3 4 5
Rotation angle
() 20 45 20 45 60
Press times
(/180) 9 4 9 4 3
Feed (mm) 150 300/18 300/8 300/6
Press times
[image:4.595.47.290.688.787.2]As shown in this figure, if the press times increase, the dimensional accuracy tends to become higher. The dimen-sional accuracy was higher for spiral forging than for tap forging at the 8 and 18 press times.
2.3.2 Relationship between feed and rotation angle The press time is affected by the feed and the rotation angle in spiral forging. The influence of the feed and the rotation angle on dimensional accuracy was investigated. Table 5 shows the analytical conditions. As shown in the table, No. 2-1 is standard. Both the feed and the rotation angle by a factor of 0.5 (No. 1-1), 1.5 (No. 3-1), and 2 (No. 4-1), as well as varying the feed only (No. 2-2, 2-3) were inves-tigated. Figure 9 shows the relationship between the rotation angle and the dimensional deviation. Figure 10 shows the relationship between the rotation angle and the dimensional deviation in the case of the difference feed. From Fig. 9, as both feed and the rotation angle are reduced, dimensional
accuracy tends to become lower. That is, as both the feed and the rotation angle are reduced, the deformation area is small. On the other hand, the material contact area with the dies is increased. So, the dimensional accuracy tends to become lower.
The dimensional accuracy tends to improve from Fig. 10 if the feed is small at the same rotation angle. This is also considered to be due to the overlap of the areas of contact between the material and the dies. On the other hand, the dimensional accuracy tends to deteriorate from Fig. 10 if the rotation angle is small at the same feed. The near forging position is under the influence of the metal flow to each other as the rotation angle is reduced. That is, the contact material with the dies deforms together with a reduction, and the area becomes the underfill. As a result, the dimensional accuracy deteriorates. In addition, in the case of a large feed, the dimensional accuracy is adversely affected because there is a 249
250 251 252 253 254 255
0 500 1000 1500 2000 2500
Radius change in a longitudinal
cross-section /mm
Distance from edge /mm
Fig. 7 Radius distribution in case of analytical No. 4.
0 2 4 6 8 10 12
0 5 10 15 20
Tap forging
Spiral forging
Press times /time
Dimensional deviation /mm
[image:5.595.326.526.74.209.2]Fig. 8 Relationship between angle of rotation and dimensional deviation among tap of forging and spiral forging.
Table 5 Analytical conditions.
No. 1-1 2-1 2-2 2-3 3-1 4-1
Feed: mm 37.5 75 37.5 112.5 112.5 150
Rotation angle: 22.5 45 45 45 67.5 90
Press times
A (/180) 8 4 4 4 2.7 2
Press times
B (/300 mm) 8 4 8 2.7 2.7 2
B/A 1 1 2 0.67 1 1
0 2 4 6 8 10 12
0 10 30 50 70 90
1-1 2-1 3-1 4-1
Dimensional deviation /mm
Angle of rotation /degree
20 40 60 80
Fig. 9 Relationship between angle of rotation and dimensional deviation.
0 2 4 6 8 10 12
0 10 30 70
1-1
2-2
2-3
3-1
Dimensional deviation /mm
Angle of rotation /degree Feed : 37.5mm
Feed : 112.5mm
[image:5.595.57.279.76.186.2]20 40 50 60 80 90
[image:5.595.57.517.264.535.2] [image:5.595.44.290.267.538.2] [image:5.595.323.531.363.530.2]part that is not forging. Therefore, it is important to optimize the rotation angle at each feed.
From the above, it is shown that reducing the feed and increasing the rotation angle can improve the dimensional accuracy. It is necessary to determine the relationship between the feed, the rotation angle, and the dimensional accuracy to develop the process design for the spiral forging. The relationship between the numbers of press times per 300 mm B divided by press times per 180 A and the
dimensional accuracy was investigated. Figure 11 shows the results. The index of B/A is the relationship between the material contact area with the dies. That is, the material is not forged in all circumferences in the case where the B/A is smaller than 1. And the material contact area with the dies tends to increase, as the B/A is greater or equal 1. As shown in this figure, the dimensional accuracy tends to become high as B/A becomes larger, as overlap increases as B/A becomes larger. It is possible to obtain the optimum value of B/A by using this figure. It is possible to determine the feed and the rotation angle from the viewpoint of productivity.
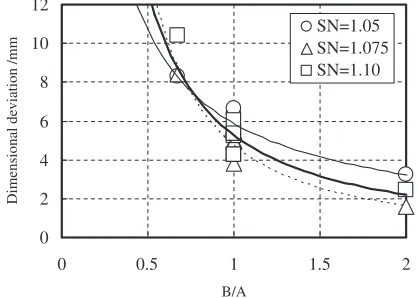
2.3.3 The influence of the octagon size
The influence of the initial octagon size was investigated by using the analysis in which the octagon cross-sectional area increase ratio SN was varied with respect to the target diameter. In this paper the three conditionsSN¼1:05, 1.075, and 1.10 were investigated. Figure 12 shows the comparison of the dimensional accuracy against B/A for eachSNratio. In the case of B/A<1, the dimensional accuracy ofSN ¼1:05 and 1.10 is better than that ofSN ¼1:075. On the other hand, in the case of B/A=1, there is a optimumSNin which the dimensional accuracy is minimum. In this paper, the metal flow is different because the reduction is different at each analytical condition for constant forging shape. SN¼1:075 is the optimum value. This time, the inner curvature of the tap dies is same as the forging shape. It is considered that there is an optimumSN value even if the inner curvature of the tap dies is not the same as the forging shape.
From the results the dimensional accuracy tends to low for all conditions as B/A increases. The cross-sectional area increase ratioSNaffects the dimensional accuracy. From the analysis results, the dimensional accuracy is 2 mm or less for SN ¼1:075. It is considered that B/A¼1:7 is an optimal value. When the target dimensional accuracy is 5 mm or less, the target can be achieved for B/A=1:25 in case of 1:055SN51:10.
When B/A<0:7the dimensional accuracy is highest for SN ¼1:05, but conversely for B/A=0:7, the dimensional accuracy is lowest for SN ¼1:05. It is considered that the material is forged partially because the octagon size is smaller than the tap dies internal R when B/A<1. Conversely, the press time is high when B/A=1. In the case of SN ¼1:05, the underfill, formed during forging, made dimensional accuracy deteriorate.
For example, if a deviation of less than 5 mm is allowed on the surface and maximization of productivity is aimed for, it is necessary to make the rotation angle and the feed as large as possible with B/A=1:5(for example, the rotation angle of dies 90, the feed 150 mm). On the other hand, if the
dimensional accuracy has priority, it is necessary to select the feed and the rotation angle to satisfy B/A=2 for
SN ¼1:075.
2.4 Verification of the effect in tap forging in actual process
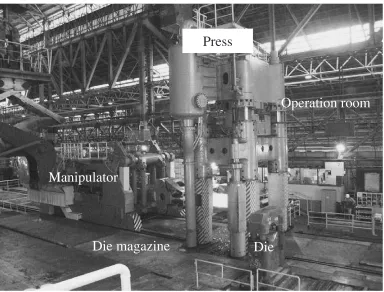
Using the results in Fig. 12, the actual process was applied and the effect on the dimensional accuracy was investigated. Table 6 shows both conventional and modified forging conditions. B/A¼2 and the feed are maximized, and the rotation angle is set to 90 for considerations of the
productivity in the modified conditions. Figure 13 is shown as the appearance of the free forging press. As shown in this figure, the feed and the rotation are given by using the manipulator for material. As for the feature of this press, it is possible to continue to feed and rotate the material and to stop to feed and rotate when the load stands up. As a result of this investigation, the rotation angle becomes a limiting condition because the rotation angle is large and the feed is small. On the other hand, it is possible to control the rotation angle by the distance of the upper die. That is, the
0 2 4 6 8 10 12
0 1 2
1-1 2-1 3-1 4-1 2-2 2-3
Dimensional deviation /mm
B/A
[image:6.595.71.269.75.211.2]0.5 1.5
Fig. 11 Relationship between B/A and dimensional deviation.
Dimensional deviation /mm
B/A
0 2 4 6 8 10 12
0 1 2
SN=1.05 SN=1.075 SN=1.10
0.5 1.5
[image:6.595.322.531.76.225.2]Fig. 12 Relationship between B/A and dimensional deviation in case of changing SN ratio.
Table 6 Actual forging conditions.
Process design
Octagon size (mm)
Target size (mm)
Feed (mm)
Rotation angle
() B/A
Conventional
forging design 505 500 40 45 0.93
Modified
[image:6.595.303.551.282.364.2]times of feed and rotation are almost the same because the rotation of the material is finished and the material is deformed by the tap dies at the same time. As mentioned above, the applicability limit is the case of waiting for the rotation with the tap dies opened from the relationship between the press stroke and the stroke per minutes.
The measured results for the deviation in the actual process were 7 mm (the actual measurement) under the conventional conditions and 4 mm (the actual measurement) under the modified conditions. It is confirmed that the dimensional accuracy is improved. In addition, the time for forging length 3000 mm is compared. 176 sec was required under the conventional conditions, and 130 sec was required under the modified conditions. In this paper, the cycle time of 1 pass is short at the conventional conditions, but the press time increases. On the other hand, it is considered that the productivity is improved by decreasing the press time in the modified conditions. As a result, an improvement in productivity was obtained.
3. Conclusions
The equations for predicting the width spread in the octagon process were developed using numerical simulation. The influence of forging conditions on surface dimensional accuracy in the tap process was investigated. The results obtained were as follows:
(1) The relationship between the spread coefficient and the bite ratio that can be applied to each pass was clarified in the octagon process. It is possible to predict the spread in the octagon process using this relationship. The process design method is constructed.
(2) From the results of applying the process design method for the octagon process to the actual process, it is possible to predict the accuracy to within 10 mm for the octagon opposite size 505 mm.
(3) As a result of investigating the effect of forging conditions on dimensional accuracy for the tap process, the dimensional accuracy can be correlated with the press time per unit length/press time per unit rotation angle.
(4) As a result of applying the tap process design method to the actual process, it was confirmed that both produc-tivity and dimensional accuracy were improved com-pared with conventional conditions. The effectiveness of the process design method was clarified.
REFERENCES
1) K. Tanaka: Steel Forgings Castings493(1994) 15–22.
2) A. Tomlinson and J. D. Stringer: Trans. ISIJ.193(1959) 157–162. 3) K. Yamamoto: Proc. 13th Int. Conf. on Forging, (The International
Forgemasters Meeting, 1997) pp. 115–132.