An Enhanced Calibration Scheme for the EDM Hole-Drilling Strain Gage Method
for the Measurement of Residual Stress in Ferrous Materials
H. T. Lee, C. Liu
*, F. C. Hsu
*and J. M. Hsu
*Department of Mechanical Engineering, National Cheng-Kung University, 701, Tainan, Taiwan, R. O. China
Recent studies revealed that EDM hole-drilling strain gage method is applicable for the measurement of residual stress in materials with higher hardness and toughness. However, the metallurgical transformation layer formed on the wall of the hole induces an additional stress and therefore generates a measurement error. Usually this error can be calibrated by estimating and reducing the hole-drilling induced extra stress,
IS. However, the value ofISis highly sensitive to the EDM parameters. Accordingly, the current study aimed at loweringISby optimizing the
working parameters of pulse current, pulse-on duration and pulse-off duration with experiments. An inverse power law relationship was constructed to predict the magnitude of the hole-drilling induced stress where was referred. A convenient calibration method was proposed where calibration factor can be easily determined. The calibrated results revealed good accuracy where deviation is no more than 10 MPa. The accuracy of the proposed calibration scheme was confirmed in study. [doi:10.2320/matertrans.MER2008098]
(Received March 25, 2008; Accepted June 2, 2008; Published July 25, 2008)
Keywords: electrical discharge machining, hole-drilling strain gage method, residual stress, transformation layer
1. Introduction
In the measurement procedure of the hole-drilling strain gage method, a strain gage rosette is attached to the specimen surface, and a circular hole is drilled vertically into the specimen at the center of the gage circle in order to partially release the residual stress within the specimen.1) The magnitude of the released strain is monitored continuously during the drilling process and once the depth of the measurement hole reaches the prescribed value, the strain values are substituted into the stress-strain equation provided within the ASTM E837 standard in order to derive the residual stress value. However, the drilling operation inevi-tably induces an additional stress within the component. This additional stress is mixed with residual stress detected and therefore leads to a corresponding error in computing the residual stress.2)It has been reported that the additional stress
induced by High-Speed (HS) drilling techniques is relatively lower than that generated by conventional hole-drilling methods such as low-speed end milling technique and abrasion jet machining technique, for example.3) Further-more, HS drilling techniques have the advantages of simple experimental setup, straightforward operation and improved precision.4,5)Accordingly, the ASTM E837 standard explic-itly recommends the use of HS drilling technique to accomplish the hole-drilling strain gage measurement of residual stress.
However, hole drilling with high speed leaded to a severe wear on cutting tool when performed on specimens with high hardness and high toughness. This tool wear increased not only the induced stress and deviation,6)but also might prompt
a catastrophic failure. The completion of the measurement process became questionable. Consequently, alternative drilling method is required here. The electrical discharge machining (EDM) technique has the advantage that its applicability is not limited by the mechanical properties of the specimen. It can be applied to all ferrous materials, even by those with high hardness and high toughness.
Previous studies7–9) have shown that tensile residual
stresses as high as 400 MPa can be induced within the region of the transformation layer extending from the machined surface to a depth of around 40 micrometers. However, at greater depths, the tensile stress gradually reduces toward zero and may even transform to a small compressive stress. By EDM hole-drilling strain-gage method, an extra strain introduced by this transformation layer is inevitably included within the released strain detected. Such measurement error should be calibrated if the accuracy of the residual stress measurement is aimed at. In previous studies by the current group, it was shown that the hole-drilling induced stress (IS)
measured on stress-free specimens could be useful in com-pensating the measurement error.10–12)However, it was also
noted that the value ofISwas highly sensitive to the working
parameters such as pulse current and pulse-on duration. Thus it is required to specify the appropriate EDM working conditions in order to ensure the validity of the calibration.
It is clear that the stress induced during the hole-drilling process should be minimized. Accordingly, the current study commences by finding suitable values of the pulse current, pulse-on duration and pulse-off duration. Good combination of those parameters can effectively suppress the occurrence of secondary discharges and therefore result in a lower induced stress. A series of experiments were performed using the various combination of parameter settings to check the hole-drilling induced stress generated. In this study, six different ferrous specimens with varying thermal conductiv-ities were used. A mathematical correlation between the hole-drilling induced stress and the thermal conductivity coefficient of the specimen was derived on the base of the experimental data. This correlation was employed further to construct a calibration equation with which the measured stress value obtained using the EDM hole-drilling strain-gage method was compensated. Study results were further checked and discussed.
2. Experimental Procedure
The residual stress measurements conducted in the present
*Graduate Student, National Cheng-Kung University
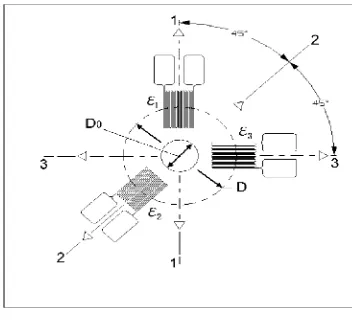
study were performed in accordance with the ASTM E837 standard using a TEA-06-062RE strain gage rosette and a P-3500 strain indicator (both manufactured by the Vishay Measurements Group Inc., USA). Figure 1 presents a schematic illustration of the strain gage, in which D is the diameter of the gage circle (5.13 mm in the present case) and D0 is the diameter of the drilled hole. According to ASTM
E837, the diameter of the measurement hole should be between 0.3D and 0.5D, while its maximum depth should be 0.4D. During the drilling process, the released strain was monitored continuously through the strain gage and indica-tor. When the measurement hole reached its maximum depth, the corresponding values of the strain, namely"1,"2, and"3
(see Fig. 1) were read and substituted into eq. (1) shown below to obtain the corresponding value of the residual stress. Note that in eq. (1),m,minandm,maxrepresent the minimum
and maximum principal residual stress.
(m,min),(m,max)¼ ð"3þ"1Þ=4A ½ð"3"1Þ2
þ ð"3þ"12"2Þ20:5=4B:
ð1Þ
A and B are material-dependent coefficients, whose values are derived directly from the tables presented in ASTM E837 depends on Young’s modulus and Poisson’s ratio of the specimen and the diameter of the measurement hole. The experiments were performed using a CNC die-sinking EDM machine (Yihawjet Inc., Taiwan) with an open circuit voltage of 120 V. Kerosene dielectric with a temperature of 25C and solid CuW electrode with an external diameter of
1.5 mm were used.
AISI 1045 mild steel was used to investigate the influence of the EDM parameters on the relative stability coefficient of the discharge duty ratio and the hole-drilling induced stress. In our experiments, the specimens with a diameter of 35 mm and a thickness of 6.2 mm were annealed to ensure a stress-free state (as confirmed via X-ray diffraction analysis). The specimens were then drilled in accordance with the ASTM E837 standard. Since the internal residual stress of a fully annealed specimen prior to the drilling is nearly zero and can be neglected. The values of the measured stress obtained from eq. (1) should thus be the principal stress, IS,min and
IS,max, induced by the hole-drilling operation.10–12)
Further step required was to explore the correlation between the hole-drilling induced stress and the thermal conductivity coefficient of the sample. Derivation of a more
robust calibration scheme was aimed at. Six different ferrous materials, namely AISI 1045, 4140, L6, H13, M2 and 304 were used in this experiment. They were deliberately chosen so as to provide a wide range of thermal conductivity coefficients. The values correspondingly are 50.2, 41.8, 36.4, 28.6, 21.3 and 16.3 W m1K1, respectively.
Finally, further checkup aimed at the validity and precision of the proposed calibration approach. Annealed AISI H13 tool steel specimen was used here. Specimens were made and pre-stressed with uniaxial loading equivalent to 20%, 35%, 50% and 65% of their yield strength, respectively, where the presence of residual stress was simulated. Note that the dimensions of the specimens and the grip used were designed in conformance with the guidelines stated in ASTM E8M tension testing standard.13) The magnitude of the pre-stress was then measured using the EDM hole-drilling strain gage method.
3. Results and Discussions
Figure 2 illustrated the variation of the measured stresses in AISI 1045 stress-free specimens drilled with a solid CuW electrode under different EDM conditions. It can be seen that the maximum (IS,max) and minimum (IS,min) principal
stress induced by IP=on=off settings of 4A/23ms/23ms
and 12A/23ms/23ms were 157:9MPa/136:4MPa and
170:2MPa/155:6MPa, respectively. These stress values were greater than 48% of the yield strength of AISI 1045 carbon steel (ys¼285MPa) in magnitude, and thus these
parameter combinations were obviously inappropriate for the EDM hole-drilling strain gage method. On the other hand, the hole-drilling induced stresses obtained by 4A/ 9ms/9ms and 12A/9ms/9ms were comparatively much lower, where those corresponding values were40:4MPa/
30:2MPa and43:0MPa/35:0MPa, respectively. How-ever, the discrepancy between the IS,max and IS,min was
found to be around 12.2 MPa and 8.0 MPa, respectively. Theoretically, if the transformation layer formed on the hole surface is homogenous and has uniform properties, then the three strains ("1,"2,"3) detected by the strain gage should be
approximately equal, i.e.IS,maxIS,min. However, for the
Fig. 1 Schematic illustration of rosette strain gage.
Fig. 2 Hole-drilling induced stress generated under various combinations ofIP=on=offparameters with solid CuW electrode in AISI 1045
[image:2.595.79.255.71.231.2] [image:2.595.312.542.587.748.2]parameter settings of 12A/9ms/9ms and 4A/9ms/9ms, the discrepancies between IS,max and IS,min were more than
20% of the average of the two principal stresses in each case. It means that the properties of the transformation layer were far from uniform. However, by parameter setting of 12A/ 6ms/30ms as shown in Fig. 2, the data forIS,maxandIS,min
were found to be 25:8MPa and 23:7MPa, respectively. The discrepancy between these two values was reduced to just 2.1 MPa. According to ASTM E837 regulation, the resolution of the strain indicator used in the measurement process requires less than 2m". This resolution corresponds to a stress of approximately 2.5 MPa. Comparing the discrep-ancy of the principal induced stresses mentioned above (2.1 MPa) with the strain indicator resolution (2.5 MPa), it can be concluded that the discrepancy between the IS,max
and IS,min under this working condition was sufficiently
small which can be ignored.
By EDM process, the electrical energy of each single discharge (E) is contributed by the product of the pulse current (IP), the voltage (Vg) between the electrode and the
workpiece, and the pulse-on duration (on), i.e. E¼IP
Vgon. Theoretically, it seems reasonable to expect that a
lower discharge energy will also result in a lower hole-drilling induced stress. However, this is found not to be the case in practice. Under the five EDM parameter settings as shown in Fig. 2,Vg voltage was restricted to the range 45–
48 V. And thus five sets of EDM conditions can be ranked according to energy level as follows: 12A/23ms/23ms>
12A/9ms/9ms>4A/23ms/23ms>12A/6ms/30ms>4A/ 9ms/9ms, where the energy values were 12.4, 4.9, 4.1, 3.2 and 1.6 mJ, respectively. However, experimental results showed that the magnitude of induced stresses was in the order as: 12A/23ms/23ms>4A/23ms/23ms>12A/9ms/ 9ms>4A/9ms/9ms>12A/6ms/30ms. The two ordered sequences are clearly different, and thus it is apparent that there must be some other factors affecting the magnitude of the induced stress besides of IP andon. Numerous
experi-ments were performed in this study, we found that the hole-drilling induced stress is basically affected by the occurrence of the secondary discharge. Theoretically, if the dielectric fluid can be kept its good function as an effective insulation layer between the electrode and the workpiece, the succes-sive discharge sparks are randomly distributed over the
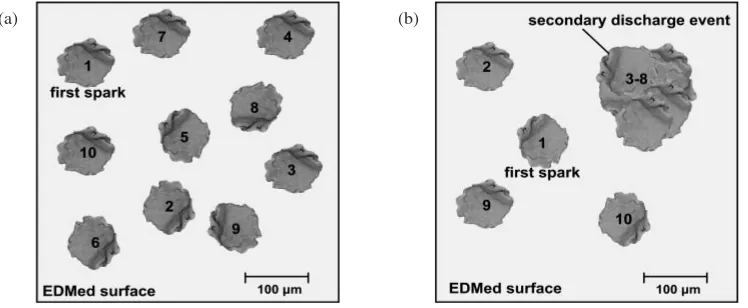
machined surface, as shown schematically in Fig. 3(a). The craters shown in this schematic figure were pasted from SEM micrograph symbolized spark results of a single discharge on surface. If there is no secondary discharge happened during discharging process, the morphology of EDMed surface will take the form similar to that shown in Fig. 3(a) where individual spark craters are separately dispersed on surface. However, as the insulation property of the dielectric fluid after the discharge is not fully restored before the next discharge event. The secondary discharges would occur during the process, and some sparks would hit the same site that caused overlapped craters formed on surface. Schematic figure is shown in Fig. 3(b) where the third to the eighth discharge hit the same place for example. Under these circumstances, a significant amount of discharge heat can be accumulated on site of the place where secondary discharge occurred, and thus an increased induced stress is generated.
Hence we assumed that the magnitude of the hole-drilling induced stress was fundamentally related to the occurrence of secondary discharge events during the drilling process. However, it is practically quite difficult to detect the occurrence of secondary discharges so far nowadays our techniques attainable. As alternative parameter designated as the relative stability coefficient of the discharge duty ratio (Csta) was introduced here in order to detect the occurrence
of the secondary discharge. Figure 4 presented a schematic illustration showing several scope patterns of working voltage in one discharge duty cycle. As shown, the pattern of normal duty comprised delay duration (d), pulse-on
duration (on), and pulse-off duration (off).14)The ratio of the
pulse-on duration to the total duration of the cycle was referred to as the discharge duty ratio,Ron (see eq. (2a)).
Ron¼on=ðdþonþoffÞ ð2aÞ
In the current study, an electronic monitoring system was designed to detect the Ron values 100 times every 350 ms.
TheRondata were then used to compute its mean (Ron) and
standard deviation (sR) in accordance with eqs. (2b) and (2c),
respectively. From a statistical perspective, the standard deviations of data obtained from different experiments can not directly be compared unless their means are close to equal.15) Therefore, the sR should be converted into an
equivalent relative variability coefficient, designated asCVR,
(a) (b)
[image:3.595.113.487.73.227.2]where CVR = standard deviation/mean (see eq. (2d)). The
relative stability coefficient of the discharge duty ratio (Csta)
was then defined as1CVR(see eq. (2e)).
Ron¼ X100
i¼1
ðRon,i=100Þ ð2bÞ
sR¼ X100
i¼1
ðRon,iRonÞ2 !
=ð1001Þ " #0:5
ð2cÞ
CVR¼sR=Ron ð2dÞ
Csta¼1CVR ð2eÞ
When the scope pattern of each discharge duty conforms exactly to the EDM parameter settings, the Csta coefficient
can be maintained at (or very close to) a value of 1. The occurrence of secondary discharge events yields abnormal scope patterns such as those labeled as ’B’, ’C’ and ’D’ in Fig. 4. The corresponding changes in d and on prompt a
significant reduction in the value ofCsta. Figure 5 illustrated
the Csta value when using the five sets of EDM conditions
shown in Fig. 2. From the experimental results presented in Figs. 2 and 5, it can be seen that the hole-drilling induced stress decreased as theCsta value increased. When
the drilling operation was performed using parameter setting of 12A/6ms/30ms, the value of Csta lain between
0.99 and 1. Accordingly, it was reasonable to infer that
the occurrence of secondary discharges was suppressed in drilling process, and therefore, the hole-drilling induced stress could be efficiently decreased. Furthermore, Fig. 5 showed that when the hole-drilling process was performed using EDM conditions of 4A/9ms/9ms, 12A/9ms/9ms, 4A/23ms/23ms and 12A/23ms/23ms, the corresponding
Csta coefficient had a value of 0.93, 0.91, 0.62 and 0.56,
respectively. In other words, it was significant to infer that the secondary discharge events took place in these drilling processes, which not only decreased theCstavalue, but also
[image:4.595.53.288.67.218.2]increased the induced stress.
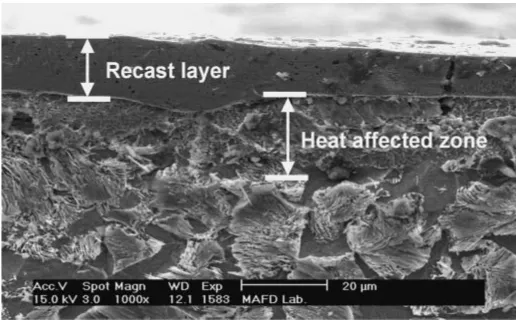
Figure 6 presented a SEM micrograph showing the cross-section of the transformation layer by AISI 1045 specimen. Two distinguishable layers, namely the recast layer and the heat affected zone, were readily identified via their distinc-tive microstructures. Similar SEM images were obtained for AISI 1045 specimens machined using each of the five parameter settings shown in Fig. 2 and were used to measure the thickness of the recast layer in each case. The corresponding results were presented in Fig. 7. Significantly, the results showed that the thickness of the recast layer was not directly related to the discharge energy. For example, the EDM condition of 12A/9ms/9ms had a higher value of discharge energy than the condition of 4A/23ms/23ms, however, the thickness of the corresponding recast layer was
Fig. 5 Relative stability coefficient of discharge duty ratio for various combinations ofIP=on=offparameters. (material: AISI 1045).
Fig. 6 SEM micrograph of recast layer and heat affected zone. (material: AISI 1045; EDM condition: 4A/23ms/23ms). Fig. 4 Scope patterns of discharge duty cycle: (A) profile of normal duty
[image:4.595.312.543.74.230.2] [image:4.595.168.426.284.446.2] [image:4.595.83.290.535.618.2]far less than that produced in the latter case. From the experimental results presented in Figs. 2 and 7, it can be seen that greaterCsta(e.g. 0.99 by 12A/6ms/30ms setting) value
prompted a significant reduction in the thickness of the recast layer. Accordingly, it was reasonably confirmed that the occurrence of secondary discharge was an important factor in enhancing the accumulation of discharge heat. Because the EDM condition of 12A/6ms/30ms ensured that the Csta
coefficient is kept within 0.99–1 throughout the drilling operation, we suggest that this condition is optimal for EDM hole-drilling strain gage method.
In previous studies10–12) performed by the current group
demonstrated that the hole-drilling induced stress (IS) was
insensitive to the magnitude of the original residual stress within the specimens. Therefore, theISvalue obtained from
stress-free sample could be used to calibrate the value of the measured stress. As shown in eq. (3), the calibration procedure simply involves subtracting theISvalue from the
measured value of the residual stress, i.e.
(cal,min),(cal,max)¼(m,min),(m,max)IS: ð3Þ
However, the application of this calibration scheme requires the use of a extra measurement in order to determine the value of calibration factor (IS). Accordingly,
the objective of the current study is to enhance this correction scheme such that the calibration factor can be predicted directly by the properties of the specimen without the need for any auxiliary measurement. In a previous study by the current group,12) it was shown that of the various
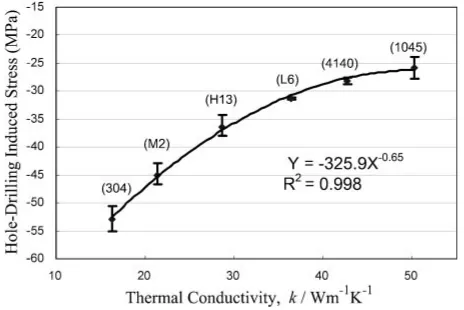
properties of a specimen, its thermal conductivity has the greatest effect on the EDM hole-drilling induced stress. In order to establish the relationship of the induced stress and thermal conductivity, a series of measurement experiments was performed using the optimal parameter setting of 12A/6ms/30ms in six different ferrous materials, namely AISI 1045, 4140, L6, H13, M2 and 304, respectively. From Fig. 8, it was found that this relationship, calculated by regression, had the form IS¼ 325:9k0:65, where
R2 ¼0:998. Substituting this expression into eq. (3) yielded the enhanced EDM hole-drilling strain gage calibration equation shown in eq. (4).
(cal,min),(cal,max)¼(m,min),(m,max)þ325:9k0:65
¼ ½ð"3þ"1Þ=4A ðð"3"1Þ2
þ ð"3þ"12"2Þ2Þ0:5=4B
þ325:9k0:65 ð4Þ
Since the thermal conductivity coefficient of various ferrous materials is readily available in the literature, and thus eq. (4) provides a highly convenient means to calibrate the measure-ment results obtained using the EDM hole-drilling strain gage method.
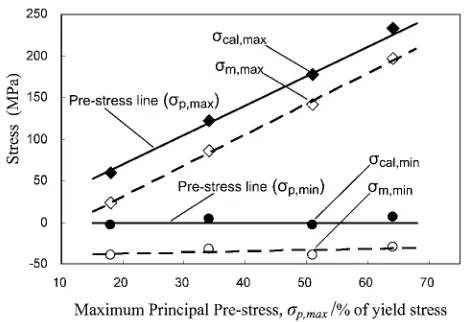
In order to evaluate the accuracy of the calibration equation given in eq. (4), various uniaxial pre-stress loadings were applied to stress-free AISI H13 specimens to simulate the presence of residual stress. In applying the pre-stress loading, the minimum stress was specified as P,min¼0,
while the maximum stress (P,max) was assigned values of
approximately 20%, 35%, 50% and 65%, respectively, of the yield stress of AISI H13 tool steel (ys¼350MPa). The
residual stress (i.e. the pre-stress) within each sample was then evaluated by conducting an EDM hole-drilling measure-ment process using the optimal parameter settings of 12A/ 6ms/30ms. Figure 9 illustrated the un-calibrated and cali-brated results of the measured stress. It can be seen that the measured stress (m,min, m,max) obtained from eq. (1) was
lower than the original pre-stress. The thermal conductivity coefficient of AISI H13 tool steel is 28.6 W m1K1.
Substituting this value into eq. (4), together with the strain data measured in the corresponding EDM hole-drilling process, yielded the calibrated residual stress values (cal,max,cal,min). Plotting these calibrated values in Fig. 9,
it was found that the maximum discrepancy between the calibrated results and the original pre-stress values was less than 10 MPa in every case. This deviation was well within the limit of 20MPa recommended in the Handbook of Measurement of Residual Stresses,16) and therefore
con-firmed the precision of the calibration scheme.
In this study, the idealCstavalue of 0.99–1 was obtained
only using parameter setting of 12A/6ms/30ms. In other words, it can be inferred that when drilling employed this EDM condition, pulse-off duration of 30ms was sufficient to allow the insulating properties of the dielectric fluid to be restored. By contrast, in the other four parameter settings, the
Fig. 7 Recast layer thickness for various combinations of IP=on=off
parameters. Note thatCstavalues for 12A/9ms/9ms and 4A/23ms/23ms
are 0.91 and 0.62, respectively. (material: AISI 1045).
[image:5.595.54.284.71.236.2] [image:5.595.311.543.73.228.2]pulse-off duration was too short to restore the insulating properties, and thus the secondary discharge phenomenon occurred and yielded a lowerCstavalue.
In order to further investigate the influence of pulse-off duration on Csta coefficient, a series of experiments was
performed where IP=on parameters were 12A/23ms, 12A/
9ms, 4A/23ms, and 4A/9ms, respectively. The experimental results showed that when the pulse-off duration exceeded 45ms, the value ofCstawas generally close to 0.99 in every
case. However, it was found that on occasions, the value of
Cstasuddenly dropped to a very low value and then oscillated
in an unstable state. The duration of each unstable state was around 3–5 seconds. It was conjectured that this phenomenon was a result of a poor removal of debris from the machining area during the drilling process. Accordingly, in a future study, the effects of the debris removal efficiency on the induced stress will be examined in order to enhance the robustness of the proposed measurement of residual stress.
4. Conclusions
The experimental results presented in this study support the following major conclusions:
(1) When the relative stability coefficient of the discharge duty ratio is kept within 0.99–1, the secondary dis-charge phenomenon is effectively suppressed with the result that the hole-drilling induced stress is reduced. (2) For the ferrous materials employed in the present study,
the suggested optimal drilling parameters for the EDM hole-drilling strain gage method are as follows: a pulse
current of 12A, a pulse-on duration of 6ms, and a pulse-off duration of 30ms.
(3) When performing the hole-drilling operation using the suggested parameter setting of 12A/6ms/30ms, the value of the hole-drilling induced stress (IS) is related
to the thermal conductivity coefficient (k) of the specimen via the following inverse power law relation-ship:IS¼ 325:9k0:65.
(4) When using EDM hole-drilling strain gage method to measure the residual stress, the measurement error caused by metallurgical transformation layer can be calibrated by applying the following calibration equation:
(cal,min),(cal,max)¼ ½ð"3þ"1Þ=4A ðð"3"1Þ2
þ ð"3þ"12"2Þ2Þ0:5=4B þ325:9k0:65:
(5) The calibrated values of the residual stress deviate from the true values by no more than 10 MPa. Consequently, the calibration scheme presented in this study provides a highly precise and convenient means of obtaining a significant improvement in the accuracy of the EDM hole-drilling strain gage method.
REFERENCES
1) ASTM Standard E837-95, Standard Test Method for Determining Residual Stresses by Hole-Drilling Strain Gage Method, (ASTM, Philadelphia, PA, USA, 1995).
2) H. T. Lee, F. C. Hsu and T. Y. Tai: Mater. Sci. Eng. A364(2004) 346–356.
3) M. T. Flaman and J. A. Herring: Exp. Tech.9(1985) 30–32. 4) M. Tootoonian and G. S. Schajer: Exp. Mech.35(1995) 124–129. 5) G. S. Schajer: Transactions of the ASME110(1988) 338–343. 6) M. T. Flaman and J. A. Herring: Exp. Tech.10(1986) 34–35. 7) B. Ekmekci: Appl. Surf. Sci.253(2007) 9234–9240.
8) J. C. Rebelo, A. M. Dias, D. Kremer and J. L. Lebrun: J. Mater. Process. Technol.84(1998) 90–96.
9) B. Ekmekci, A. E. Tekkaya and A. Erden: Int. J. Mach. Tools Manuf.
46(2006) 858–868.
10) H. T. Lee and F. C. Hsu: Mater. Sci. Technol.19(2003) 1261–1265. 11) H. T. Lee, W. P. Rehbach, F. C. Hsu, T. Y. Tai and E. Hsu: J. Mater.
Process. Technol.149(2004) 88–93.
12) H. T. Lee, J. Mayer and F. C. Hsu: Transactions of the ASME128
(2006) 468–475.
13) ASTM Standard E8M,Standard Test Methods for Tension Testing of Metallic Material (metric), (ASTM, Philadelphia, PA, USA, 1999). 14) S. Kher and A. Dua: SICE Annual, Proceedings of 38th Annual
conference, (1999) pp. 1047–1052.
15) R. L. Ott and M. Longnecker:Statistical Methods and Data Analysis, fifth ed., (Duxbury, CA, USA, 2001) pp. 93–96.
16) J. Lu:Handbook of Measurement of Residual Stresses, (Lilburn, GA, Fairmont Press, Inc., 1996) p. 229.
Fig. 9 Calibrated (cal,max, cal,min) and un-calibrated (m,min, m,max)
[image:6.595.52.285.69.230.2]