Munich Personal RePEc Archive
Growth and performance of Indian
mutual funds industry
Pandow, Bilal
University of Kashmir
15 April 2017
Growth and performance of Indian mutual funds industry
Bilal Ahmad Pandow
Research Scholar, Department of Business and Financial Studies, University of Kashmir.
Corresponding author’s email address: ibilalhussain@gmail.com
ABSTRACT
The Indian mutual fund industry has come a long way since its inception in 1963. The
industry witnessed sufficient growth on all parameters - the number of fund houses, the
number of schemes, funds mobilized, assets under management, etc. Given the critical
role of channeling household savings, the question is - has the Indian mutual industry
succeeded in achieving its’ goal? This study addresses this concern. The detailed nature of the current study suggests that the mutual fund industry has recorded significant
progress on all fronts yet it has not been able to utilize its potential fully. On almost on
all parameters, it is far behind the developed economies and even most of the emerging
economies of the world. Moreover, the industry faces a number of challenges like low
penetration ratio, lack of product differentiation, lack of investor awareness and ability to
communicate value to customers, lack of interest of retail investors towards mutual funds
and evolving nature of the industry. Based on the analysis the study suggests some
recommendation to address these challenges
Key Words:
INTRODUCTION
With the increasing emphasis in domestic savings and their mobilization and allocation
towards profitable investments, the need and scope of mutual fund operations has
increased. The mutual funds is one of the important classes of financial intermediaries
which enables millions of small and large savers spread across the country as well as
internationally to participate in and derive the benefits of the capital market growth. It is
an alternative vehicle of intermediation between the suppliers and users of investable
financial resources which is becoming increasingly popular in India and aboard due to
higher investor return and relativity low risk and cost. Thus the involvement of mutual
funds in the transformation of Indian economy has made it urgent to view their services
not only as financial intermediary but also as pace settlers as they are playing role in
mobilizing and efficient allocation of investable funds through markets. The fact is that
the mutual funds have a lot of potential to grow but to capitalize the potential fully, it
would need to create and market innovative products and frame distinct marketing
strategies. Moreover, the equity culture has not yet developed fully in the country as such,
investor education would be equally important for greater penetration of mutual funds.
The history of mutual funds dates back to 19th century with its origin to Great Britain.
Robert Fileming set-up in 1868 the first investment trust under the title ‘Foreign and
Colonial Investment Trust’ to manage the finances of moneyed classes of Scotland by
spreading the investment and other investment trusts which were subsequently set-up in
Britain and the US, resembled today’s close-ended mutual fund schemes. The first mutual
fund in the US namely, Massachusetts Investors’ Trusts, was set up in 1924. In India, the
mutual fund industry started in 1963, however, its history has been divided into four
phases.
Phase I (1964-87)
This phase started with setting up of Unit Trust of India (UTI), the first mutual fund set
up in the public sector under the UTI Act 1963, which launched its first unit scheme in
1964 namely US-64 with a major objective of mobilizing savings through the sale of units
and investing them in corporate securities for maximizing yields and capital appreciation.
It was the first open ended scheme and the most popular scheme in the history of mutual
to INR 219 crore in 1970-71 to INR 1,126 crores in 1980-81 and further to INR 5,068
crores in 1987. Its investor base as on 1987 had grown to about two million investors. In
1986 it launched its first equity growth fund which proved to be a grand marketing
success. In the same year it had also launched Indian Fund- the first Indian offshore fund
for overseas investors, which was listed on the London Stock Exchange (LSE). Being the
only mutual fund till 1987, UTI enjoyed monopoly in the market and had experienced a
consistent growth during this phase.
Phase II (1987-92)
The second phase witnessed the entry of other mutual funds sponsored by nationalized
banks and insurance companies. In 1987, State Bank of India (SBI) and Canara Bank
have set up SBI mutual fund and Canara Bank mutual fund under the Indian Trust Act,
1882. In 1988, UTI floated another offshore fund namely, The India Growth Fund which
was listed on the New York Stock Exchange (NYSE). By 1990, the two nationalized
insurance companies- LIC & GIC and three nationalized banks namely, Indian Bank,
Bank of India, and Punjab National Bank (PNB) have established wholly owned mutual
fund subsidiaries. In October 1989, the first regulatory guidelines were issues by RBI, but
these were applicable only to the mutual funds sponsored by banks. Subsequently, the
government of India issued comprehensive guidelines in 1990 which were applicable to
all mutual funds. With the entry of public sector funds during this phase, there was a
tremendous growth in the size of mutual fund industry with investible funds at market
value, increasing to INR 53,462 crores and the number of investors had increased to over
23 million. The buoyant equity markets in 1991-92 and the tax benefit under equity linked
saving schemes enhanced the attractiveness of equity funds during the Phase II.
Phase III (1992-97)
In this phase, two important developments have taken place in the Indian mutual fund
industry. One, that the mutual funds were brought under the ambit of SEBI which issued
Mutual Fund regulations in 1993 bringing all funds except UTI under a common
regulatory framework. Another development was the permission granted to private
domestic and foreign players to launch funds. Consequently Kothari group of companies,
in joint venture with Pioneer, a US fund company, set up the first private mutual fund in
funds were set up during this phase. UTI launched a new scheme namely: Master-gain in
1992 which was a phenomenal success with a subscription of INR 4,700 crore from 63
lakh applicants. With the opening up of mutual fund industry to private sector including
foreign players, the industry’s investible funds at market value increased to INR 78,655 crore and the number of investors increased to 50 million. However, during 1995 and
1996, the mutual fund industry witnessed a decline. During these two years, the unit
holders suffered from an erosion in the value of their investments due to a decline in the
Net Asset Values (NAVs) of the equity funds. A lack of performance of the Public Sector
Undertakings (PSU) funds and miserable failure of foreign funds like Morgan Stanley
eroded the confidence of investors in fund managers and their perception about mutual
funds turned negative. As a result of this, the average annual sales of mutual funds
declined from about INR 13,000 crores in 1919-94 to about INR 9,000 crore in 1995 and
1996.
Phase IV (1997 onwards)
This phase was characterized by a more positive sentiment in the capital market, tax
benefits to the investments in funds and improved quality of investor services by the
mutual funds. As a result there has been a significant growth in the flow of funds in to the
mutual funds. Investable funds, at market value of the industry rose to INR 1,10,000 crore
in 2000 with UTI having 68 percent of market share. However, the UTI dropped a
bombshell in 2000-01 on the investing public by disclosing the NAV of US-64 just at
INR 5.81 as against the face value of INR 10.00 per unit which reversed the growing
trend of fund flows towards the mutual fund industry. In fact this was the biggest shock
of the year to the investors. Coupled with this, the crumbling global equity markets, a
sluggish economy coupled with some bad investment decisions made life tough for big
funds across the world in 2001-02. The consequences of this were also felt strongly in
India as well. Owing to this, pioneer ITI, JP Morgan and Newton Investment management
pulled out of Indian market and Bank of India mutual fund liquidated all its assets in 2002.
Moreover, due to the growing competition both from Public and Private sector MFs and
consequently upon the debacle of US-64, UTI lost most of its market share to other funds.
Post 2004, the industry witnessed several mergers and acquisitions. Besides many more
fund etc. These developments and the positive sentiment in the equity market since 2005
to 2008 have taken the mutual fund industry out of stagnation.
GROWTH AND DEVELOPMENT OF MUTUAL FUNDS IN INDIA
The Mutual funds industry that started its journey in the country in 1963 has turned as
one of the important constituents of the financial sector. The industry has witnessed
sufficient expansion and standardization in terms of products and services offered,
regulatory mechanism, and the proliferation of large number of private sector funds both
domestic and foreign. The fact is that the fund market in the country has graduated from
offering plain vanilla equity and debt funds, to an array of diverse products such as Gold
Funds (GF), Exchange Traded Funds (ETFs), and capital protection oriented funds and
even the native funds (Fozia, 2013). Truly, the mutual fund industry in the country has
come from long-way but the moot question is that whether it has realized its potential
fully. In order to answer this question, we would need to critically analyze its growth. For
this purpose in the following para’s the growth that the mutual funds industry has
achieved over a certain period of time has been analyzed in respect of the following
parameters:
Number of funds
Fund Schemes offered
Mobilization of Funds
Assets Under Management
Household Savings mobilized
Performance of AMCs in terms of earnings and profitability
GROWTH IN NUMBER OF FUNDS
As already stated that the first mutual fund namely UTI was established in 1963 which
dominated the industry in the country till 1992. With the entry of other public sector and
private sector funds, it gradually lost its dominance. As can be seen from Table 1.1 that
the number of mutual funds which were 31 in 1997-98 have grown to 41 in 2010-11 at a
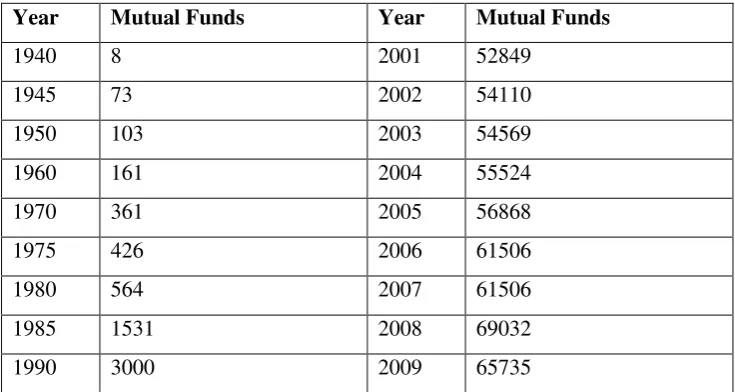
other emerging economies of the world. As compared to 2 percent growth rate in India,
the mutual fund industry worldwide has registered a compound growth rate of 40 percent
during 1990-2009 as becomes clear from the data detailed in Table 1.2. During the said
period, the number of private sector funds have grown from 21 funds in 1997-98 to 35
funds in 2010-11 at a compound growth rate of 4 percent. Compared to this, the public
sector funds have witnessed a significant decline. The number of funds which were 10 in
1997-98 has declined to 6 funds in 2010-11 at a negative compound growth rate of 4
percent. What emerges from the date detailed in Table 1.1 is that during the period
between 1997-98 to 2010-11 mutual fund industry in India was characterized by a
significant decline in the number public sector funds and somewhat sufficient growth in
the private sector funds. As on 2011 the mutual fund industry in the country is dominated
by the private sector funds. Though India has achieved sufficient growth in the number
of fund houses over a period of time but the mutual funds market is highly concentrated.
Out of the 44 AMCs operating in India, approximately 80 percent, of the AUM is
concentrated with 11 leading players in the market. These funds includes HDFC Mutual
Fund (13 percent), Reliance Mutual Fund (12 percent), ICICI Prudential (10 percent),
UTI (9 percent), Birla Sun Life (9 percent), SBI Mutual Funds(7 percent), Franklin
Templeton (5 percent), IDFC Mutual Fund (5 percent), Kotak Mahindra Mutual Fund (4
percent), DSP Black Rock Mutual Fund (4 percent) and Axis Mutual Fund (2 percent).
The remaining 33 Mutual Funds account for 20 percent of AUMs as on 2013. The
remaining 33 mutual funds account for 20 percent of AUMs as on 2013. This is indicative
of the fact that the market is highly concentrated. Therefore, for the healthy growth of the
industry, the need is to see the disbursement of the business across the fund houses.
Table 1.1: Growth in Number of Mutual Funds (Sector-Wise)
Year Public Sector Private Sector Total CAGR (In %age)
1997-98 10 21 31
1998-99 10 22 32 3
1999-00 11 21 32 0
2001-02 10 25 35 0
2002-03 9 24 33 -6
2003-04 8 23 31 -6
2004-05 6 23 29 -6
2005-06 5 24 29 0
2006-07 5 25 30 3
2007-08 5 28 33 10
2008-09 5 30 35 6
2009-10 5 33 38 9
2010-11 6 35 41 8
CGR
(In %age) -4 4 2
[image:8.595.128.496.392.588.2]Note: CAGR stands for compound annual growth rate & CGR stands for compound growth rate. Source: Figures compiled from AMFI Reports
Table 1.2: Total Number of Mutual Funds/Schemes around the world
Year Mutual Funds Year Mutual Funds
1940 8 2001 52849
1945 73 2002 54110 1950 103 2003 54569 1960 161 2004 55524 1970 361 2005 56868 1975 426 2006 61506 1980 564 2007 61506 1985 1531 2008 69032 1990 3000 2009 65735
Source: Mutual Fund Fact Book, 1990, SEBI Handbook of Statistics
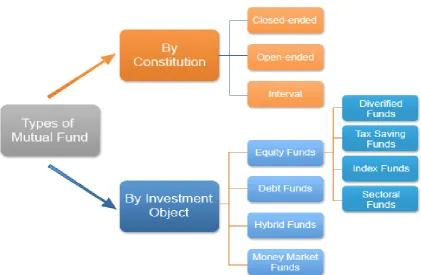
GROWTH IN NUMBER OF SCHEMES
Mutual funds offer family of schemes to suit varying needs of investors. The different
schemes offered are classified on the basis of their structure (Liquidity) into open ended
funds and close ended funds. Based on the investment objective, these schemes are further
saving, Gilt funds and money market mutual funds. The list of different types of fund/
[image:9.595.101.523.152.427.2]schemes are given in Figure 1.1.
Fig. 1.1: Different Types of Fund Schemes
Source: AMFI website
To meet the varying needs of the investing public, the mutual fund companies in the
country have been continuously launching new schemes. As becomes clear from the data
detailed out in Table 1.3 that throughout the period under study (1997-98 to 2010-11)
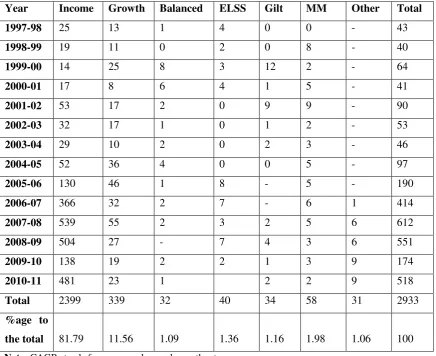
2,933 new schemes have been launched. The maximum number of new schemes i.e. 2269
or 77.36 percent of the schemes have been launched during 2006-07 to 2010-11. The
launching of new schemes have grown at a compound rate of 23 percent from 1997-98 to
2010-11. Majority of the new scheme launched during the period included Regular
Income Scheme (81.79 percent) and Growth Schemes (11.56 percent). As becomes clear
from the data detailed in Table 1.3 the two schemes together accounted for 93.35 percent
of new schemes launched during the period. The rest of the schemes, i.e. Balanced, Equity
Linked Saving Scheme (ELSS) Gilt, Money Market (MM) and other schemes accounted
for 1.09 percent, 1.36 percent, 1.16 percent, 1.98 percent and 1.06 percent of the new
Indian mutual fund industry has launched good number of new schemes, however,
majority of the new schemes launched during the period were Regular Income Schemes
[image:10.595.95.532.171.527.2]followed by Growth Schemes.
Table 1.3: New Schemes Launched (category wise)
Year Income Growth Balanced ELSS Gilt MM Other Total
1997-98 25 13 1 4 0 0 - 43
1998-99 19 11 0 2 0 8 - 40
1999-00 14 25 8 3 12 2 - 64
2000-01 17 8 6 4 1 5 - 41
2001-02 53 17 2 0 9 9 - 90
2002-03 32 17 1 0 1 2 - 53
2003-04 29 10 2 0 2 3 - 46
2004-05 52 36 4 0 0 5 - 97
2005-06 130 46 1 8 - 5 - 190
2006-07 366 32 2 7 - 6 1 414
2007-08 539 55 2 3 2 5 6 612
2008-09 504 27 - 7 4 3 6 551
2009-10 138 19 2 2 1 3 9 174
2010-11 481 23 1 2 2 9 518
Total 2399 339 32 40 34 58 31 2933
%age to
the total 81.79 11.56 1.09 1.36 1.16 1.98 1.06 100
Note: CAGR stands for compound annual growth rate. Source: Figures compiled from AMFI Reports
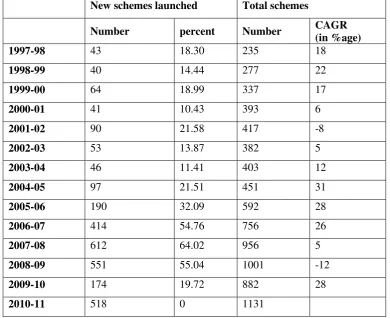
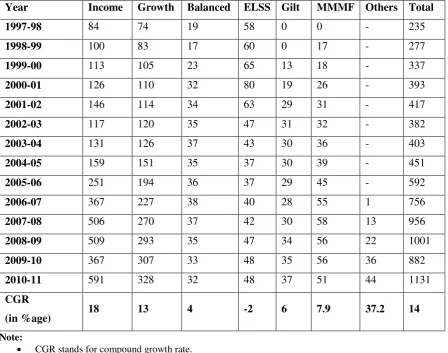
Perusal of data detailed out in Table 1.4 also reveals that the total number of schemes in
operation have grown from 235 schemes in 1997-98 to 1,131 schemes at a compound
growth rate of 14 percent which compares well with the growth rates of other developing
economies. Category-wise, Income, Growth, Balanced, Gilt, Money Market and other
schemes have grown at a compound growth rate of 18 percent, 13 percent, 4 percent, 6
percent, 7.9 percent and 37.2 percent respectively as becomes clear from the data detailed
out in Table 1.5. It can also be seen from the above referred table that ELSS is the only
scheme which has recorded negative compound growth rate of 2 percent in the number
2010-11 are dominated by regular income scheme which account of 52.25 percent of the
total schemes in operation. The growth scheme as on 2010-11 accounted for 29 percent
of the total schemes in operation. As such these two schemes accounted for 81.25 percent
of the total schemes in operation in 2010-11 and rest of the schemes namely Balanced,
ELSS, Gilt, Money Market and other schemes accounted for 2.82 percent, 4.24 percent,
3.27 percent, 4.51 percent and 3.89 percent respectively. Thus it can be safely concluded
that the scene in the Indian mutual fund industry is dominated by the Regular Income
Schemes followed by the Growth Schemes right through the period under study i.e.
[image:11.595.117.508.298.616.2]1997-98 to 2010-11.
Table 1.4: New Schemes Launched & Total Schemes in Operation
New schemes launched Total schemes
Number percent Number CAGR (in %age)
1997-98 43 18.30 235 18
1998-99 40 14.44 277 22
1999-00 64 18.99 337 17
2000-01 41 10.43 393 6
2001-02 90 21.58 417 -8
2002-03 53 13.87 382 5
2003-04 46 11.41 403 12
2004-05 97 21.51 451 31
2005-06 190 32.09 592 28
2006-07 414 54.76 756 26
2007-08 612 64.02 956 5
2008-09 551 55.04 1001 -12
2009-10 174 19.72 882 28
2010-11 518 0 1131
Table 1.5: Total Schemes in Operation Category Wise
Year Income Growth Balanced ELSS Gilt MMMF Others Total
1997-98 84 74 19 58 0 0 - 235
1998-99 100 83 17 60 0 17 - 277
1999-00 113 105 23 65 13 18 - 337
2000-01 126 110 32 80 19 26 - 393
2001-02 146 114 34 63 29 31 - 417
2002-03 117 120 35 47 31 32 - 382
2003-04 131 126 37 43 30 36 - 403
2004-05 159 151 35 37 30 39 - 451
2005-06 251 194 36 37 29 45 - 592
2006-07 367 227 38 40 28 55 1 756
2007-08 506 270 37 42 30 58 13 956
2008-09 509 293 35 47 34 56 22 1001
2009-10 367 307 33 48 35 56 36 882
2010-11 591 328 32 48 37 51 44 1131
CGR
(in %age) 18 13 4 -2 6 7.9 37.2 14
Note:
CGR stands for compound growth rate. ELSS stands for equity linked saving scheme MMMF stands for money market mutual funds Source: Figures Compiled from AMFI Reports
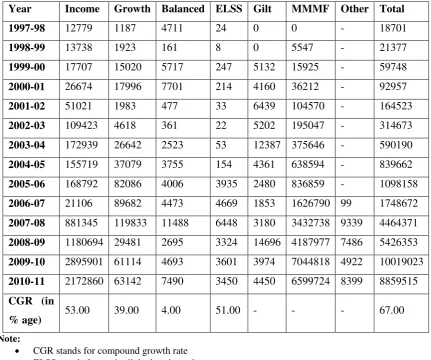
FUNDS MOBILIZED
Launching more and more new schemes are aimed at meeting the varied needs of the
investing public in order to mobilize more funds. As such launching new schemes serves
the purpose only when such schemes have enabled to mobilize more and more funds. The
total funds raised by the mutual fund industry in the country has increased from INR
18,701 crores in 1997-98 to INR 88,59,515 crores in 2010-11 thereby having registered
a compound growth rate of 67 percent as becomes clear from Table 1.6. It can be seen
from the said table that public sector mutual funds were major mobiliser of funds in the
years 1997-98 and 1998-99 accounting for 82.69 percent and 65.50 percent respectively
of the total funds mobilized. After 1998-99, the private sector mutual funds dominated
accounted for just 34.50 percent of the total funds mobilized in 1998-97 have increased
its share to 71.40 percent in 1999-00 which kept increasing up to 2003-04 to 90.59
percent. However, the share of private sector mutual funds declined after 2003-04 to
76.84 percent of the total funds mobilized in 2009-10. But surprisingly in 2010-11 the
share of private sector mutual funds declined sharply to 21.86 percent only which seems
to be an exceptional event. What emerges from the above is that mutual industry in the
country has witnessed some growth in the amount of funds mobilized over the period
under study. Further, private sector funds which accounted for little portion of the funds
mobilized in 1997-98, have overtaken public sector funds significantly and till 2009-10
these funds occupied dominant place with respect to the mobilization of funds. Category
wise: Regular Income Funds accounted for major portion of the funds mobilized in the
years from 1997-98 to 1999-00 with a total contribution of 68.33 percent, 64.27 percent
and 29.64 percent respectively followed by Balance Funds in 1997-98 which accounted
for 25.19 percent. In 1998-99, the other major contributor was Money Market Funds
which accounted for 25.95 percent of the total funds mobilized. After 2000-01, most of
the funds in the industry were mobilized in Money Market Funds whose share in
1998-99 was 25.95 which had increased to 83.92 percent in 2006-07 and as on 2010-11 it
remained at 74.49 percent. As against this the Income Scheme which accounted for a
major portion of the funds mobilized in 1997-98 had witnessed a steady decline in its
share of funds mobilized during the reference period (1997-98 to 2010-11). Its share had
declined from 68.33 percent in 1997-98 to a low of 10.89 percent in 2006-07 and as on
today it accounted for 24.52 percent only. After 2000-01 the other schemes namely
Growth, Balanced, ELSS, Gilt, Money Market and other schemes contributed very little
to the total funds mobilized. The combined share of these schemes ranged only between
4 to 5 percent which is negligible by all standards. From the above discussion, two
inferences can be drawn that over a period of time, the Money Market Mutual Funds
(MMMF) emerged as a major contributor to the funds mobilized and since 2000-01 it
continues to dominate the industry in terms of funds mobilized. Contrary, the Income
Scheme which was initially dominant schemes gradually lost its ground to the MMMF
and had witnessed a sharp decline in the share of funds mobilized during the period.
Among other schemes, except ELSS and Growth Schemes, all other schemes have
registered sufficient growth in the funds mobilized during the period but right from the
beginning ELSS Scheme accounted for very little portion of the funds mobilized, but is
gaining popularity. The Growth Scheme which continued to be one of the important
schemes till 2000-01 witnessed significant decline in its share to the total funds mobilized
[image:14.595.102.534.225.585.2]by the industry and as on 2010-11 its contribution has been negligible.
Table 1.6: Category Wise Funds Raised by Total Schemes in Operation
(INR in Crores)
Year Income Growth Balanced ELSS Gilt MMMF Other Total
1997-98 12779 1187 4711 24 0 0 - 18701
1998-99 13738 1923 161 8 0 5547 - 21377
1999-00 17707 15020 5717 247 5132 15925 - 59748
2000-01 26674 17996 7701 214 4160 36212 - 92957
2001-02 51021 1983 477 33 6439 104570 - 164523
2002-03 109423 4618 361 22 5202 195047 - 314673
2003-04 172939 26642 2523 53 12387 375646 - 590190
2004-05 155719 37079 3755 154 4361 638594 - 839662
2005-06 168792 82086 4006 3935 2480 836859 - 1098158
2006-07 21106 89682 4473 4669 1853 1626790 99 1748672
2007-08 881345 119833 11488 6448 3180 3432738 9339 4464371
2008-09 1180694 29481 2695 3324 14696 4187977 7486 5426353
2009-10 2895901 61114 4693 3601 3974 7044818 4922 10019023
2010-11 2172860 63142 7490 3450 4450 6599724 8399 8859515
CGR (in
% age) 53.00 39.00 4.00 51.00 - - - 67.00
Note:
CGR stands for compound growth rate ELSS stands for equity linked saving scheme MMMF stands for money market mutual funds Others include Gold ETF, other ETF & FOF overseas Source: Figures Compiled from AMFI Reports
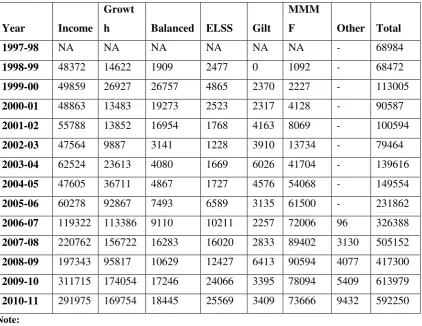
ASSETS UNDER MANAGEMENT OF MUTUAL FUNDS
Mutual Funds are expected to play a crucial role of mobilizing particularly household
savings and to manage the funds efficiently so as to provide sufficient return to the
above referred lines yet, over a period of time it has achieved some noticeable growth &
development. As becomes clear from the data detailed in Table 1.7 that the net assets
under the management of mutual funds have increased from INR 68,984 crore in
1997-98 to INR 5,92,250 crore in 2010-11 at a compound growth rate of 20 percent. It can also
be seen from the above referred table that during the reference period, the maximum
growth has been recorded by the private sector mutual funds and the public sector mutual
funds have gained little growth. The private sector mutual funds have recorded a
compound growth rate of 48 percent in the net assets under its management during the
period 1997-98 to 2010-11. Compared to this phenomenal growth rate, the net assets
under the management of public sector mutual funds have grown just at a compound
growth rate of 6 percent during the same period which by all means is dismal. Of the two
sectors, the public sector mutual funds have witnessed a sharp decline in its share of the
total net assets under the management of mutual funds. From the data presented in Table
1.7 reveals that 94.07 percent of the total assets were under the management of public
sector funds in 1997-98 which had declined to 22.1 percent in 2010-11. This sharp decline
is due to the increasing dominance of the private sector mutual funds in India. The private
sector mutual funds which were an insignificant player in the industry in 1997-98 with a
total share of 5.93 percent of the total assets under its management, have witnessed
significant spurt in its business share. The assets under its management have witnessed
an increasing trend and have increased from 5.93 percent in 1997-98 to 77.9 percent in
2010-11. The fact that becomes evident from the data presented in Table 1.7 is that the
public sector mutual funds have lost its dominating role to the private sector mutual funds.
Based on multiple parameters, the private sector mutual funds as on 2011 are major and
Table 1.7: Assets Under Management as on March 31 Category Wise
Year Income
Growt
h Balanced ELSS Gilt
MMM
F Other Total
1997-98 NA NA NA NA NA NA - 68984
1998-99 48372 14622 1909 2477 0 1092 - 68472
1999-00 49859 26927 26757 4865 2370 2227 - 113005
2000-01 48863 13483 19273 2523 2317 4128 - 90587
2001-02 55788 13852 16954 1768 4163 8069 - 100594
2002-03 47564 9887 3141 1228 3910 13734 - 79464
2003-04 62524 23613 4080 1669 6026 41704 - 139616
2004-05 47605 36711 4867 1727 4576 54068 - 149554
2005-06 60278 92867 7493 6589 3135 61500 - 231862
2006-07 119322 113386 9110 10211 2257 72006 96 326388
2007-08 220762 156722 16283 16020 2833 89402 3130 505152
2008-09 197343 95817 10629 12427 6413 90594 4077 417300
2009-10 311715 174054 17246 24066 3395 78094 5409 613979
2010-11 291975 169754 18445 25569 3409 73666 9432 592250
Note:
ELSS stands for equity linked saving scheme MMMF stands for money market mutual funds Others include Gold ETF, other ETF & FOF overseas Source: Figures Compiled from AMFI Reports
AUM Composition by Product, Investor and Geographical Distribution
The product category of Indian mutual fund is broadly classified into six categories
namely: Liquid/Money Market, Equity Oriented, Debt Oriented, Balanced, Gilt and Gold
ETFS. Gilt category constitute a major position of the AUMs as on 2013. It can be seen
from figure 1.2 that Debt Oriented accounted for 57 percent of the AUMs as on 2013, and
its share has increased from 50 percent in 2011 to 57 percent in 2013. The share of Gilt
and Liquid/Money Market segment which was negligible at one point of time is showing
an increasing trend and as on 2013, it accounted for 16 percent of the total AUMs. The
Equity Oriented Funds account for only 22 percent of the total AUMs as on 2013.
Compared to this the Balanced Schemes account for 2 percent of AUM. It becomes quite
and Liquid/Money Market. The other fact is that the Debt Oriented Funds have recorded
significant growth during the last few years. These have recorded significant growth due
to the popularity of gold as an investment for Indians as well as due to lowering of
[image:17.595.99.520.196.373.2]administrative charges.
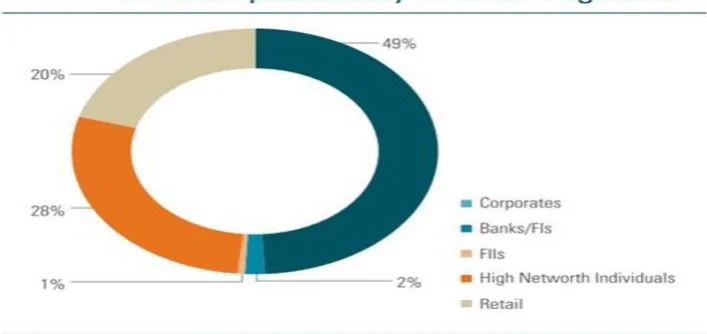
Figure 1.2
Figure 1.3
While looking at the AUM composition by investor segment, it can be seen from figure
1.3 that corporate investments constitute 49 percent of AUM followed by High Net Worth
[image:17.595.127.481.463.630.2]than the equity. The retail investments account for 20 percent of AUM. These also prefer
debt oriented funds rather than equity.
As on 2013, out of the total Equity AUM, Retail investment constitute mere 1.95 percent,
which is indicative of poor Equity culture among the retail investing public in the country.
Equity AUM mainly consists of FII investment.
As such on the basis of the above, it can be concluded that the mutual funds have not yet
achieved a breakthrough in penetrating deep into the retail segment. Retail investors in
the country continue to prefer bank deposits and the real estate sector as viable investment
[image:18.595.103.519.306.556.2]avenues for putting their savings.
Figure 1.4
The poor participation of retail segment through mutual fund route is due to very low
levels of awareness & financial literacy, shown capital market growth, and the cultural &
behavioral factors. The other important factor is the failure of the mutual fund industry to
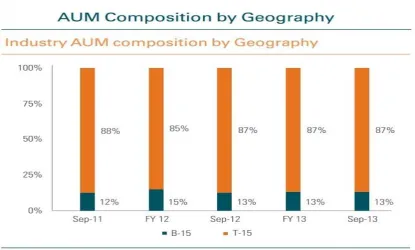
penetrate across the cities and towns of the country. As can be seen from Figure 1.4 that
top five cities namely Mumbai, Delhi, Chennai, Bangalore and Calcutta contribute 74
percent of the total funds mobalised. All other remaining cities contribute with 26 percent
penetration ratio is need of the hour. The key to combating this challenge is to ensure a
wider distribution reach and greater investor awareness through investor education drives.
MOBILIZATION OF HOUSEHOLD SAVINGS
The earlier discussion has made it clear that the Indian mutual fund industry has come a
long way since 1963 when the first mutual fund was established by the UTI. Today, there
are 51 mutual funds belonging to public sector, domestic private sector and foreign
private sector funds offering wide variety of schemes and products to the investing public
at the national and international level. Over a period of time significant innovations have
been made in its product profile to meet the varied needs of the investing public. But the
question is has the Indian mutual industry fully realized its goal of mobilizing major
portion of household savings or enabled the small savers to benefit from the economic
growth that the country has been witnessing by facilitating them to park their savings into
the assets which yield better risk-adjusted returns.
According to the World Bank, Gross domestic savings (percent of GDP) in India was last
measured at 29 in 2011. Gross domestic savings are calculated as GDP less final
[image:19.595.122.514.472.658.2]consumption expenditure (total consumption).
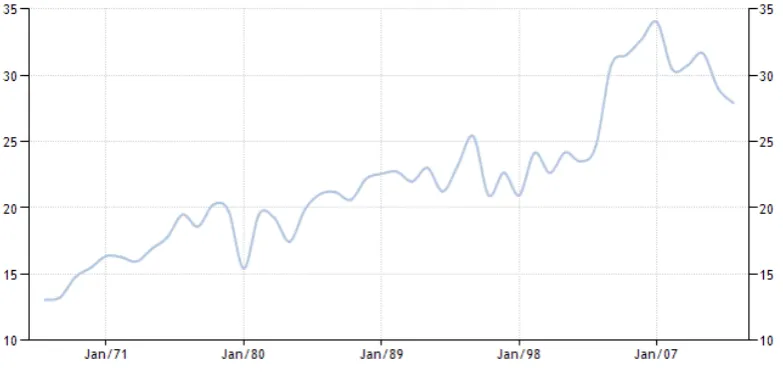
Figure 1.5: Gross domestic savings ( percent of GDP) in India
Gross Domestic Savings (GDS) as a percentage of Gross Domestic Product (GDP) in
India is highest in the world. Perusal of figure 1.5 reveals that as on 2009-10, the GDS as
a percentage of GDP is 33.7 percent which was just 16.9 percent in 1975-76. From the
data presented in the above mentioned table it becomes clear that India has witnessed a
steady growth in GDS as a percentage of GDP which was 16.9 percent in 1975-76, had
increased gradually to 24.4 percent in 1995-96 then declined marginally to 23.7 percent
in 2001-02. In the first part of the decade of 2001, it has recorded significant growth from
23.7 percent in 2001-02 to 34.2 percent in 2005-06. The other fact that becomes clear
from the data presented in the table is that the major contribution to GDS in the country
has remained from House Hold Sector (HHS) right from the beginning. It can be seen
from the table that as on 2009-10, the HHS accounted for 69.7 percent of the total GDS
which had peaked to 93 percent in 2001-02. The other fact that emerges from the data is
that the HHS has recorded a steady growth in its contribution to GDS. The share of HHS
was 64 percent in 1975-76 which had increased to 93 percent in 2001-02. However,
between 1975-76 to 2009-10 it had remained in the range between 64 percent to 93
percent. What emerges from the above is that the GDS as a percentage of GDP has
[image:20.595.116.521.516.700.2]recorded steady growth and most of the savings come from the HHS in the country.
Figure 1.6
Source: Compiled from AMFI reports
4.75
6.48
7.9
10.13
7.47
9.37
0 2 4 6 8 10 12
Sufficient and increasing GDS will serve the purpose only when the savings are
channelized into productive assets. The financial institutions have a role to play in this
direction. Since mutual funds are one of the important financial intermediaries whose role
in the mobilization of household savings in particular is crucial. Mutual fund industry in
the country has come a long way to assist the transfer of HHS to the real sector of the
economy. This fact becomes evident from the increasing share of Assets Under the
Management (AUM) of mutual funds to GDP. As indicated by the Figure 1.6 that the
ratio of AUM to GDP increased gradually from 4.75 percent in 2004-05 to 9.37 percent
in 2009-10. However, the ratio of 9.37 percent is significantly lower than the ratio of
AUM to GDP in developed countries of the world where it ranges between 20 percent to
70 percent. Among the category of emerging economics, Brazil has AUM to GDP ratio
of 40 percent and around 33 percent for South Africa. As such the mutual fund industry
has to go a long way in fully realizing its role of mobilizing savings particularly of the
HHS.
The House Hold Sector saves in the form of currency, bank and non-banking deposits,
life insurance fund, provident and pension fund claims on government, and shares &
debentures. For economic growth, it is necessary that the savings are held in financial
assets such as deposits, shares & debentures; and in the form of contractual savings rather
than in currency which is likely to result in the creation of unproductive assets like gold.
Further, direct transfer of savings is preferred for the reason being less costly. For direct
transfers through the instruments of shares & debentures, the mutual fund route is being
encouraged for safety and other reasons. Owing to this fact, number of measures were
Table 1.8: Instrument-wise Distribution of Household financial Assets (in percent)
Financial Assets 96-97 01-02 02-03 03-04 04-05 05-06 06-07 07-08 08-09 09-10 10-11
Currency 8.6 9.7 8.9 11.2 8.5 8.7 10.2 11.4 12.7 9.8 13.3
Fixed Income
(a+b+C) 84.5 81.8 86.9 81.6 85.4 84 80.6 78.2 88 85.6 87.1 a) Deposits 48.1 39.4 40.9 38.8 37.0 47.1 49.1 52.2 60.7 47.2 47.3
b) Insurance/ Provident Fund 29.4 30.3 31.1 27.3 28.9 24.7 28.8 27.9 31.1 34.1 33.3
c) Small Savings 7 12.1 14.9 15.5 19.5 12.2 2.7 -1.9 -3.8 4.3 6.5
Securities market (d+e+f) 7 8.5 4.2 7.5 6 7.3 9.3 10.3 -3.5 4.6 -4
d) Mutual funds 0.3 1.8 1.3 1.2 0.4 3.6 5.3 7.9 -1.4 3.3 -1.8
e) Govt. Securities 0.4 5.8 2.5 7.5 4.9 2.4 0.3 -2.1 0.0 0.0 0
f) Other securities 6.3 0.9 0.4 -1.2 0.7 1.3 3.7 4.5 -2.1 1.3 -2.2
Total 100 100 100 100 100 100 100 100 100 100
Perusal of data about the household sectors financial assets portfolio detailed out in Table
1.8 reveals that households held a large proportion of their savings in the form of deposits
(both banking & non-banking). As can be seen from the above stated table that the
deposits which were 48.1 percent in 1996-97 have decreased to 37 percent in 2004-05
and then increased to 52.2 percent and 60.7 percent in 2006-07 and 2007-08 respectively.
The spurt in bank deposits in 2006-08 was due to a recession in the Indian capital market
during the period, however the fact that becomes clear is that the bank deposits continues
to constitute a major form in which house hold savings are held in India throughout the
period 1996-97 to 2010-11. The other fact is that it has witnessed a marginal decline from
48.1 percent in 1996-97 to 47.3 percent in 2010-11 of total household savings. It can also
be seen from the Table 1.9 that the contractual savings or savings under provident fund
schemes, pension and life insurance funds were the next preferred form of savings for the
Indian savers during the period. As such it can be concluded that mutual funds is not the
preferred choice for household sector for parking savings. Therefore, the need of the hour
is that the mutual fund industry is to find out ways and means for attracting more and
more funds from the house hold sector, which carries a great socio-economic sense.
CONCLUSION
The Indian mutual fund industry has come a long way since its inception in 1963. The
industry has witnessed sufficient growth on all parameters be it; number of fund houses,
No. of schemes, funds mobalised, assets under management etc. The fund industry in the
beginning consisted of UTI mutual fund only, but today the industry consists of all the
three sectors viz. public sector, private sector and foreign fund houses. The fund houses
which were just 31 in 1997-98, have grown to 44 funds as on 2013. Similarly the number
of schemes in operation have grown from 235 in 1997-98 to 1,131 schemes at a
compound growth rate of 14 percent. The major schemes in operation are regular Income
Schemes which account for 52 percent of the total schemes, followed by Growth Schemes
with 29 percent of the total schemes. ELSS is the only scheme which has recorded
negative growth during the period.
The total funds raised by the industry in the country has increased from INR 18,701crore
in 1997-98 to INR 88,59,515 crore in 2010-11 at a compound growth rate of 67 percent.
66 percent share, but 1999 onwards, private sector mutual funds dominated the industry
in terms of funds mobalised with a share of 90.59 percent as on 2003-04.
The Money Market Mutual Fund (MMMFs) emerged as a major contributor to the funds
mobalised and since 2000-01 it continues to dominate the industry in terms of funds
mobalised. Contrary the Income Scheme which was initially the major contributor, has
gradually lost its ground to the MMMFs.
In terms of Assets Under Management (AUM), the industry recorded significant growth.
The net assets under the management have increased from INR 68,984 crore in 1997-98
to INR 5,92,250 crore in 2010-11 at a compound rate of 20 percent. Category-wise, the
private sector funds have recorded a compound growth rate of 48 percent as against the
growth rate of 6 percent by the public sector funds, indicating thereby that the dominating
place of private sector funds which at one point of time accounted for only 5.93 percent
of AUMs which as on 2010-11 account for 77.9 percent. One thing that is evident, is that
in-terms of AUMs, mutual fund industry has recorded more than satisfactory growth
since its inception, however, the growth is more pronounced towards the private sector
funds and the public sector funds which dominated the fund industry in the country, have
been overtaken by the private sector funds.
Product wise Indian fund industry is broadly consisted of six product categories viz.
Liquid & Money Market, Equity Oriented, Debt Oriented, Balanced, Gilt and Gold ETFs.
The industry is dominated by Gilt and Liquid Money Market and these product categories
account for around 73 percent of AUMs in 2013. The equity oriented funds account for
only 1 percent of the total AUMs as on 2013. Besides, the Gold ETFs have recorded
significant growth during the last few years from a much smaller base.
While looking at AUM composition by investor segment, corporate investments
constitute nearly half of the AUMs, followed by high net worth investors. The retail
segment account for just 20 percent of AUMs. As such, it can be inferred that the mutual
funds have failed to penetrate deep into the retail segment. Retail investors in the country
continue to prefer bank deposits and the real estate sector. The poor participation of the
retail segment through mutual funds is reported due to very low levels of awareness in
financial literacy, cultural and behavioral factors. The other important factor is the failure
five cities namely: Mumbai, Delhi, Chennai, Bangalore and Kolkata contribute 74
percent of the total funds mobalised. Therefore, among other things, the need is to
increase the penetration ratio.
One of the important goals of the mutual fund industry is to attract and mobalise major
portion of the House Hold Savings (HHS) in order to enable the small savers to benefit
from the economic growth by facilitating them to park their savings into the assets which
yield better risk-adjusted returns. Therefore, the question arises, has the Indian mutual
industry succeeded in achieving this goal? The fact about it is that the Gross Domestic
Saving (GDS) as a percentage of GDP has recorded significant growth and the HHS
account for three quarter of the GDS. Although the mutual fund industry has succeeded
in increasing its share from the GDS but the ratio of AUM to GDP is much lower than
the developed countries of the world. Further, the house hold sector which account for
major position of the Gross Domestic Savings have shown least preference for mutual
funds, rather these have been found to prefer most deposits, both banking and
non-banking.
Though, the mutual fund industry has recorded significant progress on all fronts yet it has
not been able to utilize its potential fully. On almost on all parameters it is far behind the
developed economics and even most of the emerging economics of the world. The
industry is confronted with number of challenges like low penetration ratio, lack of
product differentiation, lack of investor awareness and ability to communicate value to
customers, lack of interest of retail investors towards mutual funds and evolving nature
of the industry. Therefore, if the industry has to utilize its potential fully, it has to address
these challenges. To address these challenges the need is to penetrate into the tier II &
tier III cities which among other things would require to seek more awareness of the
investors through strategic initiatives and investor education drives. Apart from this, the
mutual fund industry has to continually deliver superior risk-adjusted returns to the
investors. This would require the fund managers on the one hand to exhibit superior stock
selectivity and market timing performance consistently and on the other hand to keep the
fund costs under check. Delivering superior risk-adjusted returns consistently will
REFERENCES
1. Ajte, R, and Jovanovic, B, (1993) "Stock Markets and Development", European
Economic Review", 37, pp.632-40.
2. Allen, Franklin and Douglas Gale, (2000), Comparing Financial System,
Cambridge, MA; MIT Press
3. Arestis, P., Demetriades, P. & Luintel, K. (2001). Financial Development and
Economic Growth: The Role of Stock Markets. Journal of Money, Credit, &
Banking, 33, 16-41
4. Arnold, L and U Walz, (2000), Financial Regimes, Capital Structure and
Growth", European Economic Review, 16, pp. 491-508
5. Boyd, John and Edward Prescott (1986), "Financial Intermediary Coalitions,"
Journal of Economic Theory 38, 211-232
6. Cho (1986). "Financial Development and Economic Growth: Views and
Agenda", Journal of Economic Literature, Vol. 35, June 1997, p. 691
7. Demirguc Kunt, A and R Levine, (1999), Bank-based and Market-based
Financial Systems: Cross Country Comparisons, World Bank Policy Research
Working Paper No. 2143
8. Demtriade, Panicos O and Khalied, A Hussain, (1996), "Does Financial
Development Cause Economic Growth," Journal of Development Economics,
Vol. 51, pp.387-441
9. Fozia (2011), “Emerging Market Of Mutual Funds In India”, PhD. Dissertation (Unpublished), Alighar Muslim University, Alighar
10.Goldsmith, Raymond, W, (1969), Financial Structure and Development, New
Haven Conn. Yale University Press
11.Greenwood & Smith. 1996. "Research in Indian Capital Market", Journal of
Economic Literature, Vol. 35, June 1997, p. 691
12.Gurley, J.G. and E.S. Shaw (1955) "Financial Aspects of Economic
Development" The American Economic Review vol.45, September: pp 515-538
13.Gurley, J.G. and E.S. Shaw (1960) Money in a Theory of Finance Washington
D.C.: The Brookings Institution
14.Gurley, John G, and Edward S Shaw, (1995), "Financial Aspects of Economic
15.Hau, H., Rey, H., (2009) Global portfolio rebalancing under the microscope.
NBER Working Paper 14165
16.Hicks (1969). Indian Financial System, Bharti V. Patnaik, Pearson Education
(P) Ltd., Singapore, p. 28
17.Ito, Hiro, Chinn, and Menzie David, (2005) "What Matters for Financial
Development? Capital Controls, Institutions, and Interactions," Department of
Economics, UC Santa Cruz
18.King R G and R Levine, (1993), "Finance and Growth. Schumpeter might be
Right", Quarterly Journal of Economics, 108, pp. 717- 37
19.Kumar and Tsetseko. (1992). Indian Financial System" Bharati V.Patnaik
Pearson Education, Singapore (P) Ltd., 2003
20.Levin, Ross Sara Zervos (1995). "Stock Markets, Banks and Economic
Growth", The World Bank Policy Research Working Paper, No. 1690,
December 1995
21.Levine, Ross, (1991), "Stock Markets, Growth and Tax Policy", Journal of
Finance, Vol. 46 (4 September), pp. 1445-65
22.Levine, Ross, (1997), "A Theoretical Approach to Financial Development and
Growth," Journal of Economic Literature, Vol. 35, June 1997
23.Levine, Ross. (2000). "Stock Markets Banks and Economic Growth" The World
Bank Policy Research Working Paper, No. 1690
24.McKinnon, Ronald I. 1973. "Money and Capital in Economic Development",
Brookings Institution, Washington DC
25.McKinnon, Shaw and Ronald I (1973) "Money and Capital in Economic
Development", Brookings Institution, Washington DC
26.P.K. Mishra, (2010) "A Garch Model Approach to Capital Market Volatility;
The Case of India"' Indian Journal of Economics and Business. Vol.9, No-3,
Pp-631-641
27.Pathak Bharati V, (2004), "Indian Financial System," Pearson Education
(Singapore) Ltd, pp 476-505.
28.Shaw, G.S (1973), Financial Deepening in Economic Development, New York,
29.Singh, Ajit, (1997), "Financial Liberalization Stock Markets and Economic
Development". The Economic Journal, Vol. 107 (May),pp. 771-82
30.Stiglitz, Joseph. 1985. Credit Markets and the Control of Capital, Journal of