Fatigue Properties of 6061-T6 Aluminum Alloy T-Joints Processed
by Vacuum Brazing and TIG Welding
Huei Lin
1, Jiun-Ren Hwang
1,+and Chin-Ping Fung
21Department of Mechanical Engineering, National Central University, Taoyuan 32001, Taiwan 2Department of Mechanical Engineering, Oriental Institute of Technology, New Taipei 22061, Taiwan
The increasing use of aluminum alloys in transportation including railways, shipbuilding and aeronautics demands more efficient and reliable welding processes, which requires sufficient understanding of fatigue failure. Tungsten inert gas (TIG) welding and vacuum brazing (VB) T-joints of AlMgSi alloy 6061 in the artificially aged condition T6 were studied. This work focuses on the contrasting difference of fatigue behavior of T-joints made from both the traditional process of TIG welding, and the emerging process of vacuum brazing. The fatigue properties of AA 6061-T6 welding under constant amplitude (CA) and variable amplitude (VA) loading were studied. The aim of the CA part in this paper was to identify the differences between brazing and welding on fatigue performance and size effect. The fatigue experiments of TIG welding and vacuum brazing in 6061-T6 aluminum alloys were performed to investigate fatigue strengths. The test results were compared with the results suggested by the International Institute of Welding (IIW), British Standard (BS) and Eurocode 9 recommendations. Meanwhile, in terms of size effect, the thickness correction exponents were compared with the thickness correction exponents suggested by the IIW. The VA part of the work was examined to identify the effects of the mean stress which might increase fatigue lives less than predicted by linear damage summation models. The effects of the mean stress in different correction methods were evaluated. [doi:10.2320/matertrans.M2015343]
(Received September 1, 2015; Accepted November 20, 2015; Published January 18, 2016)
Keywords: vacuum brazing, tungsten inert gas (TIG) welding, aluminum alloy, fatigue life, mean stress effect, size effect
1. Introduction
Recently, environmental problems and concerns about energy consumption have resulted in the increasing use of aluminum alloys in the automobile, aerospace and other industries. In particular, 6000 series aluminum alloys have been extensively studied because they have better strength, weldability, corrosion resistance, and cost than other aluminum alloys.1,2) AA 6061 is one of the most versatile of the heat-treatable alloys and is popular for use in medium-to-high strength applications; it also has favorable toughness characteristics. Aluminum alloy weldments with T-confi g-urations are becoming increasingly important in the transport sector, especially in aerospace and airplane manufacturing, shipbuilding, car body manufacturing and other areas.3) T-joints are generally fabricated by fusion welding, extrusion and rivet connection.
However, its porosities, cracks, high residual stresses and distortions, are well known seriously to degrade the me-chanical properties of aluminum alloys T-joints, and cannot be prevented by traditional fusion welding. This fact is consistent with some results that have been obtained in scientific research into the fatigue resistance of welded T-joints. These investigations studied fusion welding processes. The effects of localized heating and subsequent rapid cooling on residual stresses and distortions have been studied using various methods.4,5)
The frequently preferred process for welding aluminum alloy is tungsten inert gas (TIG) welding, which is relatively simple and not too costly. However, this process causes grains to coarsen in the fusion zone, distortion, an increased tendency to undergo hot cracking and residual stresses. Vacuum brazing (VB) is used because it has none of the disadvantages of TIG welding. Vacuum brazing is carried out in an especially designed furnace in the absence of air and it
has many advantages; it is conducted at 1.3332©10¹1³ 1.3332©10¹4Pa, and so no oxidation problems arise and produces flux-free braze joints with high integrity and superior strength. Vacuum brazing improves the uniformity of the temperature of the base metal and reduces residual stresses by using a slow heating and rapid cooling cycle, resulting in drastically improved mechanical and thermal properties of the material to which it is applied. The process is utilized in various industries, including the automotive, aerospace, medical, defense industries and many others.
Welding is the primary joining method and fatigue is an important design criterion for welded structures subjected to cyclic loading.6)However, as is well known, welded joints can exhibit poor fatigue properties. In welding techniques, failure is a key problem that is related to the stability and safety of the welded structure.7) The fatigue properties of welded structures are influenced by the welding material, the shape of the welded structure, the radius of the weld toe, the weld angle, the height and width of the reinforcement and the welding quality.810) Most literature in fatigue of aluminum alloy welding were discussed the molten welding methods, such as inert-gas metal-arc welding,11) tungsten inert gas welding1214)and friction stir welding.1519)Few studies were investigated the diffusion bonding methods.
Several institutions divide aluminum alloy weldments into various categories, based on joint geometry and load type. Numerous relevant experiments are performed. The exper-imental data thus obtained and their analysis yield the stress-life relationship of each category, enabling design specifi ca-tions to be established. Research into fatigue has led to the establishment of such design specifications as British Standard (BS) 8118, Eurocode 9, recommendations by the International Institute of Welding (IIW).
Owing to the complexity of the materials used and the local geometry of welded structures, current fatigue-related spec-ifications of welded structures of aluminum alloy are some-times not met. This study considers the following problems. +Corresponding author, E-mail: jrhwang@ncu.edu.tw
(1) Distinguishing between brazing and welding;
(2) The effect of weldment thickness and the variable amplitude loading on the fatigue life;
This study examines the fatigue behavior of 6061-T6 aluminum alloy that has been T-welded by TIG welding and vacuum brazing. Fatigue tests were conducted using loadings of constant and variable amplitudes. The results of the fatigue tests were compared with the fatigue design specifications of Eurocode 9, BS 8118, and IIW, and are found to provide designers with improvements to fatigue design. With respect to weldment thickness, Goodman’s mean stress correction method and Gerber’s mean stress correction method were used to determine the effect of variable amplitude loading on the fatigue life of TIG welding and vacuum brazing weldments.
2. Experimental Procedure
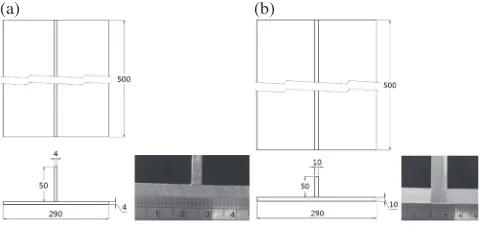
The materials that were used herein were 4 mm-thick and 10 mm-thick sheets of Al-Mg-Si alloy (AA6061-T6). The sheets were cut into rectangular plates with dimensions of 500 mm©290 mm and from which stringer plates with the uniform dimensions of 500 mm©50 mm were prepared. Tungsten inert gas-welded joints were fabricated in a single-bevel T-joints configuration, as displayed in Fig. 1. An ER5356 gradefiller rod was used in the TIG welding process. The shielding gas was highly pure argon. Multi-pass welding was performed to fabricate the joints. Figure 2 presents the configuration of the T-joints formed by vacuum brazing. The cooling gas was nitrogen. The direction of welding was normal to the direction in which the rectangular plates were rolled. All necessary care was taken to prevent joint distortion and the joints were formed after the sheets were clamped. Table 1 presents the chemical compositions of the base metal and the weld metals. The 6061-T6 aluminum alloy in the vacuum brazing process was optimized as specified by the brazing parameters, using the method of Lin.20) Table 2 presents the process parameters of vacuum brazing.
The preparation of the test specimens followed the guidelines of the American Society for the Testing of Materials (ASTM). Figure 3 shows the geometries and dimensions of the tensile and fatigue specimens. The tensile properties of the rectangular AA 6061-T6 plates were evaluated in the transverse direction using a universal testing machine, MTS 810. The deformation of the tensile specimens was measured using an extensometer. The specimen finally failed after necking and the load was recorded as a function of displacement.
Fatigue test specimens were prepared from welded joints in the transverse direction of rectangular plates. Fatigue tests were conducted at room temperature using a servo-hydraulic machine with a frequency of 10 Hz and a stress ratio of R=¹1. Before the fatigue tests were carried out, the surfaces of the specimens were polished in the loading direction using emery paper with a grade of up to 1000.
To characterize the welded joints, Vickers hardness was measured using a microhardness tester with an indentation load of 0.3 kgf, consistent with the ASTM E384 standard. The microhardness was measured from the center to both sides thereof until it was stabilized. The interval of
measure-ment of the vacuum brazing and TIG welding specimens was 1 mm.
Optical microscopic images of cross-sections of the weldments were captured. TIG welding and vacuum brazing T-joints were prepared for optical microscopic analysis. After the specimens were cut, they were cold-mounted in resin powder and liquid, and then mechanically ground and polished. Then, they were etched using Keller’s reagent. De-ionized water and ethanol were subsequently used to
(a) (b)
Fig. 1 Configuration of T-joint for TIG welding: (a) 4 mm; (b) 10 mm (all dimensions in mm).
(a) (b)
[image:2.595.307.548.72.188.2]Fig. 2 Configuration of T-joint for vacuum brazing: (a) 4 mm; (b) 10 mm (all dimensions in mm).
Table 1 Chemical compositions of the base metal and weld metals (mass%).
[image:2.595.307.548.235.348.2]Type of Material Si Fe Cu Mn Mg Cr Zn Al 6061-T6 0.48 0.4 0.27 0.12 1.00 0.19 0.2 Bal ER5356 0.25 ® 0.1 0.05 4.5 0.2 0.1 Bal BAlSi-4 12 0.8 0.3 0.15 0.1 0.2 0.1 Bal
Table 2 Process parameters of vacuum brazing. Soak temperature
(°C)
Soak time (min)
Brazing temperature (°C)
Brazing time (min)
590 50 600 30
(a) (b)
[image:2.595.305.548.418.471.2] [image:2.595.305.549.507.631.2]neutralize the specimens. All samples were then cleaned for 20 seconds in ethanol in an ultrasonic bath, dried and placed in a desiccator until they were analyzed under a microscope. To discuss the effect of thickness correction and mean stress on weldments, constant and variable amplitude fatigue tests were performed on weldments with thicknesses of 4 mm and 10 mm. In the variable amplitude tests, the transmission (TRN) and bracket (BRK) history that was developed by the Society of Automotive Engineers (SAE) was utilized. The transmission history is the tensile mean stress and the bracket history is the slight compression mean stress. As most historical signals have small amplitudes, they have little effect on the assessed fatigue life. Accordingly, the signals with small amplitudes are neglected to reduce markedly the length of the history. The trajectory tracking method is a history-editing technique that ignores small amplitudes for simplification and compression. The transmission history comprised 1709 points, and was reduced to 103 points by the trajectory tracing method, as shown in Fig. 4(a). The bracket history had 5937 points, and was reduced to 414 points by the trajectory tracing method, as shown in Fig. 4(b).
3. Results and Discussions
3.1 Microstructures
Since TIG welding requires a large local heat input and provides a low welding rate, it easily generates high temperature in the welding bead and expands the HAZ. During welding, the temperatures of the weld bead and heat-affected zone differed, so the produced microstructures also differed. Figure 5(a) displays the microstructure of the 6061-T6 welded zone; the high temperatures and rapid cooling in the weld bead caused dendritic grains to be generated with an average grain size of 50 µm. Figure 5(b) shows the micro-structure of the heat-affected zone: the high temperature and slower cooling than that of the weld bead caused a columnar grain structure to be formed with gradually coarsened grains that had an average grain size of 67 µm, degrading the mechanical properties. The temperature gradients dominated the formation of the different grain structures.
Vacuum brazing is a heating method that utilizes radiation and causes uniform heating and automatic temperature control. It can prevent local overheating and the formation of a HAZ. In this method, the deformation of the work piece and the residual stress are minimal. Figures 6(a) and 6(b)
show the microstructures of a brazing bead and the base metal, respectively, after vacuum brazing. No obvious dendritic or columnar grains are observed. The average grain sizes of the bead and post-brazing base material were 35 µm and 44 µm, respectively. In Fig. 6(a), many inter-metallic compounds surround the diffusion layer of the brazing bead after the metal elements in thefiller diffuse toward the base metal. According to Fig. 6(b), since the temperature in vacuum brazing process was high and maintained for more than an hour, most of the precipitates were solid-dissolved. After quenching with nitrogen gas, the solid solution formed a supersaturated phase, and then, a small quantity of precipitates was generated. Unlike TIG welding, vacuum brazing causes no obvious variations among the brazing bead, the HAZ and the base metal.
3.2 Microhardness
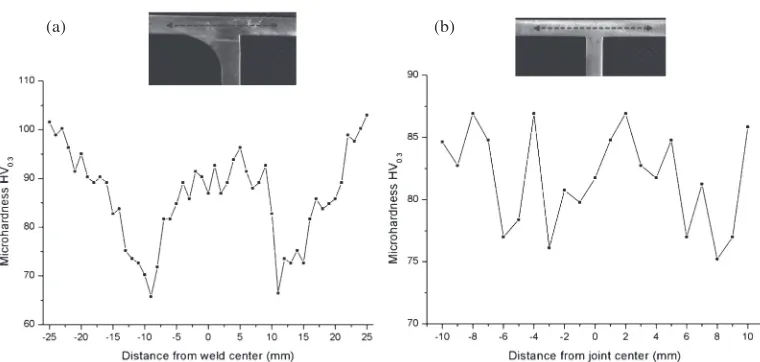
The main testing surface in the microhardness test was the side surface of the weldment. Figures 7(a) and 7(b) plot the microhardness distributions that were achieved by TIG welding and vacuum brazing, respectively.
(a) (b)
Fig. 4 Condensed SAE history: (a) transmission; (b) bracket.
(a) (b)
Fig. 5 Optical micrographs of TIG weldment: (a) welding bead; (b) heat-affected zone.
(a) (b)
[image:3.595.113.483.73.209.2] [image:3.595.307.547.254.345.2] [image:3.595.305.549.393.483.2]Figure 7(a) indicates that, in TIG welding, under the influence of a local high temperature, the HAZ had the lowest microhardness with a microhardness value of HV66. The microhardness of the base metal was HV107. The HAZ extended to approximately 22 mm to the left and right of the welding bead. In Fig. 7(b), no clear HAZ is observed because the weldment was heated to a uniform temperature in a vacuum, preventing local overheating. The rapid cooling and partial coarsening of precipitates reduced the microhardness of the base metal from HV107 to HV75, which is still higher than the microhardness of the HAZ in the TIG weldment.
3.3 Tensile properties
Table 3 shows the tensile properties of two types of 6061-T6 weldment. The tensile strength of the base metal was 306.7 MPa, and that of the TIG welding joint was 186.1 MPa, which was 60.6% of the strength of the base metal, whereas the tensile strength that was achieved by vacuum brazing was 190.7 MPa, which was 62.1% of the strength of the base metal. The experimental results reveal that the tensile strength achieved using vacuum brazing exceeds that of TIG welding. When the vacuum brazing temperature is elevated to 600°C and then rapidly reduced using nitrogen gas, precipitation hardening improves the mechanical proper-ties of the weldment.
In TIG welding, local-high-temperature molten welding minimizes the tensile strength of the HAZ, causing necking there, and the consequently formed fracture surface is classified as ductile, as shown in Fig. 8(a). In vacuum brazing, the specimen fractures at the brazing toe and the fracture surface exhibits necking, so the fracture surface is classified as ductile, as shown in Fig. 8(b).
3.4 Fatigue properties
The fatigue properties of aluminum T-joints are studied. The fatigue design curve of aluminum T-joints is classified as IIW FAT 28, BS 8118 class 29 and Eurocode 9 category 31. When Nf<2©106, theS-Nequation can be written as:
LogNf ¼LogK1mLogSnZ· ð1Þ
where Nf represents the fatigue life in cycles; K1 is the empirical constant; m is the slope coefficient of the S-N
curve;Snis the nominal stress; Z is the number of standard deviations; · is the standard deviation of the LogNf distribution. Table 4 lists the parameters for that are obtained from theS-Ncurve of T-joints of AA 6061-T6.
Figure 9 plots theS-Ncurves of AA 6061-T6 T-joints that were formed by TIG welding and vacuum brazing, and the recommended design curves for three specifications. The stress amplitude in the fatigue experiments was 35%to 54% of the tensile strength. The 50% survival probability was obtained from experimental data by linear regression. The experimental S-N curve with 95% survival probability was obtained from the standard deviation shift withZ95.
Figure 9 indicates that theS-Ncurves of both TIG welding and vacuum brazing T-weldments were higher than the
(a) (b)
[image:4.595.107.487.65.246.2]Fig. 7 Schematic diagram of microhardness tests: (a) TIG welding; (b) vacuum brazing.
Table 3 Tensile properties of different AA 6061-T6 weldments.
Welding method Yield strength (MPa)
Tensile strength (MPa)
Elongation (%) TIG welding 148 186.1 10.9 Vacuum brazing 122.8 190.7 11.7
(a) (b)
[image:4.595.304.547.302.351.2]Fig. 8 Fracture surfaces for tensile specimens: (a) TIG welding; (b) vacuum brazing.
Table 4 Parameters for theS-Ncurve of T-joints of AA 6061-T6. Welding method K1 m · Z95
TIG welding 3.3©1020 6.75 0.09 3.07
[image:4.595.304.549.314.473.2] [image:4.595.306.549.540.582.2]recommended design curves of IIW FAT 28, BS 8118 class 29 and Eurocode 9 category 31. These three specifications are conservative. The slope of the S-N curve of the TIG weldment exceeded that of the vacuum brazing weldment. Regarding to the influence of welding and brazing process on fatigue strength, TIG welding was superior to vacuum brazing. This discrepancy in the welding process produces differences in fatigue strength and the slope of theS-Ncurve. Safety factors are obtained from experimental and design curves.
f· ¼·ExpðNrÞ=·codeðNrÞ ð2Þ
where ¦·Exp and ¦·code are the stress range relative to experimental results and that indicated in the design fatigue curve for the same number of cycles to failure, respectively. Safety factors on stress range are listed in Table 5 and plotted in Figs. 10(a) and 10(b) of TIG welding and vacuum brazing respectively. The following observations are made.
(1) Safety factors vary and become larger as life duration increases. The fact that life durations of greater than the endurance limit of 105 cycles are expected from class IIW FAT 28 was taken into account.
(2) Safety factors associated with TIG welding are higher than those associated with vacuum brazing in the range N=104105. Safety factors associated with vacuum brazing are exceeds those associated with TIG welding
in the range N=1052©106.
(3) For short life durations, safety factors of TIG welding and vacuum brazing are below the value of 2, as indicated by IIW FAT 28, BS 8118 class 29, and Eurocode 9 category 31.
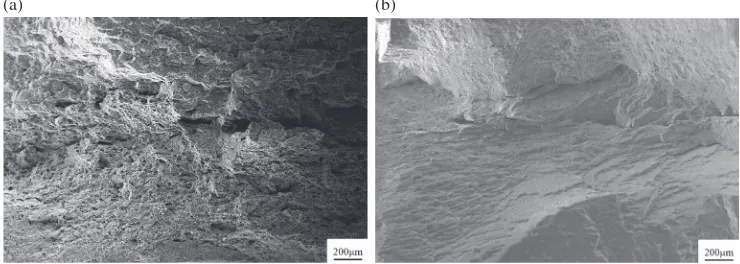
The fatigue specimen that was formed by TIG welding ruptured in the HAZ. Since fatigue failure of the weldment is dominated by the crack growth, the cracks in the fatigue specimens were generated most easily in the HAZ. The HAZ was subjected to the high-temperature effect of TIG welding, so it exhibited grain coarsening and the lowest tensile strength, causing fatigue failure to occur there. Figure 11(a) shows the fracture surface of TIG welding specimen in, which reveal a large number of smaller dimples distribute on the bottom side of fracture surface. The fracture surface of the TIG welding specimen shows a ductile fracture dominated by dimples due to microvoid coalescence. The fatigue specimen that was formed by vacuum brazing ruptured near the welding bead. Fatigue cracking is easily initiated on surface defects or in areas of lower hardness. Figure 11(b) shows the fracture surface of fatigue specimen in vacuum brazing. The dimples are found on the top side of fracture surface. The fracture modes are ductile fracture.
3.5 Size effect
The fatigue strengths of welded joints that fail from the
[image:5.595.52.541.67.435.2]Fig. 9 S-Ncurves.
Table 5 Safety factors for TIG welding and vacuum brazing. (a) TIG welding
N(cycles) f¦·IIW f¦·BS 8118 f¦·Eurocode 9 104 1.56 1.49 1.57
105 2.39 2.28 2.28
106 3.65 3.5 3.32
2©106 4.14 4 3.74
(b) Vacuum brazing
N(cycles) f¦·IIW f¦·BS 8118 f¦·Eurocode 9 104 1.28 1.22 1.28
105 2.31 2.21 2.2
106 4.16 3.99 3.79
2©106 4.96 4.79 4.48
(a) (b)
weld toe are widely thought to decline as the plate thickness increases.21)Recent work has shown that the thickness effect depends on the overall proportions of the welded joint.22,23) The fatigue rules in Eurocode 9 accounts for this effect. A further refinement in the IIW recommendations modifies the thickness correction exponent p for various welds. Values range from 0.3 to 0.1, reflecting the fact that the thickness correction also depends on the degree of concentration of stress that is induced by the welded joint. The lower fatigue strength of thicker members is accounted for by multiplying the FAT class of the structure by the thickness reduction factor f(t).
In this study, the experimentalS-Ncurves of the AA6061-T6 T-joints with thicknesses of 4 mm and 10 mm are used to discuss the thickness correction factors for different fatigue life. Figure 12 plots the S-N curves of the AA6061-T6 T-joints with thicknesses of 4 mm and 10 mm.
From experimental results, thickness correction exponent is obtained:
teff tref
P
¼ freffeff
ð3Þ
where teff=4 mm; tref=10 mm; fref is the fatigue strength relative to experimental 10 mmS-Ncurve;feff is the fatigue strength relative to experimental 4 mm S-Ncurve.
Table 6 lists the thickness correction exponents. The following facts are observed.
(1) The thickness correction exponents are never constant. The thickness correction exponents for TIG welding decrease as life duration increases. The thickness correction exponents for vacuum brazing become slightly larger as life duration increases.
(2) For TIG welding, the thickness correction exponents in the lower life region are consistent with the P value recommended in the IIW specification. TIG welding is suitable for the thickness correction exponents of the IIW specification.
(3) The thickness correction exponents in vacuum brazing differ from the P value recommended by the IIW specification. In the lower life region, vacuum brazing does not require thickness correction. However, in the higher life region, vacuum brazing is required to carry out thickness correction.
3.6 Mean stress effect
The mean stress significantly affects the fatigue strength. When ·m>0, ·m increases; whereas Sf decreases. When
·m<0,«·m«increases; whereasSfincreases. In this study, the transmission and bracket histories developed by the Society of Automotive Engineers in the U.S. was utilized; the mean stress is tensile and slight compression, respectively. The two mean stress correction equations of Goodman and Gerber were used in the fatigue life analysis.
[image:6.595.112.482.73.205.2](a) (b)
[image:6.595.54.283.248.415.2]Fig. 11 Fracture surfaces for fatigue specimens: (a) TIG welding; (b) vacuum brazing.
Fig. 12 S-Ncurves for the AA6061-T6 T-joints with thickness of 4 mm and 10 mm.
Table 6 Thickness correction exponents for TIG welding and vacuum brazing.
(a) TIG welding
N
(cycles)
PTIG
(thickness correction exponent)
110000 0.33
210000 0.27
1300000 0.11
(b) Vacuum brazing
N
(cycles)
PVB
(thickness correction exponent)
150000 0.04
260000 0.07
[image:6.595.304.549.275.421.2]Goodman: ·Sea¼·Sum ¼1 ð4Þ
Gerber: ·Seaþ ·Sum
2
¼1 ð5Þ
The predicted and experimental life of the specimens of thickness of 4 mm were compared, using theS-Ncurves from the experimental TIG welding and the vacuum brazing data, following mean stress correction using eqs. (4) and (5), respectively.
Figure 13(a) plots the predicted and experimental life achieved by TIG welding given the transmission history; that obtained using the Goodman mean stress correction method agreed closely with the experimental life. Figure 13(b) plots the predicted and experimental life achieved using vacuum brazing given the transmission history. The predicted life achieved using vacuum brazing given the specified trans-mission history, obtained using the Goodman mean stress correction method, agreed closely with the experimental life.
Figure 14(a) plots the predicted and experimental life achieved suing TIG welding under the bracket history. The predicted life achieved using TIG welding under the bracket history, according to theS-Nmethod agreed closely with the experimental life. TheS-Nmethod predicts life without mean stress correction. Figure 14(b) plots the predicted and experimental life achieved using vacuum brazing under the bracket history. The predicted life achieved using vacuum brazing under the bracket history using the Goodman mean
stress correction method agreed closely with the experimental life.
As demonstrated by the above results, given the trans-mission history, the Goodman mean stress correction method predicted the life achieved using both the TIG welding and vacuum brazing specimens with aluminum alloy 6061-T6. The predicted fatigue life achieved using TIG welding and vacuum brazing specimens under the bracket history could be used in the S-N method and the Goodman mean stress correction method, respectively.
4. Conclusion
This study discussed the mechanical properties of AA6061-T6 weldments that were prepared by TIG welding and vacuum brazing. Fatigue tests were carried out on TIG welding and vacuum brazing of T-joints. The effects of specimen thickness and variable amplitude loading on fatigue life were presented. The following conclusions are drawn.
(1) The experimental results reveal that the tensile strength achieved using vacuum brazing exceeds that achieved by TIG welding. Since vacuum brazing involved an elevated temperature of 600°C and rapid cooling using nitrogen gas, precipitation hardening occurs, improving the mechanical properties of the weldment.
(2) ExperimentalS-Ncurves of TIG welding and vacuum brazing T-weldments were higher than the recom-mended design curves of class FAT 28 in IIW, class 29 in BS 8118 and category 31 in Eurocode 9. These three
[image:7.595.114.483.72.216.2](a) (b)
Fig. 13 Comparison between the predicted life and experimental life under TRN history: (a) TIG welding; (b) vacuum brazing.
[image:7.595.114.482.256.401.2](a) (b)
[image:7.595.117.258.445.496.2]specifications are conservative.
(3) With respect to the size effect in TIG welding, the thickness correction exponents in the lower life region are consistent with thePvalue recommended in the IIW specification. The thickness correction exponents in vacuum brazing differ from thePvalue recommended by the IIW specification.
(4) The fatigue life of the TIG welding and vacuum brazing specimens of aluminum 6061-T6 under the trans-mission history can be predicted using the Goodman mean stress correction method.
(5) The fatigue life of the TIG welding specimens given the bracket history can be predicted using theS-Nmethod. The fatigue life of the vacuum brazing specimens under the bracket history can be predicted using the Goodman mean stress correction method.
Acknowledgments
The authors would like to thank the Ministry of Science and Technology, R.O.C. for their financial support of this research.
REFERENCES
1) S. X. Lee, Y. Saito, T. Sakai and H. Utsunomiya:Mater. Sci. Eng. A 325(2002) 228235.
2) M. Mansourinejad and B. Mirzakhani: Trans. Nonferrous Met. Soc. China22(2012) 20722079.
3) X. Hou, X. Yang, L. Cui and G. Zhou:Mater. Des.53(2014) 106117.
4) F. R. Mashiri, X. L. Zhao and P. Grundy:Eng. Struct.26(2004) 1861 1875.
5) A. Carpinteri, R. Birghenti, H. J. Huth and S. Vantadori:Int. J. Fatigue 27(2005) 5969.
6) W. Fricke:P. I. Mech. Eng. C-J Mec.229(2015) 12241239.
7) Y. Sun and X. Yang:Stroj. Vestn-J Mech. E60(2014) 600606.
8) J. P. Bergmann and S. Herold:Weld. World50(1112) (2006) 5564.
9) T. R. Gurney: Fatigue of Welded Structures, (Cambridge University Press, UK, 1979).
10) D. V. Nelson: SAE technical paper (1982) 820695.
11) C. Zhou, X. Yang and G. Luan:Scr. Mater.53(2005) 11871191.
12) J. A. M. Pinho da Cruz, J. D. M. Costa, L. F. P. Borrego and J. A. M. Ferreira:Int. J. Fatigue22(2000) 601610.
13) N. Ye and T. Moan:Fatigue Fract. Eng. M.31(2008) 152163.
14) D. Radaj, C. M. Sonsino and W. Fricke:Int. J. Fatigue31(2009) 211.
15) M. Ericsson, L. Z. Jin and R. Sandstrom:Int. J. Fatigue29(2007) 57 68.
16) M. Longo, G. D’Urso, C. Giardini and E. Ceretti: J. Eng. Mater. Technol.134(2012) 18.
17) C. Zhou, X. Yang and G. Luan:Mater. Sci. Eng. A418(2006) 155 160.
18) X. Xu, X. Yang, G. Zhou and J. Tong:Mater. Des.35(2012) 175183.
19) Y. Yamamoto, H. Ochi, T. Sawai, H. Yamaguchi and K. Ogawa:Mater. Trans.48(2007) 29092913.
20) H. Lin: Proc. 30th National Conference on Mechanical Engineering of Chinese Society Mechanical Engineers, (2013) paper no. 1499. 21) T. R. Gurney: Proc. 2nd International Conference on Behaviour of
Offshore Structures, (Imperial College, London, England, 1979) pp. 2931.
22) S. J. Maddox:The Effect of Plate Thickness on the Fatigue Strength of Fillet Welded Joints, (Abington Publishing, Cambridge, UK, 1987). 23) S. J. Maddox: Proc. 6th International Conference on Aluminum