Evaluation of Dislocation Density for 1100 Aluminum with Different Grain Size
during Tensile Deformation by Using
In-Situ
X-ray Diffraction Technique
+1Hiroki Adachi
1,+2, Yoji Miyajima
2, Masugu Sato
3and Nobuhiro Tsuji
41Graduate School of Engineering, University of Hyogo, Himeji 671-2280, Japan
2Interdisciplinary Graduate School of Science and Engineering, Tokyo Institute of Technology, Tokyo 152-8550, Japan 3Japan Synchrotron Radiation Research Institute (JASRI), Hyogo 679-5198, Japan
4Graduate School of Engineering, Kyoto University, Kyoto 606-8501, Japan
Ultra-fine-grained (UFG) aluminum with a grain size of 260 nm was fabricated by annealing a severely plastically deformed A1100 alloy. The resulting UFG aluminum exhibited a 0.2%proof stress (·0.2) that was four times larger than that predicted by the conventional Hall-Petch relation. In this study, the UFG aluminum, thefine-grained aluminum with a grain size of 960 nm and the coarse-grained aluminum with a grain size of 4.47 µm were prepared. The change in the dislocation density, μ was investigated during tensile deformation usingin-situ X-ray diffraction measurements at SPring-8. It was found that as the strain increased, theμchanged in four distinct stages. Thefirst stage was characterized by elastic deformation, and little change in theμoccurred. For the coarse-grained aluminum, this stage was almost absent. In the second stage, theμrapidly increased until the stress reaches·II in which the plastic deformation begins to occur at a constant strain rate. In the third stage, only a moderate change in theμoccurred. Finally, in the fourth stage, theμrapidly decreased as the test pieces underwent fracture. Additionally, it was found that the·0.2-·Iwas followed by the conventional Hall-Petch relation in all grain size range.
[doi:10.2320/matertrans.L-M2015803]
(Received December 21, 2014; Accepted February 10, 2015; Published April 10, 2015)
Keywords: ultra-fine grained aluminum, in-situ measurement, dislocation density, Hall-Petch relation
1. Introduction
The development of severe plastic deformation technique, such as accumulative roll-bonding (ARB),13)high-pressure torsion (HPT),4) equal channel angular pressing (ECAP),5) has facilitated fabrication of ultrafine-grained aluminum with average crystal grain sizes of several 100 nm. When the grain size in materials with conventional grain sizes is refined, their strength is known to empirically rise with the inverse square root of the average grain size, in accordance with the Hall-Petch relation.6,7) Kamikawa et al. have reported, however, that although the relation between grain size and 0.2%proof stress (·0.2; MPa) in 99.99%pure aluminum alloy with grain sizes of 20 to 405 µm is·0.2=9.7+41d¹1/2,8)whered[µm] is the average grain size, further decreases in grain size by severe plastic deformation resulted in substantially larger stress than predicted by this equation.8) Ford=1 µm, for example, the previous equation predicts a value of ·0.2= 50.7 MPa, but the actual 0.2% proof stress is approximately 100 MPa, or twice the predicted value. This phenomenon is also observed for IF steel,9)thus indicating thatfine-grained materials sometimes exhibit yield stresses higher than conventionally predicted by the Hall-Petch curve. Low-temperature annealing of ultrafine-grained aluminum with a grain size of 200 nm fabricated by ARB results in substantially lower ductility and higher strength than those of the as-ARBed material. It has also been reported that when the annealed material is rolled at a low reduction ratio its ductility rises to about the same level as-ARBed materi-al.10,11)This phenomenon, known as “hardening by anneal-ing, softening by deformation”, is just the reverse to what
occurs for materials with conventional grain sizes. These various mechanical phenomena specific to ultrafine-grained aluminum are not exhibited by materials with conventional grain sizes. This suggests that the dislocation behavior leading to deformation in ultrafine-grained aluminum is differs from it in conventional grained aluminum, but the details remain unclear. In the present study, we considered the dislocation behavior and investigated in particular the dislocation multiplication that occurs during tensile deforma-tion, as a means of clarifying how it changes with grain size.
Several methods can be used to evaluate the dislocation density, including electrical resistance measurements,12) transmission electron microscopy (TEM),13) and X-ray diffraction (XRD). However, electrical resistance measure-ments and TEM encounter specific problems. The contribu-tion of dislocacontribu-tions to the electrical resistance is smaller than that of the grain size,12) which may make it difficult to accurately determine the dislocation density of fine-grained materials, in which the grain boundary density is high. TEM observations require the preparation of thin-film samples, during which the dislocation density can be reduced near the surface,14)permitting only local measurement of dislocation densities. In addition, surface effects may be induced that change the dislocation source activity and behavior relative to those of the bulk material. In the present study, we therefore applied a method based on XRD, which can provide averaged information within the scattering volume. The method proposed by Williamsonet al.for calculation of the dislocation density from the results of XRD measure-ments1517)requires accurate measurement of the full width at half maximum (FWHM) for multiple diffraction peaks, and long measurement times are required in order to obtain diffraction profiles with a good S/N ratio for a wide range of diffraction angles. For this purpose, the crosshead movement +1This Paper was Originally Published in Japanese in J. JILM64(2014)
463469.
is suspended midway through during tensile testing and the diffraction profile is measured while maintaining the stroke.18,19) In this intermittent measurement procedure, however, stress relaxation occurs while maintaining the stroke, possibly resulting in a lower dislocation density than in continuous tensile deformation, and thus in underestima-tion. Tomota et al. have reported, for example, that during tensile testing of IF steel which they suspended midway through, a decline in stress of approximately 25 MPa occurred when neutron diffraction testing was performed while the stroke was maintained for 2 ks or 4 ks.18)
Forin-situmeasurement of the dislocation density during tensile deformation, it is therefore necessary to develop a system that permits diffraction profile measurements through-out a wide range of diffraction angles in a very short time. For this reason, we performed the experiments of the present study using the high brightness X-rays available at the SPring-8 synchrotron radiation facility.
2. Experimental Procedures
An A1100 alloy of 1 mm thickness was homogenized at 673 K for 7.2 ks and then cooled to room temperature. Table 1 shows the chemical compositions of A1100 alloy. The specimen was then subjected to 8 cycles of ARB at room temperature, thus the specimens of 0.5 mm thickness were obtained.1)Because the thickness reduction is 50%per cycle by rolling in the ARB process, the total applied equivalent strain was 6.4. The crystal grain size was then adjusted by low-temperature annealing, to obtain three types of materials: (1) materials annealed at 373 K for 1.8 ks, (2) materials subjected to pre-annealing at 448 K for 21.6 ks and then post-annealed at 498 K for 1.8 ks; and (3) materials subjected to pre-annealing at 448 K for 21.6 ks and then post-annealed at 573 K for 1.8 ks. The two-step annealing was performed in some materials to suppress abnormal grain growth during the post-annealing using a low-temperature pre-annealing.8) From the resulting sheet materials, tensile-test specimens were prepared so that the rolling direction (RD) would agree in the tensile direction. The shape of the tensile-test specimens is shown in Fig. 1.
Normal direction-transverse direction (ND-TD) cross sections of the specimens were mechanically mirror polished using SiC polishing paper, chemical-mechanical polishing using colloidal silica, and then subjected to electron beam backscatter diffraction (EBSD) measurements at an accel-eration voltage of 15 kV, in an oriented imaging microscopy (OIM) system provided by TSL, and equipped on a JSM-6500F scanning electron microscope provided by JEOL Ltd. The ND spacing of high-angle grain boundaries was then measured, thus this spacing was considered to be a grain size. In-situ measurement for changes in dislocation density during tensile deformation requires diffraction profile changes over a wide range of diffraction angles in a short
time. We utilized the high-brightness X-ray BL-19B2 beam line of the SPring-8 synchrotron radiation facility for this study, with the measurement system shown schematically in Fig. 2. The X-ray energy was 25 keV, and the beam size was 3 mm along the test specimen width direction and 110 µm in the tensile direction. An imaging plate (IP) was used as the detector, to allow simultaneous measurement at a wide range of diffraction angles with high angular resolution. As an IP does not provide time resolution, a slit with a width of 4 mm was placed in front of the IP, and from the start of the tensile test the IP was moved at 2 mm/s perpendicularly to the slit to obtain a record of the diffraction profiles at different times at different positions on the IP. The time resolution of this experiment was accordingly 2 s, and the maximum measure-ment time as determined by the IP width was 80 s. The incident X-rays were perpendicular to the tensile-test speci-men and the IP was tilted 14.7° upward from the horizontal transmission direction, with a distance of 716.6 mm from the specimen to the IP, thus enabling simultaneous measurement of diffraction peaks associated with (111), (200), (220), (311), and (222) planes. Profile fitting of the obtained diffraction peaks was performed using the pseudo-Voigt function, and the FWHM was obtained. The tensile test was performed with an initial strain rate of 8.3©10¹4s¹1 at room temper-ature. The area of necking or fracture in a specimen was not irradiated with X-rays, and the measurement results are not for regions near fractures.
3. Results
[image:2.595.326.531.72.143.2]Figures 3(a), (b) and (c) show ND-RD cross-sectional Table 1 Chemical composition of A1100 alloy in mass%.
Si Fe Cu Mn Zn Al
0.12 0.53 0.13 0.02 0.01 99.19
Fig. 1 The shape of tensile test pieces.
[image:2.595.48.292.84.114.2] [image:2.595.331.519.156.371.2]grain boundary maps of specimens with grain size adjusted under different annealing conditions. The specimen in Fig. 3(a) was annealed at 448 K for 21.6 ks and then 573 K for 1.8 ks. Its crystal grains are almost equiaxed, and the measurements showed an average high-angle grain boundary spacing of 4.47 µm in the ND. Such specimens are hereafter denoted to as the coarse-grained (CG) material. The specimen in Fig. 3(b) was annealed at 448 K for 21.6 ks and then 498 K for 1.8 ks. Its grains are somewhat more equiaxed than those of the specimen shown in Fig. 3(c). In this specimen, grain growth had occurred. The measurements showed an average ND spacing of 960 nm between high-angle grain boundaries. Such specimens are hereafter referred to as thefine-grained (FG) material. The specimen shown in Fig. 3(c) was annealed at 373 K for 1.8 ks. Many of its grains exhibit RD elongation, and it contains rather few observable low-angle grain boundaries within its grains. The measurements showed an average ND spacing of 260 nm between high-angle grain boundaries. This value was taken as the grain size, and such specimens are hereafter denoted to as the ultrafine-grained (UFG) material.
Figure 4 shows the stress-strain curves obtained byin-situ XRD measurements. The strain was calculated from changes in strokes of tensile tester, and therefore includes deformation of the tensile tester. The UFG material exhibited a continuous
(a) (b)
(c)
Fig. 3 TD inverse polefigure maps of ND-RD planes, (a) in the coarse grained (CG) aluminum, (b) in thefine grained (FG) aluminum and (c) in the ultra-fine grained (UFG) aluminum. Black lines correspond to the boundaries of misorientation angle>15 degree. White lines correspond to the boundary of misorientation angle<15 degree.
[image:3.595.65.534.67.477.2] [image:3.595.322.529.539.690.2]yield. Its 0.2% proof stress (·0.2) at a strain of¾0.2=1.22% was 302 MPa. When work hardened to a strain of 3%, it reached a tensile strength of 373 MPa and thereafter exhibited a gradual decline in stress accompanying local deformation, and fractured at a strain of 4.9%. The FG material exhibited a 0.2% proof stress of ·0.2=205 MPa at ¾0.2=0.98%, immediately followed by its indication of a maximum strength of 207 MPa, and thereafter exhibited a sharp decline in stress by approximately 10 Pa. Its strength at a strain of 1.16% was 193 MPa. As an fcc metal, aluminum usually exhibits a continuous yield, but discontinuous yields reported to occur in cases where its grains have been refined.8)The FG material subsequently exhibited a gradual decline in stress accompanying local deformation, and fractured at a strain of 2.3%. Despite the annealing further progressed and the grains became coarser, its ductility declined. The CG material exhibited a continuous yield, but the slope in the linear strain region from 0%to 0.8% was smaller than that for the UFG and FG materials. With this linear region taken as a region of elastic deformation, the 0.2%proof stress was·0.2=78 MPa. If calculated on the basis of the same slope observed for the elastic regions of the UFG and FG materials, the 0.2%proof stress would then be·0.2=28 MPa at¾0.2=0.31%. Above a strain of 0.8%, the CG material exhibited moderately increasing strength with rising strain. Because of its high plastic elongation, it did not fracture during thein-situXRD measurements.
Figure 5 shows the effect of strain on the (111) diffraction peak for the UFG material. The shape of the diffraction peak at a strain of 0.66%was largely unchanged from that of the non-loaded state, but the peak angle shifted downward. This downward shift of the peak angle represents an increase in the (111) plane spacing in the tensile direction as a result of elastic deformation.
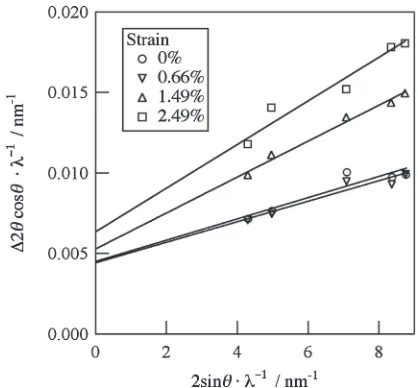
At a strain of 1.49%, the elastic deformation resulted in a further downward shift in the peak position beyond that at a strain of 0.66%, and an increase in diffraction peak width. An increase in the strain to 2.49% resulted in a further increase in the peak width but little or no change in the angle. The increase in the peak width may be caused by a heterogeneous increase in strain or by a decrease in crystallite size, either or both of which might have occurred in the progress of the plastic deformation. The effects of heterogeneous strain and crystallite size on the peak width can be distinguished by applying the Williamson-Hall equation15)
2ªcosª
¼
0:9
D þ2¥
sinª
ð1Þ
where ¦2ª is the FWHM of the diffraction peak, ª is the diffraction angle,is the wavelength of the incident X-ray,¾ is the heterogeneous strain, and Dis the crystallite size. By measuring ª and ¦2ª for the diffraction peaks and taking 2 sinª/as the horizontal axis and¦2ªcosª/as the vertical axis, it is possible to determine the heterogeneous strain from the slope and the crystallite size from the inverse of the vertical-axis intercept. Figure 6 shows a Williamson-Hall plot for the UFG material, with all of the points on their respective straight lines in close accordance with the Williamson-Hall equation. The plots for the UFG material in the unloaded state and at strain of 0.66%show little or no
change in both slope and intercept, and also little or no change in heterogeneous strain and crystallite size. With further increases in strain to 1.49% and 2.49%, the slope of the plot gradually increased, indicating increasing heteroge-neous strain, and the intercept also increased slightly, indicating a slight decline in crystallite size due to the increase in strain.
Based on the heterogeneous strain and crystallite size indicated by this Williamson-Hall plot, the dislocation densityμcan be calculated using17)
μ¼2
ffiffiffi
3 p
¥
Db ; ð2Þ
whereb is the magnitude of the Burgers vector.
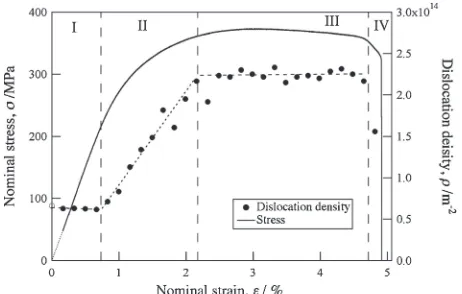
Figure 7 shows the change in the dislocation density of the UFG material during tensile deformation, as determined by the in-situ XRD measurement. The change comprises four stages, labeled Region I to Region IV in the figure. In Region I, extending from strains of 0% to 0.75%, the dislocation density showed little or no change following the start of tensile deformation. This is a region of elastic deformation alone, as indicated in Fig. 5 by the downward shift in the diffraction angle, but with little or no change in Fig. 5 (111) diffracted peaks at various nominal strains for the UFG
aluminum duringin-situXRD measurements.
[image:4.595.318.535.70.224.2] [image:4.595.322.531.273.467.2]shape of the diffraction peak between strains of 0% and 0.66%. Plastic deformation arose in the transition from Region I to Region II around the onset of sharply rising dislocation density, as is also indicated by the smaller slope of the stress-strain curve in Region II than in Region I. Denoting the stress, strain, and dislocation density at the time of transition from Region I to Region II as ·I, ¾I, and μI, respectively, their values were approximately·I=220 MPa,
¾I=0.75%, and μI=0.61©1014m¹2. The stress ·I was 82 MPa smaller than the ·0.2 proof stress, dislocation multiplication began at a substantially lower stress than the 0.2% proof stress, and the dislocation density rose to μ0.2=1.20©1014m¹2at the strain of the 0.2%proof stress. The dislocation density thereafter rose monotonically to a level near a strain of 2.16%. On reaching Region III, the dislocation density became essentially constant. Denoting the stress, strain, and dislocation density at the time of transition from Region II to Region III as ·II,¾II, andμII, respectively, their values were approximately·II=361 MPa,¾II=2.16%, and μII=2.2©1014m¹2. In Region IV, in which the strain was in excess of 4.65%, the dislocation density fell sharply. This agrees with the strain at the onset of fracturing in the test specimen, which indicates that the decline in dislocation density in Region IV is attributed to a reduction in stress accompanying fracture. The dislocation density decrease was 0.6©1014m¹2.
Figure 8 shows the change in the dislocation density in the FG material during tensile deformation, as determined by in-situ XRD measurement. As in the UFG material, the dislocation density changed in four stages, labeled Region I to Region IV. The dislocation density showed little or no change following tensile test initiation in Region I but began to rise when the strain ¾I exceeded 0.60%, marking the transition to Region II, in which the slope of the stress-strain curve became smaller than in Region I. The stress and the dislocation density at a strain¾I=0.60%were·I=153 MPa andμI=0.28©1014m¹2, respectively. As was the case with the UFG material, the FG material stress·I was lower than the 0.2% proof stress ·0.2=205 MPa and the onset of dislocation multiplication occurred at a stress lower than the 0.2%proof stress. The dislocation density was approximately μ0.2=0.6©1014m¹2at the 0.2%proof stress and increased until the strain reached approximately 1.16%. In Region II, a
decline in stress of approximately 10 MPa was observed in the stress-strain curve, but the cause could not be clearly determined given the time resolution and measurement accuracy of the in-situ measurements in the present study. The decline in stress was not attributed to the onset of mobile dislocation multiplication, as it occurred at a level of stress higher than ·I. The boundary between Region II and Region III is not definitive, but if the boundary is taken to be located at ¾II=1.16%, the corresponding stress and dislocation densities are then·II=194 MPa andμII=0.79© 1014m¹2. Little or no change in dislocation density was observed in Region III until the strain reached approximately 2.3%, which marks the onset of test specimen fracture and entry to Region IV, a region in which the dislocation density substantially fell by approximately 0.3©1014m¹2, or about half the corresponding fall observed for the UFG material. This indicates the annihilation during unloading of some dislocations that had formed by multiplication under deformation, more often for fine grain sizes. Since the dislocation density decreases during stress relaxation, it also means that the dislocation densities for pure fine-grained aluminum under deformation are underestimated in TEM measurements after loading and unloading, and also by measurements of the diffraction profiles with suspended cross-head movement in tensile testing. It is also possible that the dislocation substructure itself after unloading differs from the substructure under deformation. The mechanism of the dislocation annihilation was not clearly determined in the present study, but in view of the high crystal grain-boundary densities in the UFG and FG materials, it may be that the deformation accompanying the unloading induces movement of the dislocations to the grain boundaries, which act as a sink for their annihilation.
Figure 9 shows the changes in the dislocation density of the CG material during tensile deformation, as measured by in-situXRD. In the CG material, at a strain of 0.166%, which was the first measurement point following tensile test initiation, the dislocation density started rising with no observable presence of Region I. The stress at a strain of 0.166%was 14 MPa, which indicates that in the CG material the stress·Iat which dislocation multiplication begins is less than 14 MPa. In Region II, the rise in dislocation density with increasing strain is approximately linear and the dislocation Fig. 7 Change in the dislocation density with the nominal strain for the
UFG aluminum during the in-situ XRD measurement. Greek letter indicates each region. Vertical broken line is the region boundary.
[image:5.595.54.285.70.217.2] [image:5.595.309.542.72.217.2]density at a strain of 0% falls on the resulting straight line. This indicates that the stress ·I, marking the onset of dislocation multiplication, is quite small and very close to 0 MPa. We accordingly find ·I=0 MPa, ¾I=0%, and
μI=0.10©1014m¹2. The dislocation density then rises substantially up to a strain of 0.83%, which indicates that the stress and strain are linearly related in the region in which the strain is less than or equal to 0.83%, but because it is not a region of elastic deformation characteristic of Region I, but rather a region of plastic deformation characteristic of Region II, the slope in this Region II of the stress-strain curve of the CG material is smaller than those found in the region of elastic deformation for the UFG and FG materials. Accordingly, we conclude on the basis of the slope of the stress-strain curves for the UFG and FG materials in Region I that the 0.2% proof stress of the CG material is ·0.2= 28 MPa, and that ¾0.2=0.31% and μ0.2=0.18©1014m¹2. Beyond a strain of 0.83%, the increase rate in dislocation density in the CG material is more moderate than in its Region II, which indicates this region may be identified as Region III. The boundary between Region II and Region III is taken as being located at ¾II=0.83%, and the stress and dislocation density at that time are then ·II=70 MPa and
μII=0.26©1014m¹2, respectively.
4. Discussion
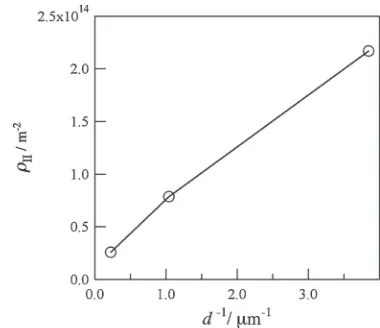
The in-situ XRD measurements clearly indicated that changes in dislocation density during tensile deformation proceed in four stages, represented as Region I to Region IV. Region I is characterized by elastic deformation with little or no change in dislocation density, Region II by sharply increased dislocation multiplication, Region III by moderate dislocation multiplication, and Region IV by a sharp fall in dislocation density due to unloading accompanying fracture. In considering the factors determining the transition through these four regions, let us begin with the transition from Region II to Region III. Region II is a stage of rapidly multiplying dislocations that proceeds until the dislocation density reachesμII, which marks the transition to Region III. As shown by the relation between μII and grain size in Fig. 10,μIIvaries roughly in proportion to the inverse of the grain size. In Region II and Region III, plastic deformation
proceeds and the shear deformation rate d£/dt may be expressed as20)
d£
dt ¼μvb ð3Þ
wherevis the mean speed of dislocation movement,μis the dislocation density, andb is the length of Burgers vector. In constant-speed tensile testing such as the measurements of the present study, d£/dt is constant. In the initial period of plastic deformation, the dislocation density is low, and in order to maintain a constant shear deformation rate after the transition from elastic deformation to plastic deformation it is necessary to increase the dislocation density or the speed of dislocation movement. Grain boundaries inhibit dislocation movement. If the grain size is taken as the approximate maximum distance of ready movement by the dislocations, then a decrease in grain size should also shorten the moving distance of ready movement by the dislocation.21) The average speed of dislocation movement is presumably lower than that of uninhibited dislocation movement because the time spent moving within the grains becomes shorter and the time of immobilization near the grain boundaries becomes longer. It follows that the maintenance of a constant speed of deformation requires a larger increase in dislocation density in the FG or UFG materials than in the CG materials. Here, let us assume as a rough approximation that the dislocations move sufficiently fast within the grains but stop moving near the grain boundaries. The average speed of dislocation movement v is then determined by the density of the movement-inhibiting grain boundaries, and is thus propor-tional to the crystal grain size. It is for this reason that the dislocation density required for constant-speed plastic deformation is inversely proportional to the crystal grain size. In short, the sharp rise in dislocation density observed in Region II presumably occurred to meet the need to attain the dislocation densityμIInecessary for a constant-speed plastic deformation. This also explains the larger increase in dislocation density in Region II for the UFG material than for the FG and CG materials to prevent a decline in the slope of the stress-strain curve much below that of the plastic-deformation region, and the occurrence of a 0.2%proof stress ·0.2that was substantially higher than the stress·I at which dislocation multiplication actually began.
Fig. 9 Change in the dislocation density with the nominal strain for the CG aluminum during thein-situXRD measurement. Greek letter indicates
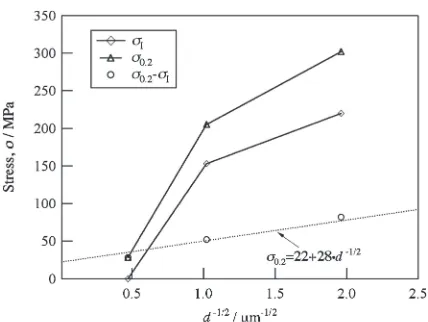
[image:6.595.329.519.69.233.2] [image:6.595.56.285.72.221.2]Figure 11 shows the changes in·I,·0.2, and the difference between the two, relative to the inverse square root of the grain size. The dotted line shows the Hall-Petch relation (·0.2=9.7+41d¹1/2) reported for 99%coarse-grained pure aluminum,22)together with its extrapolation to smaller grain sizes. The value of the stress·0.2for the CG material, with its grain size of 4.47 µm, agrees the value given by the coarse-grain Hall-Petch relation, but those for the FG and UFG materials are well above the extension of the coarse-grain Hall-Petch relation.
As revealed by the in-situ XRD measurements and described above, ·0.2occurs in a part of Region II in which the dislocation density rises toμIIrequired for constant-speed plastic deformation, and where the dislocation density for the UFG and FG materials in particular has already risen substantially. The proof stress ·0.2 therefore does not represent the yield stress, which is a measure of the stress at the start of plastic deformation. If ·I, at which dislocation multiplication begins, is taken as the stress at the start of plastic deformation, its value for the UFG and FG materials is substantially larger than those derived by extension of the coarse-grain Hall-Petch relation. For the CG material, on the other hand, the measured value of ·I is very close to
·I=0 MPa, and thus below the value given by the coarse-grain Hall-Petch relation. Though coarse-grain sizes larger than 5 µm were not investigated in the present study, they too may be expected to show a·Ivalue very close to 0 MPa in view of the known tendency for coarser grains to yield more easily.
It is therefore reasonable to conclude that in pure aluminum, dislocation multiplication occurs even under slight stress loading for grain sizes down to approximately 5 µm, but is suddenly inhibited for grain sizes of less than this. For dislocation multiplication from a Frank-Read source within the grains, the stress·necessary for activation of that source is expressed as23)
· ¼M®b
L ð4Þ
whereMis Taylor’s constant,®is the shear modulus,bis the length of the Burgers vector, andLis the dislocation source
length. Given the values·=·I,M=3.06,®=26 GPa and
b=0.286 nm for aluminum, this equation yields dislocation source lengths of L=103 nm and L=149 nm for the UFG and FG materials, respectively. If intra-grain forest disloca-tions are regarded as the Frank-Read sources, as a rough approximation the forest dislocations are arrayed in a lattice configuration with a spacingL, and the dislocation density is thus μ=L¹2. For the UFG and FG materials, this yields μ=0.93©1014m¹2 and 0.45©1014m¹2, respectively. These values are similar to the values of μI=0.61© 1014m¹2 and μI=0.28©1014m¹2, determined from the
in-situ XRD measurements for the UFG and FG materials, respectively. This suggests that the small grain size in these two materials resulted in a dislocation source length for ready activation that was smaller, and a corresponding increase in the level of stress required for dislocation multiplication.
We may now ask what is represented by the conventionally reported Hall-Petch relation for coarse-grained aluminum. The term ·0.2 is defined as the stress at the time of 0.2% plastic deformation. For the CG material, the stress·Iat the onset of dislocation multiplication is very close to 0 MPa and in that case ·0.2=·0.2-·I. If we also plot the difference between the·Iand·0.2values for the FG and UFG materials, as shown in Fig. 11, wefind that they are in fact very close to the values derived by extension of the Hall-Petch relation for coarse-grained aluminum. This clearly suggests what was conventionally investigated in the derivation of the Hall-Petch relation for coarse-grained aluminum was not the dependence of the 0.2% proof stress ·0.2alone on the grain size, but rather the dependence of a combination of the 0.2% proof stress and the stress at the onset of dislocation multiplication, expressed as ·0.2-·I.
5. Conclusions
In this investigation on changes in dislocation density during tensile deformation of UFG, FG, and CG materials with grain sizes of 260 nm, 960 nm, and 4.47 µm, respec-tively, the findings obtained by in-situ XRD measurement employing synchrotron radiation were as follows.
(1) The changes in dislocation density that accompany increasing strain proceed in four stages. The first comprises a region of elastic deformation with little or no change in dislocation density, the second a region of sharply rising dislocation density, and the third a region of moderate change in dislocation density.
(2) The fourth stage comprises a region of sharply declining dislocation density accompanying test speci-men fracture, with a substantially decrease in disloca-tion density in the UFG and FG materials. This decrease becomes larger with decreasing grain size. This clearly indicates that the dislocation substructure of FG materials during their deformation differs substantially to that subsequent to unloading, and that for UFG materials, in order to measure the changes in dislocation density during deformation, in-situ measurement is necessary.
[image:7.595.62.276.66.227.2](3) In the CG material, the measured value of ·I, which is the stress at the onset of dislocation multiplication, Fig. 11 Change in the 0.2% proof stress, ·0.2, the stress ·I and the
was close to 0 MPa and little or no stage-1 elastic deformation was observed. In the FG and UFG materials, the measured·Ivalues rose to 153 MPa and 220 MPa, respectively, thus showing that ·I increases with decreasing grain size. The ·Ivalues for the latter two materials were well above those derived by extension of the Hall-Petch relation for coarse-grained aluminum.
(4) The dislocation densityμII, which marks the transition from the second to the third stage, was found to vary inversely with the grain size, thus increasing with decreasing grain size. This tendency is presumably attributed to the required constant-speed plastic defor-mation in the second stage and a consequent rise in the dislocation density for attainment ofμII.
(5) It was found that the difference between the value of·I, the stress at the onset of dislocation multiplication, and that of·0.2, the 0.2%proof stress, derived by extension of the Hall-Petch relation for coarse-grained aluminum. This clearly indicates that the conventionally reported Hall-Petch curve represents the dependence of·0.2-·Ion grain size, rather than·0.2 alone.
Acknowledgments
This study was financially supported by the Light Metal Education Foundation, Inc. and the Grant-in Aid for scientific Research on Innovative Area, “Bulk Nano-structured Metals”, through MEXT, Japan (contract No. 22102002), and support is gratefully appreciated. The synchrotron radiation experiments were performed at BL19B2 of SPring-8 with the approval of the Japan Synchrotron Radiation Research Institute (JASRI), (Proposal No. 2011B1923 and 2012A1123).
REFERENCES
1) N. Tsuji, Y. Ito, Y. Saito and Y. Minamino:Scr. Mater.47(2002) 893 899.
2) Y. Saito, N. Tsuji, H. Utsunomiya, T. Sakai, T. Sakai and R. G. Hong:
Scr. Mater.39(1998) 12211227.
3) X. Huang, N. Tsuji, N. Hansen and Y. Minamino:Mater. Sci. Eng. A
340(2003) 265271.
4) Z. Horita and T. G. Langdon:Mater. Sci. Eng. A410411(2005) 422 425.
5) S. Ferrasse:Metall. Mat. Trans. A28(1997) 10471057.
6) E. Q. Hall:Proc. Phys. Soc. London B64(1951) 747753.
7) N. J. Petch: J. Iron Steel Inst.174(1953) 2528.
8) N. Kamikawa, X. Huang, N. Tsuji and N. Hansen:Acta Mater. 57
(2009) 41984208.
9) N. Kamikawa, N. Tsuji and Y. Saito: Tetsu-to-Hagane89(2003) 273 280.
10) X. Huang, N. Hansen and N. Tsuji:Science312(2006) 249251.
11) X. Huang, N. Kamikawa and N. Hansen:Mater. Sci. Eng. A483484
(2008) 102104.
12) S. Komatsu: J. JSTP46(2005) 813817.
13) Y. Miyajima, M. Mitsuhara, S. Hata, H. Nakashima and N. Tsuji:
Mater. Sci. Eng. A528(2010) 776779.
14) S. Hata, H. Miyazaki, S. Miyazaki, M. Mitsuhara, M. Tanaka, K. Kaneko, K. Higashida, K. Ikeda, H. Nakashima, S. Matsumura, J. S. Bamard, J. H. Sharp and P. A. Midgley:Ultramicroscopy111(2011) 11681175.
15) G. K. Williamson and W. H. Hall:Acta Metall.1(1953) 2231.
16) G. K. Williamson and R. E. Smallman:Philos. Mag.1(1956) 3446.
17) G. K. Williamson and R. E. Smallman:Acta Cryst.7(1954) 574581.
18) Y. Tomota, P. Lukas, S. Harjo, J.-H. Park, N. Tuchida and D. Neov:
Acta Mater.51(2003) 819830.
19) S. Morooka, Y. Tomota, Y. Adachi, S. Morito and T. Kamiyama: Tetsu-to-Hagane94(2008) 313320.
20) W. G. Johnston and J. J. Gilman:J. Appl. Phys.30(1959) 129144.
21) C. Y. Yu, P. W. Kao and C. P. Chang:Acta Mater.53(2005) 4019 4028.
22) N. Kamikawa: PhD Thesis, Osaka University, (2005).