Evolution of Electrical Conductivity in Silver-Loaded Electrically Conductive
Adhesives Composed of an Amine-Cured Epoxy-Based Binder
Yoshiaki Sakaniwa
1,*, Yasunori Tada
2and Masahiro Inoue
21Graduate School of Science and Technology, Gunma University, Kiryu 376–8515, Japan
2Advanced Scientific Research Leaders Development Unit, Gunma University, Kiryu 376–8515, Japan
To investigate interfacial phenomena related to the evolution of electrical conductivity in electrically conductive adhesives containing silver fillers, the curing processes of model adhesives composed of an amine-cured epoxy-based binder were examined using several analytical methods. Shrinkage of the adhesives during curing was not a predominant factor in determining the electrical resistivity. Rearrangement of the fillers occurred at the onset of gelation. Afterwards, the electrical conductivity evolved in the adhesives through the following two steps: devel-opment of conduction paths during gelation of the epoxy-based binder, and microstructural evolution between the silver fillers. The use of adipic acid as a surfactant enhanced the first of these steps during gelation. The latter process occurred concurrently with cross-linking of bind-er molecules to increase the elastic modulus. In this step, the amine molecules probably reacted with silvbind-er fillbind-ers to induce necking between the fillers. Because interfacial chemical phenomena probably influence the electrical conductivity evolution, the conventional hypothesis, which is based on the mechanical contact concept for inter-filler contacts in electrically conductive adhesives, needs to be expanded.
[doi:10.2320/matertrans.MD201511]
(Received December 10, 2015; Accepted March 28, 2016; Published May 25, 2016)
Keywords: electrical conductivity, shrinkage, binder chemistry, surfactant, interfacial reaction
1. Introduction
Electrically conductive adhesives (ECAs), which are com-posites of an organic polymer matrix containing conductive fillers, are a type of connecting material that is widely used in electronics packaging1). Recently, scientists have pursued im-provements in the performance of ECAs for more effectively applications to advanced electronic devices such as power devices and flexible devices. Because the electrical conduc-tivity of an adhesive is determined by its curing process, fac-tors that influence the evolution of electrical conductivity during curing should be clarified to establish materials design protocols for advanced ECAs.
The electrical resistivity of an ECA is influenced by the following two factors: dispersion states of the fillers (e.g. mi-crostructure of the filler network), and inter-filler electrical resistance. To improve the electrical conductivity, several concepts for controlling the microstructure of the filler net-work have been proposed2,3). For example, fillers with bimod-al particle-size-distributions3) are often used in ECAs for practical applications.
However, the electrical conductivity of an ECA is not only determined by the filler network microstructure. The in-ter-filler electrical resistance is also an important factor in determining the electrical conductivity through the filler net-work4). According to the conventional model5) for inter-filler conductive contacts, the inter-filler resistance can be divided into two components: the constriction resistance, and the re-sistance for charge transfer across the insulative gap. In the case of ECAs containing metallic fillers, such as silver (Ag), tunneling effects are thought to contribute to the latter resis-tance component6). However, the details of the conduction mechanism remain unclear.
As a strategy to decrease the inter-filler electrical resis-tance, direct bonding between fillers by sintering Ag
nanopar-ticles7) and dendrites8) could be effective. Direct bonding be-tween fillers could also be achieved by a transient liquid phase reaction to form intermetallic compounds using metal particles that have lower melting points9).
However, it is generally known that the electrical resistivi-ties in ECAs vary with chemical factors, including chemical composition of the binder (binder chemistry) and surfactants adsorbed on the fillers10,11). This implies that the inter-filler electrical resistance could also be controlled by interfacial chemical phenomena. Hence, we previously proposed a strat-egy to decrease the inter-filler resistance in ECAs based on changing chemical factors12). This strategy could be applied to adhesives containing common fillers as well as those con-taining advanced fillers, such as nanoparticles and dendrites.
In the present work, the evolution of electrical conductivity during curing in model epoxy-based adhesives containing Ag micro-particles was investigated in detail. Among candidate chemicals that were evaluated for control of the inter-filler electrical contacts, an amine-based curing agent was selected for the epoxy-based binder because amine molecules may participate in an interfacial chemical reaction with the Ag particles. In addition, a dicarboxylic acid surfactant was se-lected for the Ag particles. These chemicals can influence electrical conductivity evolution in the adhesive through con-ductive path development in the gelation stage of curing and subsequent necking between the particles. The results ob-tained in this work will be useful for establishing materials design protocols based on the control of interfacial chemistry for ECAs containing Ag fillers.
2. Experimental
2.1 Materials
An epoxy resin, 4,4-methylenebis(N,N-diglycidylaniline) (Sigma-Aldrich, St. Louis, MO, USA) was selected as the main component of the binder for the ECAs. Tetraethylene-pentamine (mixture of ethyleneamine) (Wako Pure Chemical *
Corresponding author, E-mail: [email protected]
Industries, Osaka, Japan) was used as the curing agent for the binder. An excess of the curing agent (amount-of-substance fraction = 165% of the stoichiometric composition) was mixed into the epoxy resin to prepare the epoxy-based binder. Silver micro-particles (average particle size = 2.5 μm) pre-pared by the water-atomization process (Fukuda Metals & Foils Co. Ltd., Kyoto, Japan) were used as fillers. Because no surfactants were used during preparation of the water-atom-ized particles, surface treatment was conducted using adipic acid (Wako Pure Chemical Industries) in some cases.
The surface treatment was performed as follows. First, Ag particles (6 × 10⁻³ kg) were added into an ethanol solution (1 × 10⁻⁴ m3) containing 14.0 kg m−3 of adipic acid. The eth-anol solution was then sonicated for 6 h using an ultrasonic cleaner (Sono Cleaner 100D, Kaijo Co. Ltd., Japan). After sonication, the Ag particles were separated from the ethanol solution using a sedimentation technique, and then washed by sonication in 5 × 10⁻⁵ m3 of ethanol for 6 h. The washed par-ticles were separated from the ethanol and then dried at 343 K for 10 h.
After surface treatment, approximately 6 × 10⁻⁴% (mass fraction) of the adipic acid was adsorbed on the Ag particles. To obtain the ECA pastes, the particles were mixed into the binder at a mass fraction of 85%. All the chemicals were used as received.
2.2 Measurement of electrical resistivity
Lines of the ECA pastes (3.0 mm × 76 mm × 30 µm) were formed on a glass substrate by screen printing. The adhesives were cured at 353–473 K for 1 h in air. The electrical resistiv-ity values of the cured adhesives were measured by the four-point probe method using a low resistivity meter (MCP-T610, Mitsubishi Chemical Analytech Co. Ltd. Kanagawa, Japan). If the electrical resistivity of an adhesive exceeded the mea-suring range of the equipment, a digital electrometer (8340A, ADC Co. Ltd., Tokyo, Japan) was used to measure the electri-cal resistivity under an applied voltage of 50 V.
2.3 Analytical method of filler dispersion in the adhe-sives
The cross-sectional microstructure of each cured adhesive was observed by scanning electron microscopy (SEM). To characterize the dispersion states of fillers in the ECAs, two types of statistical analyses were conducted on the SEM im-ages, including a quadrat method using Morisita s overlap index (Iδ)2,13) and inter-centroid distance measurement for adjacent particles. Each image analysis was performed using a random area of 1200 μm2 that contained about 300 parti-cles.
In the quadrat method, the index Iδ, which is an important parameter to characterize the dispersion state of fillers, is giv-en by the following equations:
Iδ=qδ (1)
δ= ni(ni−1)/(N/(N−1)) (2)
where N is the total number of particles, q is the dividing number, and ni is the number of particles in the i-th section.
In the distance method, the inter-centroid distance of adja-cent Ag particles in the cross-sections was calculated using an
original algorithm. In this analysis, the coordinates of the centroid, G(x0, y0), were calculated by dividing static moment of area by cross-sectional area for each particle. Then, the inter-centroid distance was defined as the distance between nearest neighbor particles. Image analysis of the cross-sec-tions was performed using the following procedure. First, the particles in the cross-sections were divided into elemental ar-eas with cross-sectional arar-eas of Ai. The cross-sectional area
of a particle, A, is represented by eq. (3).
A= Ai (3)
The static moment of area for each particle was calculated using the coordinates of the centroid for these elemental ar-eas, Gi(xi, yi):
Sx= Aiyi=Ay0 (4)
Sy= Aixi=Ax0 (5)
where Sx and Sy are the static moment of a particle based on
the x- and y-coordinates, respectively. The coordinates of the centroid, G(x0, y0), were obtained using eqs. (4) and (5). After calculating the coordinates of the centroid for all particles in the cross-sections, the inter-centroid distance between nearest neighbor particles was calculated.
2.4 Analysis of the adhesive curing process
Shrinking of the adhesives during curing was monitored by noncontact measurement using a laser displacement meter (CUSTROM, Sentech Co. Ltd., Osaka, Japan). In this mea-surement, changes in the height of the substrate and the adhe-sive sample were monitored concurrently using laser dis-placement meters to estimate the shrinkage ratio, Δh/h0, where Δh is the change in height from the initial height (h0). In addition, reactions that occurred in the adhesives (sample weight = 10 mg) during curing were analyzed using thermo-gravimetric-differential thermal analysis (TG-DTA). The composition of the gas produced from the adhesives (sample weight = 5 mg) during curing was analyzed using pyroly-sis-gas chromatography-mass spectrometry and evolved gas analysis-mass spectrometry (EGA/MS).
In these analyses, the adhesive specimens were heated at a rate 1.67 × 10⁻¹ K s−1 from ambient temperature to the curing temperature, and then held at the curing temperature for 1 h.
2.5 Simultaneous measurement of changes in viscoelas-ticity and electrical resistance14)
To investigate the relationship between the electrical con-ductivity evolution and curing behavior of the adhesives, a free-damped osculation method (FDOM) using a ridge-body pendulum15) (RPT-300W, A&D Co. Ltd., Tokyo, Japan) was applied for viscoelastic characterization of the ECAs during curing. In this method, variations in the viscoelastic proper-ties of the adhesives were analyzed based on the period and logarithmic damping ratio of a free-damped oscillation of a rigid-body pendulum. The storage modulus and loss modulus were calculated as follows:
tp∝(1/E)1/2 (6)
where tp is the period, Λ is the logarithmic damping ratio, E′
is the storage modulus, and E′′ is the loss modulus.
Variation in the electrical resistance of the adhesives during curing was monitored simultaneously using a digital elec-trometer during curing. The initial applied voltage was 5 V, and this was halved if the current exceeded 20 mA. Repeating the operation enabled continuous measurement of electrical resistance of the specimens during curing.
The adhesives were heated at a rate of 1.67 × 10⁻¹ K s−1 from ambient temperature to the curing temperature, and then the temperature was held at the curing temperature for 1 h. The adhesives were subsequently cooled at a rate of 8.33 × 10⁻² K s−1 to 323 K.
3. Results and Discussion
3.1 Electrical resistivities of the ECAs
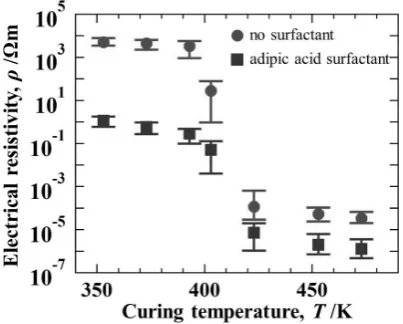
Figure 1 shows the relationship between electrical resistiv-ity and curing temperature for the adhesives containing Ag particles, with and without adipic acid as a surfactant. The electrical resistivities of these adhesives greatly decreased when the curing temperature was increased from 403 to 423 K.
In addition, the adhesives with surfactant exhibited lower electrical resistivity than those with no surfactant at curing temperatures from 353 to 473 K. When the adhesives were cured at 473 K, the electrical resistivity reached 3 × 10⁻⁵Ωm for the adhesive with no surfactant and 1 × 10⁻⁶Ωm for that with surfactant.
The electrical resistivity of each adhesive was found to vary depending on the curing temperature and surface treat-ment of the fillers. It has been proposed that the electrical re-sistivity of an ECA is mostly determined by shrinkage of the binder during curing16,17). By contrast, Kohinata et al.18) re-cently pointed out that shrinkage during curing does not al-ways influence the electrical resistivity of an ECA. Therefore, we investigated the effect of shrinkage during curing on the electrical resistivities of these adhesives.
Figure 2 shows the relationship between curing tempera-ture and shrinkage after cooling from the curing temperatempera-ture to ambient temperature. The shrinkage ratio for each adhesive
varied depending on the curing temperature, regardless of the surface treatment of fillers. A large increase was observed in the shrinkage ratio as the curing temperature was increased from 373 to 403 K. After this, the shrinkage ratio remained constant between 403 and 423 K. Then, the ratio increased again with increasing curing temperature.
A comparison between the dependencies of the electrical resistivities and shrinkage ratios on the curing temperature showed that shrinkage during curing was not a predominant factor in determining the electrical resistivities of the adhe-sives. Although the shrinkage ratio remained relatively con-stant, the electrical resistivity greatly decreased when the cur-ing temperature was increased from 403 to 423 K. In addition, the electrical resistivity decreased with surface treatment of the fillers, while surface treatment did not affect the shrinkage ratio. Therefore, during curing, the electrical resistivities and shrinkage of the adhesives were influenced by different phe-nomena.
3.2 Microstructural features of the adhesives
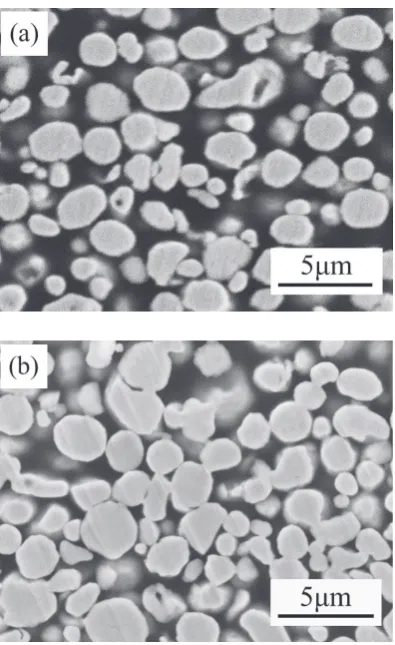
Figure 3 (a) and (b) shows cross-sectional SEM images of adhesives with no surfactant cured at 373 and 453 K, respec-tively. The adhesive cured at 453 K had a higher packing den-sity of the fillers than that cured at 373 K. Microstructural analyses were performed using the SEM images.
Figure 4 shows the relationship between the Morisita s overlap index (Iδ) and dividing number (q) of the cross-sec-tional images calculated using eqs. (1) and (2). The Iδ values were calculated for the adhesives with and without the surfac-tant cured at 373 and 453 K. These specimens exhibited sim-ilar behavior for the Iδ values versus q. The Iδ values decreased with increasing dividing number. The shapes of the Iδ-q curves indicated the fillers in these specimens had similar uniform distributions2,13).
By contrast, a large difference was observed in the distribu-tion of the inter-centroid distance between adjacent Ag fillers in the cross-sectional images. Figure 5 shows histograms of the inter-centroid distance between adjacent fillers for the ad-hesive with no surfactant after curing at 373 and 453 K. The mode of the inter-centroid distance slightly decreased with increasing curing temperature, although no differences were
Fig. 1 Curing temperature dependence (isothermal curing time = 1 h) of the electrical resistivity of adhesives containing Ag fillers with and without adipic acid as a surfactant.
[image:3.595.325.527.584.751.2] [image:3.595.68.270.590.752.2]observed in the shapes of the histograms.
In addition to variation in the inter-centroid distance be-tween adjacent fillers, the interfacial structure bebe-tween the fillers evolved during curing at 453 K. Figure 6 shows a high magnification cross-sectional SEM image of the adhesive with no surfactant after curing at 453 K. Necking was appar-ent between some fillers. This means that the filler network in this specimen includes domains that are formed by necking among several fillers. The detailed microstructural
character-ization of ECAs cured at several temperatures showed that necking between the particles occurred at approximately 423 K. Furthermore, no large differences in the microstruc-tural features were observed in the adhesives with and with-out the surfactant.
The microstructural evolution in the adhesives suggests an interfacial reaction occurs between the binder and fillers during curing. The necking between the fillers could contrib-ute to a decrease in the electrical resistivity of the adhesives because the interfacial electrical resistance should decrease. Additionally, the adhesive with the surfactant exhibited lower electrical resistivity than that with no surfactant suggesting that an interfacial reaction occurred, decreasing the electrical resistivity. To clarify the effect of these interfacial phenomena on evolution of the electrical conductivity, the curing process of the adhesives should be analyzed in detail.
3.3 Effect of Ag fillers on the curing reaction of the bind-er
To investigate electrical conductivity development in the ECAs, the curing process was analyzed, because electrical conductivity always evolves during curing. First, changes in curing reaction of the epoxy-based binder caused by addition of Ag particles were investigated by measuring TG-DTA
Fig. 3 Cross-sectional SEM images of the adhesive containing Ag fillers with no surfactant cured at (a) 373 and (b) 453 K for 1 h.
Fig. 4 Relationship between Morisita s overlap index and the dividing number obtained by statistical analyses of the cross-sectional SEM imag-es of the adhimag-esivimag-es.
Fig. 5 Curing temperature dependence of the inter-centroid distance distri-butions between adjacent Ag fillers in the cross-sectional SEM images of the adhesive with no surfactant.
[image:4.595.325.527.66.245.2] [image:4.595.71.269.67.390.2] [image:4.595.325.527.309.442.2] [image:4.595.67.268.439.612.2]curves during isothermal heating at 453 K for 1 h (heating rate = 1.67 × 10⁻¹ K s−1, cooling rate = 8.33 × 10⁻² K s−1).
Figure 7 (a) and (b) shows the TG-DTA curves of the ep-oxy-based binder without Ag fillers and the adhesive contain-ing Ag fillers with no surfactant, respectively. In the case of the epoxy-based binder without Ag fillers (Fig. 7 (a)), an exo-thermic peak that was caused by the curing reaction of the epoxy resin was detected at 343–393 K. An endothermic peak was observed after this. The exothermic curing reaction of the epoxy resin with the Ag filler (Fig. 7 (b)) occurred at a similar temperature range to that without the fillers. However, rather than showing an endothermic peak after the exothermic peak, the adhesive with the fillers exhibited another exothermic peak.
Although these adhesives exhibited different reaction be-havior after the curing reaction, they both decreased in weight because of the release of gases during curing. EGA/MS spec-troscopy was used to determine the composition of the gases released by curing. Figure 8 shows the EGA/MS ion chro-matograms of the Ag-loaded adhesive during heating at a rate of 1.67 × 10⁻¹ K s−1 and a subsequent isothermal hold at 453 K. From comparison with the results of pyrolysis-gas chromatography-mass spectrometry, the peaks at m/z = 116 and 142 were identified as fragments originating from tetra-ethylenepentamine and ethyleneamine, respectively. The peak at m/z = 99 was identified as fragments originating from both tetraethylenepentamine and ethyleneamine. The peak at
m/z = 18 was identified as water. The mass spectrometry re-sults suggested that most of the gas produced by curing orig-inated from the curing agent (tetraethylenepentamine and
ethyleneamine) and water impurities.
Although an endothermic peak caused by the volatilization of curing agent was detected in the epoxy-based binder with-out Ag fillers, an exothermic peak was observed in the Ag-loaded adhesive. This suggests an interfacial chemical reaction occurred between the amine molecules and surfaces of the Ag fillers.
3.4 Evolution of electrical conductivity in the adhesive with no surfactant
To investigate the curing process of the adhesive in more detail, viscoelastic characterization using the FDOM was per-formed simultaneously with electrical resistance monitoring. Figure 9 shows the results of the simultaneous measurement of the viscoelastic properties (period and logarithmic damp-ing ratio of the oscillation of pendulum) and electrical resis-tance for the adhesive with no surfactant during curing at 453 K for 1 h. The curing behavior of the adhesive occurred in three stages. The logarithmic damping ratio of oscillation of the pendulum gradually increased between 320 and 420 K, although the period of the oscillation exhibited no significant changes. This indicates that gelation of the epoxy-based bind-er occurred in this tempbind-erature range (Stage (2) in Fig. 9). Then, the period of the oscillation began to decrease rapidly at 420 K. This decrease in the period indicates cross-linking of the polymer structure was induced in the adhesive to in-crease the elastic modulus (Stage (3) in Fig. 9). In addition, a decrease in viscosity was induced before gelation, although this was not detected under the present conditions of the vis-coelastic characterization (Stage (1) in Fig. 9). The decrease in viscosity before gelation was confirmed using a different viscometer (Brookfield viscometer with thermosel system).
A comparison of the results from TG-DTA (Fig. 7 (b)) and the viscoelastic characterization (Fig. 9) showed that the on-set of the exothermic peak, caused by the curing reaction of the epoxy resin, agreed well with the onset of gelation. There-fore, the cross-linking reaction was apparently induced in the latter part of the exothermic curing reaction.
Figure 9 also shows the variation in electrical resistance of the adhesive during curing. Although the electrical resistance tended to decrease in Stage (1), the resistance greatly in-creased at the onset of the gelation. This increase in electrical resistance was caused by rearrangement of the Ag fillers
be-Fig. 7 TG-DTA curves obtained during isothermal curing for 1 h at 453 K for the adhesives containing (a) no fillers and (b) Ag fillers.
Fig. 8 EGA-MS ion chromatograms of the adhesive with no surfactant during heating at a rate of 1.67 × 10⁻¹ K s−1 and a subsequent isothermal
[image:5.595.54.287.70.374.2] [image:5.595.315.528.70.211.2]cause of rapid shrinkage of the binder11). However, the elec-trical resistance decreased over two stages after the rearrange-ment of fillers. First, the electrical resistance decreased in Stage (2) as the electrical conduction paths evolved rapidly during gelation of the binder. Then, the electrical resistance began to decrease again at approximately 440 K. The onset of the decrease in resistance agrees with the second exothermic peak observed in the DTA curve shown in Fig. 7 (b). This implies that an interfacial reaction occurred between the amine molecules and surface of Ag particles in this step, and this reaction induced the decrease in inter-filler electrical re-sistance in this step. Necking between Ag particles is inferred to occur in this step.
3.5 Relationship between evolution of electrical conduc-tivity and shrinkage in the adhesive during curing
The effect of shrinkage on the electrical conductivity evo-lution in the adhesive during curing was evaluated. Figure 10 (a) and (b) shows the shrinkage behavior of the adhesive during curing at 373 and 453 K, respectively. In these cases, the adhesive was heated to the curing temperatures at a rate of 1.67 × 10⁻¹ K s−1, and this was followed by isothermal ing for 1 h. The adhesive thermally expanded during the heat-ing step, and then shrunk.
To examine the cause of this shrinkage, viscoelastic char-acterization was performed using the FDOM simultaneously with electrical resistance monitoring. The results obtained during curing at 453 K are shown in Fig. 9. The results ob-tained during curing at 373 K are presented in Fig. 11. The viscoelastic characterization indicated gelation was initiated at approximately 320 K during the heating step because the logarithmic damping ratio gradually increased. Figure 10 (a) and (b) suggests that shrinkage caused by the curing reaction appeared to compete with the thermal expansion after gela-tion was initiated. The volume of the adhesive decreased to less than the initial volume in the final stage of gelation.
Figures 9 and 11 also show changes in the electrical resis-tance during curing. These results show the electrical conduc-tivity was initiated during gelation. Figure 10 (a) and (b) sug-gests that the adhesive expanded to more than the initial volume when the electrical conductivity was initiated. This
implies shrinkage caused by the curing reaction was a domi-nant factor in the initiation of electrical conductivity.
When the adhesive was cured at 453 K, the electrical resis-tance started to decrease again at approximately 440 K. Fig-ure 10 (b) suggests that the adhesive shrunk to less than the initial volume in this step. The electrical resistance continued to decrease until 400–600 s after the initiation of isothermal heating. However, because necking between Ag particles
[image:6.595.155.441.70.242.2]oc-Fig. 9 Results of the FDOM with electrical resistance monitoring during isothermal curing for 1 h at 453 K for the adhesive containing Ag fillers with no surfactant.
[image:6.595.312.541.298.621.2]curred in this adhesive, the electrical conductivity evolution in this step could not be explained by the conventional theory, which is based only on enhancement of inter-filler contacts caused by shrinking. To interpret this electrical conductivity evolution, the theory for analyzing inter-filler conductive con-tacts should be expanded to include necking between the par-ticles.
After this electrical conductivity development with neck-ing between the particles, the adhesive continued shrinkneck-ing until the isothermal heating was complete, and in this time it shrunk an additional 10–15%. However, this additional shrinkage during isothermal heating did not increase the elec-trical conductivity any further.
3.6 Evolution of electrical conductivity in the adhesive with surfactant
Surface treatment using adipic acid was effective to im-prove the electrical conductivity of the adhesive as shown in Fig. 1. To investigate how the adipic acid surfactant affected evolution of the electrical conductivity in the adhesive, visco-elastic characterization using a rigid-body pendulum was conducted simultaneously with electrical resistance
monitor-ing.
Figure 12 shows the results of the simultaneous measure-ment of the viscoelastic properties and electrical resistance for the adhesive with adipic acid surfactant during curing at 453 K for 1 h. The curing process of this adhesive occurred in three stages that were similar to those observed for the adhe-sive with no surfactant. In addition, the electrical resistance of this adhesive also exhibited similar behavior to that without the surfactant during curing. The surfactant effectively en-hanced the decrease in electrical resistance during gelation but did not change the electrical conductivity evolution be-havior. No large differences were observed between the adhe-sives with and without the surfactant for their microstructural features, such as necking between the fillers. Therefore, the adipic acid surfactant does not affect the interfacial reaction that results in necking and occurs at temperatures above ap-proximately 440 K.
3.7 The mechanism of electrical conductivity evolution
The investigation of the curing process clarified that elec-trical conductivity evolved in the adhesives through the fol-lowing two steps: conduction path development during
[image:7.595.155.441.71.247.2]gela-Fig. 11 Results of the FDOM with electrical resistance monitoring during isothermal curing for 1 h at 373 K for the adhesive containing Ag fillers with no surfactant.
[image:7.595.157.439.298.471.2]tion of the epoxy-based binder, and microstructural evolution between Ag particles. Adipic acid surfactant effectively en-hanced conduction path development to improve electrical conductivity of the adhesive. Some scientists believe that adipic acid can reduce oxides present on the surface of Ag fillers during curing to decrease the electrical resistivity of ECAs7). In the present study, we confirmed that this type of reaction could occur at temperatures above approximately 500 K for the Ag particles. Therefore, the reaction induced by adipic acid at 350–400 K is probably not reduction of oxides on the surfaces of the Ag fillers.
According to our previous report10,11), the process of con-duction path development commonly occurs in ECAs during curing. The conduction paths can be formed even in the gela-tion stage. Although the exact details of the reacgela-tion mecha-nism remain unclear, some interfacial phenomena probably influence formation of inter-filler conductive contacts.
In the present adhesives, microstructural evolution between Ag fillers occurred concurrently with the cross-linking of binder molecules, and this was probably induced by the inter-facial reaction between the amine molecules and surface of Ag fillers. A chemical reaction, such as the formation and de-composition of organometallic compounds (i.e. silver-amine complexes)19), may occur to induce necking between the fill-ers.
The electrical conductivity of ECAs is usually interpreted based on the mechanical inter-filler contact model. However, this work suggests that some interfacial reactions can influ-ence the inter-filler conductive contacts to improve the elec-trical conductivity of the adhesives. Therefore, the conven-tional hypothesis for inter-filler conducting contacts in ECAs needs to be expanded to take into consideration inter-filler conductive contact formation and microstructural evolution with interfacial chemical phenomena. Studies of inter-filler contacts based on this expanded viewpoint will lead to large improvements in the electrical conductivity of ECAs.
4. Conclusion
This work investigated the evolution of electrical conduc-tion paths in adhesives composed of an amine-cured ep-oxy-based binder containing Ag fillers. The results were used to determine what factors influenced electrical conductivity in the adhesives. The main results obtained in this work are summarized below:
(1) Shrinkage of the binder during curing was not a predom-inant factor in determining electrical resistivity of the ad-hesives.
(2) Investigation of the curing process clarified that the elec-trical conductivity evolved in the adhesives through con-duction path development during gelation of the ep-oxy-based binder and microstructural evolution between the Ag fillers.
(3) Addition of adipic acid as a surfactant effectively en-hanced the electrical conductivity evolution during
gela-tion.
(4) Necking between Ag particles was induced by some in-terfacial reactions with amine molecules, which de-creased the electrical resistivities of the adhesives. (5) The conventional hypothesis based on the mechanical
contact concept for inter-filler conducting contacts in ECAs needs to be expanded to take into consideration interfacial chemistry to enhance the contacts.
(6) Materials design protocols based on the control of inter-facial chemistry for ECAs containing Ag fillers will be useful for developing advanced ECAs.
Acknowledgements
This work was supported by a grant from The Fujikura Foundation. Special thanks are given to Mr. T. Tanaka and Mr. Y. Sugoh (A&D Co. Ltd., Tokyo, Japan) for assistance with the free-damping oscillation method using a rigid body pendulum.
REFERENCES
1) I. Mir and D. Kumar: Int. J. Adhes. Adhes. 28 (2008) 362–371. 2) M. Sumita, K. Sakata, Y. Hayakawa, S. Asai and K. Miyasaka: Colloid
Polym. Sci. 270 (1992) 134–139.
3) Y. Fu, J. Liu and M. Willander: Int. J. Adhes. Adhes. 19 (1999) 281– 286.
4) O. Arao, A. Shintai and A. Sugiura: J. Jpn. Inst. Electron. Packag. 16 (2013) 127–135 (in Japanese).
5) J. E. Morris: Conductive Adhesives for Electronics Packaging (ed. J. Liu), (Electrochemical Publications, Port Erin, 1999) pp 36–77. 6) J. C. Agar, K. J. Lin, R. Zhang, J. Durden, K. Lawrence, K.-S. Moon
and C. P. Wong: Proc. 2010 Electron. Comp. Technol. Conf. (ECTC) (IEEE CPMT, 2010) pp.1713–1718.
7) R. Zhang, K.-S. Moon, W. Lin and C.P. Wong: J. Mater. Chem. 20 (2010) 2018–2023.
8) C. Yang, X. Cui, Z. Zhang, S. W. Chiang, W. Lin, H. Duan, J. Li, F. Kang and C. P. Wong: Nat. Commun. (2015) DOI:10.1038/
ncomms9150.
9) Y.-S. Eom, K.-S. Choi, S.-H. Moon, J.-H. Park, J.-H. Lee and J.-T. Moon: ETRI Journal 33 (2011) 864–870.
10) Y. Sakaniwa, Y. Tada and M. Inoue: Proc. Int. Conf. Electron. Packag-ing (ICEP) 2014 (Jpn. Inst. Electron. PackagPackag-ing, 2014) pp.176–180. 11) Y. Sakaniwa, M. Iida, Y. Tada and M. Inoue: Proc. Int. Conf. Electron.
Packaging (ICEP) 2015 (Jpn. Inst. Electron. Packaging, 2015) pp.252– 257.
12) M. Inoue: J. Jpn. Inst. Electron. Packag. 16 (2013) 380–383 (in Japa-nese).
13) M. Morisita: Memoirs of the Faculty of Science, Kyushu Univ., Series E (Biology) 2 (1959) 215–235.
14) M. Inoue, T. Notsuke, Y. Sakaniwa and Y. Tada: Proc. 2015 Electron. Comp. Technol. Conf. (ECTC) (IEEE CPMT, 2015) pp.146–150. 15) ISO12013-1, ISO12013-2 (2012).
16) D. Lu and C.P. Wong: Int. J. Adhes. Adhes. 20 (2000) 189–193. 17) A. Mikrajuddin, F.G. Shi, S. Chungpaiboonpatana, K. Okuyama, C.
Davidson and J.M. Adams: Mater. Sci. Semicond. Process. 2 (1999) 309–319.
18) S. Kohinata, Y. Shiraki, M. Inoue and K. Uenishi: J. Smart Process. 3 (2014) 246–253 (in Japanese).