Influence of Silicon Content, Strain Rate and Temperature on Toughness and
Strength of Solid Solution Strengthened Ferritic Ductile Cast Iron
Tomohiro Ikeda
1,*, Takuo Umetani
1, Nobuhiro Kai
1, Keisaku Ogi
1, Nao-Aki Noda
2and Yoshikazu Sano
21Research & Development Center, HINODE, Ltd., Saga 849–0101, Japan
2Department of Mechanical and Control Engineering, Kyushu Institute of Technology, Fukuoka 804–8550, Japan
High Silicon Solid Solution Strengthened Ferritic Ductile Cast Iron possesses advantages, such as better combination of strength-elonga-tion, higher fatigue strength, smaller section thickness sensitivity, higher machinability etc., over conventional ferrite-pearlite type ductile cast iron. However, industrial application of high Si ductile cast iron is still very limited, because of the lower Charpy impact value at room tempera-ture. As the toughness of iron strongly depends on the strain rate as well as temperature, dynamic three-point bending tests are conducted on 3 4%Si ferritic ductile cast iron at stroke speed of 10−3 102 mm/s, and at −20 22 C. The relations of the crack initiation energy E
i, the crack
propagation energy Ep, the total absorbed energy Et and the maximum bending stress σb,max to the strain rate show abrupt dropping of these
characteristic values at critical strain rate, depending on silicon content and test temperature. σb,max keeps increasing with increasing strain rate
˙
ε as far as the fracture origin is ductile, it slightly decreases over ε˙σ = ε˙f D where the dimple fracture completely disappears. σb,max, Et and Ei of
each silicon iron is well expressed in relation to strain rate-temperature parameter R, T ln(A/ε˙ ). The critical R values for Et, Ei, and σb,max (Rt, Ri
and Rσ) decrease linearly with decreasing the silicon content of iron. The critical value for σb,max (Rσ) is lowest, indicating Rσ gives a wider
design tolerance. [doi:10.2320/matertrans.F-M2016832]
(Received April 25, 2016; Accepted September 2, 2016; Published October 14, 2016)
Keywords: high silicon ductile cast iron, ferritic matrix, dynamic strength, toughness, strain rate, temperature
1. Introduction
In recent years, high silicon ductile cast iron containing 3.2 to 4.2%Si has been attracting attention as a new candidate for various mechanical and structural components1–3). The three strength-elongation levels of high silicon ductile cast iron are already standardized in EN as High Silicon Solid Solution Strengthened Ferritic Ductile Cast Iron 4). In this high silicon ductile cast iron, higher strength is obtained by increasing sil-icon addition, while the pearlite ratio should be controlled to attain the required strength in the conventional ferrite-pearlite type ductile cast iron. Although the elongation of high silicon ductile cast iron decreases with increasing silicon content, the elongation is higher than that of similar strength level of con-ventional ferrite-pearlite type ductile cast iron5).
As the mechanical properties of high silicon ductile cast iron are controlled mostly by silicon content and higher sili-con strongly promotes stable solidification, this iron shows much smaller section thickness sensitivity especially in heavier castings. Furthermore, high silicon ductile cast iron possesses a better machinability, and hence a higher produc-tivity, than the conventional ductile cast iron. Contrary to these advantages, high silicon ductile cast iron shows a brittle fracture near room temperature in Charpy impact test, since the ductile-brittle transition temperature rises with the in-crease in silicon content of ferritic matrix6–8). This should be a main reason why industrial application of high silicon duc-tile cast iron is still very limited.
However, Charpy impact test is sometimes not suitable for evaluating the impact strength for structural component de-sign, because the impact speed does not correspond to the real products failure. The toughness of iron strongly depends on the strain rate as well as temperature, and ductile-brittle tran-sition temperature of conventional ductile cast iron becomes
higher with the increase in strain rate9,10). But, it is difficult to control the pendulum impact speed in Charpy impact test. Moreover, it should be noted that Charpy absorbed energy has not been directly used as design strength.
Therefore, a key objective of this study is investigating the influence of strain rate and temperature on toughness and strength of ferritic ductile cast iron containing from 3 to 4%Si. Using Charpy V-notch specimens, the three-point bending tests are conducted at stroke speed = 10−3 102 mm/s, and at −20 22 C. Based on obtained load-displacement curves, the absorbed energy in fracture process and the notch bending strength are determined. The results are discussed with the strain rate-temperature parameter.
2. Experimental Procedure
2.1 Test materials
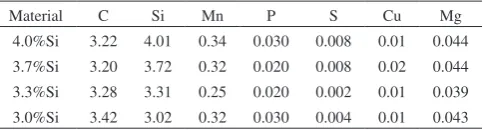
With 300 kW high frequency electric furnace and a ladle, ductile cast iron melts containing from 3 to 4%Si were pre-pared by the Sandwich Method and cast into sand molds for JIS Type II Y-shaped blocks11). Table 1 shows their chemical compositions. The silicon content was varied from 4.01% to 3.02%. The carbon content was also changed from 3.22 to 3.42% to keep the carbon equivalent about 4.4. All test sam-ples were taken from the as cast blocks, as shown in Fig 1.
Figure 2 shows typical microstructures of as cast test sam-ples. Apparently all samples have fully ferritic matrix.
Ta-*
[image:1.595.307.549.722.787.2]Corresponding author, E-mail: [email protected]
Table 1 Chemical compositions of as cast samples.
Material C Si Mn P S Cu Mg
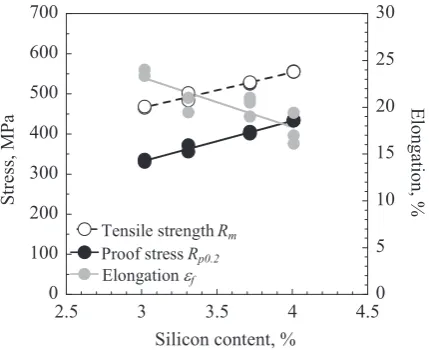
sile tests were made on JIS No.4 test piece with the diame-ter = 14 mm and the gage length = 50 mm according to JIS-Z 2241 standard14). The tensile strength and the proof stress linearly increase and the elongation decreases with increasing
at −20 22 C by using Electro hydraulic servo testing ma-chine (Shimadzu: E100kN). The bending jig was prepared in the same shape and size as the Charpy impact testing ma-chine, so that the span length Ls was 40 mm.
The strain rate ε˙ is calculated by using eq. (1)9,17–19), where
h = test specimen width, Q = 1.949,17,18), ν = stroke speed, L
s =
span length.
˙
ε=6hvQ/Ls2 (1)
Maximum nominal bending stress σb,max is calculated by
eq. (2)20,21), where P
max = maximum load, b = test specimen
thickness.
σb,max=3PmaxLs/2bh2 (2)
Figure 5 shows a typical load-displacement curve by the three-point bending test. Absorbed energy in the fracture pro-cess is obtained as the area under the load-displacement curve. Ei is absorbed energy before maximum load. It was
reported that the microcrack extends to the macrocrack larger than 0.1 mm at the vicinity of the maximum load, and then propagates22). Therefore, E
i is defined as the macroscopic
crack initiation energy. Ep is absorbed energy after the
maxi-mum load, that is, the crack propagation energy. Et is total
[image:2.595.50.293.231.376.2]Fig. 2 Microstructures of as cast samples.
Table 2 Microstructure characteristics and Brinell hardness of as cast samples.
Material Nodule countmm−2
Average nodule diameter, μm
Nodularity, % Graphite areafraction, % Pearlite ratio,%
Ferrite grain size number (JIS G 0551)
Brinell hardness
4.0%Si 208 26.7 91.5 10.5 0.0 8.0 182
3.7%Si 192 28.1 91.9 10.6 0.0 7.8 179
3.3%Si 202 27.3 90.2 10.2 0.0 8.0 171
3.0%Si 174 30.3 92.9 11.7 1.4 7.9 165
[image:2.595.71.271.417.642.2] [image:2.595.320.535.465.640.2] [image:2.595.46.549.704.787.2]absorbed energy, therefore Et = Ei + Ep.
Fractographic analysis was made with an optical microsco-py and Scanning Electron Microscomicrosco-py (Hitachi S-3400N). The ductile fracture surface ratio fD was evaluated as the ratio
of the ductile fracture surface area to the total fracture surface area of the specimen from photomicrographs taken on the whole specimen surface at 20-fold magnification. SEM ob-servation was also made to reveal the details of fracture mor-phology especially near V-notch root where the fracture start-ed.
3. Results and Discussions
3.1 Dependency of absorbed energy and notch bending strength on strain rate at 22 C for 4%Si ductile cast iron
Figure 6 shows the load-displacement curves tested under various strain rates ε˙ at temperature T = 22 C for 4%Si iron. Obviously, with increasing ε˙ the maximum displacement δmax
and hence Ep were decreasing. On the other hand, the
maxi-mum load Pmax slightly increases with increasing ε˙ . This
phe-nomenon might be similar to the increase in strength of iron and steel with increasing strain rate.
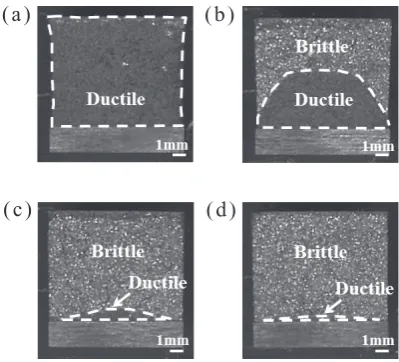
Figure 7 shows the fracture surface of tested specimens. The fracture surface is composed of black and white bright areas, and the black area significantly decreases with an in-crease in ε˙ . The SEM images on both areas, shown in Fig. 8, reveals that black area is made of dimple patterns characteriz-ing ductile fracture and the white area is cleavage fracture surface characterizing brittle fracture.
Based on the load-displacement curves in Fig. 6 and photo-graphs in Fig. 7, Et, Ep, Ei and ductile fracture surface ratio fD
are determined, and the results are given in relation to strain rate ε˙ , as shown in Fig. 9. The crack propagation energy Ep
and also the total absorbed energy Et start dropping at critical
strain rate ε˙p = 1.3 × 10⁻³ s−1, as indicated by the black arrow in the Fig. 9(a). As shown in Fig. 9(b), fully ductile fracture occurs below ε˙p , and the ductile fracture surface ratio fD starts
dropping drastically at ε˙p , thus the critical strain rate of fD is
in agreement with that of Ep. On the other hand, the
macroc-rack initiation energy Ei is almost unchanged even above ε˙p , indicating the reduction of Et is caused by the decrease in Ep.
And as explained above, the maximum nominal bending stress σb,max tends to increase with increasing ε˙ as in Fig. 10.
Figure 11 shows SEM image at the notch root in Fig. 7(d). Even though the photomicrograph shows almost no ductile fracture surface in Fig. 7(d), SEM images reveal that a slight amount of dimple patterns appear near the notch root. This slight amount of dimples should be caused by the initial stage of fracture. Several researchers examined the microcrack ini-tiation at the notch root under three-point bending test22,23).
Fig. 4 Dimension of Charpy V-notch specimen.
Fig. 5 Definition of absorbed energy on the three-point bending test.
Fig. 6 Load-displacement curves tested under various ε˙ at T = 22 C for 4%Si iron.
Fig. 7 Fracture surfaces tested at various ε˙ at T = 22 C for 4%Si iron. (a)
˙
ε = 0.01 × 10⁻² s−1, (b) ε˙ = 0.08 × 10⁻² s−1, (c) ε˙ = 0.19 × 10⁻² s−1, (d) ε˙ =
[image:3.595.48.290.68.335.2] [image:3.595.309.541.69.301.2] [image:3.595.50.296.69.167.2] [image:3.595.326.526.355.536.2]They reported that when ductile fracture occurs, an approxi-mately 50 μm microcrack initiates at the notch root22). At the same time, separation of spheroidal graphite and ferritic ma-trix was confirmed22). Then, the microcrack extends to the macrocrack larger than 0.1 mm at the vicinity of the maxi-mum load, and then propagates23). When brittle fracture oc-curs, a microcrack propagates rapidly almost at the same time of crack initiation23). Therefore, in Fig. 7(d), it is conjectured
that brittle fracture occurs just after forming the slight dimple ductile fracture at the notch root. In this experiment at T = 22 C, the dimple pattern is always observed at every notch root. Hence, σb,max keeps increasing with increasing ε˙ as far
as the fracture origin is ductile. We believe that σb,max could
be a significant criterion for designing various components.
3.2 Dependency of absorbed energy and notch bending strength on strain rate at −20 C for 4% Si ductile cast iron
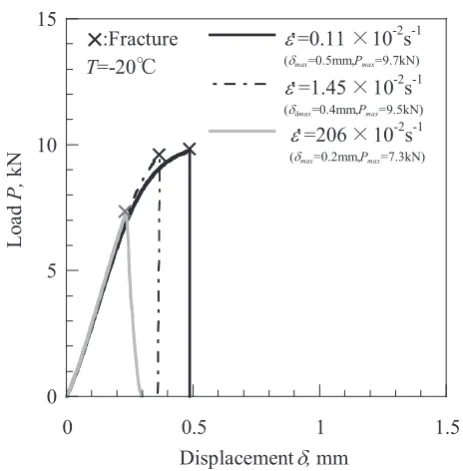
Figure 12 shows the load-displacement curves at lower temperature T = −20 C for 4%Si iron. Different from the test results at T = 22 C, the maximum load Pmax decreases at
high-er strain rate ε˙ , and almost no crack propagation energy Ep is
recognized at every strain rate. Therefore, the total absorbed energy Et becomes almost same as Ei, the crack initiation
en-ergy, as given in Fig. 13(a). Ei starts dropping at ε˙i-4%Si =
0.11 × 10⁻², as indicated by the black arrow. Above this criti-cal strain rate ε˙i , Ei linearly decreases with the increase in ε˙ .
Figure 14 shows SEM images of fracture surface near the
[image:4.595.56.283.67.268.2]Fig. 9 Influence of the strain rate ˙ε on the absorbed energy (a) and ductile fracture surface ratio fD (b) at temperature T = 22 C for 4%Si iron.
Fig. 10 Influence of ˙ε on maximum nominal bending stress σb,max at T =
22 C for 4%Si iron.
Fig. 11 SEM images of the notch root area in Fig. 7(d). Fig. 8 SEM images of the black (ductile) area (a) and white (brittle) area
[image:4.595.310.543.72.229.2] [image:4.595.314.540.282.507.2] [image:4.595.53.284.300.646.2]notch root. A very small amount of dimple patterns are ob-served on the specimen broken at strain rate of 0.11 × 10⁻² s−1, while no dimple appears at 1.45 × 10⁻² s−1. The critical strain rate for null ductile fracture surface ratio ε˙f D is determined as ˙
εf D-4%Si = 1.45 × 10⁻² s−1 as shown in Fig. 13(b).
Figure 15 shows the relationship between the maximum nominal bending stress σb,max and ε˙ . The σb,max value keeps
900 MPa at lower ε˙ , almost the same value as σb,max obtained
at T = 22 C, then it starts decreasing at ε˙σ-4%Si = 1.45 × 10⁻² s−1. This critical ε˙
σ-4%Si coincides with ε˙f D-4%Si , indicat-ing that ε˙σ closely related to the presence of dimple pattern at
notch root.
3.3 Influence of silicon content on critical strain rate for absorbed energy and notch bending strength
[image:5.595.52.284.65.301.2]Figure 16 shows the influence of ε˙ on Et, Ei and σb,max at T = 22 C for 3.3 3.7%Si iron. In Fig. 16(a), Et-3.7%Si starts dropping at ε˙p-3.7%Si = 2.5 × 10⁻¹ s−1. This critical strain rate
[image:5.595.316.542.67.376.2]Fig. 12 Load-displacement curves tested under various ε˙ at T = −20 C for 4%Si iron.
[image:5.595.54.283.351.689.2]Fig. 13 Influence of ˙ε on Et, Ei (a) and fD (b) at T = −20 C for 4%Si iron.
Fig. 15 Influence of ˙ε on σb,max at T = −20 C for 4%Si iron.
[image:5.595.313.540.429.589.2]˙
εp of 3.7%Si iron is higher than that of 4%Si iron in Fig. 9. Et-3.3%Si, keeps increasing in the experiment strain range.
Fig-ure 17 shows the influence of ε˙ on Et, Ei and σb,max at T =
−20 C for 3.0 3.7%Si iron. Ei-3.7%Si and σb,max-3.7%Si start decreasing at ε˙i = 1.5 × 10⁻² s−1 and at ε˙σ-3.7%Si = 2.5 × 10⁻¹ s−1, respectively. These critical strain rates are also high-er than those of 4%Si iron in Figs. 13 and 15. These figures show every critical strain rate becomes higher with decreas-ing silicon content.
3.4 Application of strain rate-temperature parameter to the evaluation of strength and toughness
Based on Bennett and Sinclair s theory on the effects of ln ε˙ and 1/T on yield phenomena of steel and BCC metals24), the strain rate- temperature parameter R, given by eq. (3), has been introduced to explain the influence of ε˙ and T on the tensile strength as well as yield stress of steel25–27), where T = temperature, A = 108 s−124), ε˙ = strain rate.
[image:6.595.48.293.67.325.2]R=Tln(A/ε˙) (3)
Fig. 16 Influence of ˙ε on Et, Ei (a) and σb,max (b) at T = 22 C for 3.3 3.7%Si
[image:6.595.304.536.74.225.2]iron.
Fig. 17 Influence of ε˙ on Et, Ei (a) and σb,max (b) at T = −20 C for 3 3.7%Si
[image:6.595.295.547.123.630.2]iron.
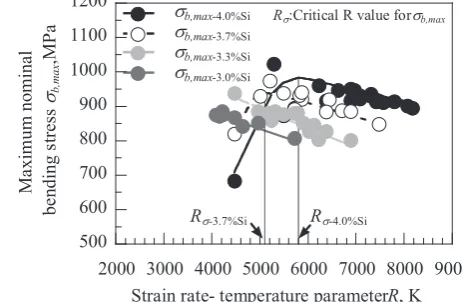
[image:6.595.48.289.374.635.2]Fig. 18 Relationships between R value and σb,max for 3 4%Si irons.
A good correlation between notch tensile strength and R val-ue was also reported on ductile cast iron28). Therefore, we tried to correlate our experimental data of σb,max to R value.
As shown in Fig. 18, there is a good correlation between
σb,max and R value for each Si irons. σb,max tends to increase
linearly with the decrease in R value. Here, decreasing R means increasing ε˙ or decreasing T, or both. This result is consistent with previous research reports on steels and ductile cast iron27,28). However, σ
b,max becomes smaller below the
critical value Rσ for 3.7 and 4%Si irons, because completely brittle fracture occurs below Rσ. Rσ becomes lower with de-creasing silicon content, as indicated in Fig. 18.
As the higher strain rate and the lower temperature give similar effects on the toughness of steel and ductile cast iron9,29), we tried to correlate our experimental data of ab-sorbed energy Et and Ei to R value. Figure 19 shows the
rela-tionship between absorbed energy and R for each Si irons. Although there are some scatters, good correlations are rec-ognized for each Si iron, and the critical R values, Rt and Ri,
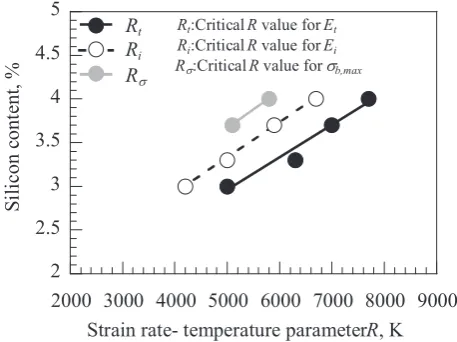
become lower with the decreasing of silicon content. Based on Figs. 18 and 19, Fig. 20 shows the relationships between each critical R value and silicon content. Rt, Ri and Rσ de-crease linearly with decreasing the silicon content. In addi-tion, the critical value is lower in the order of Rσ, Ri and Rt.
Based on this figure, we can estimate the appropriate silicon content of ductile cast iron components, considering the low-est service temperature and the highlow-est strain rate applied on the part.
4. Conclusions
Using Charpy V-notch specimens, dynamic three-point bending tests are conducted on 3 4%Si ferritic ductile cast iron at stroke speed of 10−3 102 mm/s, and at −20 22 C. The notch bending strength as well as the absorbed energy in fracture process is determined, and the results are discussed with the strain rate-temperature parameter R. The following conclusions are obtained.
(1) Based on load-displacement curves, the crack initiation energy Ei, the crack propagation energy Ep, the total absorbed
energy Et and the maximum nominal bending stress σb,max are
defined and displayed in relation to the strain rate ε˙ .
(2) Ep and Et of 3.7% and 4.0%Si iron start dropping at ε˙p =
2.5 × 10⁻¹ s−1 and 1.3 × 10⁻³ s−1, while the crack initiation energy Ei is almost unchanged even above these critical strain
rate ε˙p at 22 C.
(3) At −20 C, Ei and maximum nominal bending stress
σb,max start dropping at their specific critical strain rate. The
critical strain rate of Ei is lower than that of σb,max.
(4) σb,max keeps increasing with increasing ε˙ as far as the
dimple patterns appear at notch root.
(5) The higher strain rate and the lower temperature give similar effects on the strength and toughness of high silicon ductile cast iron. σb,max, Et and Ei of each Si iron is well
ex-pressed in relation to strain rate-temperature parameter R, T ln(A/ε˙ ).
(6) The critical R values for Et, Ei and σb,max (Rt, Ri and Rσ) decrease linearly with decreasing the silicon content of iron. The critical value is lower in the order of Rσ, Ri and Rt,
indi-cating Rσ gives a wider design tolerance.
REFERENCES
1) R. Larker: China Foundry 6 (2009) 343–351.
2) R. Larker: Proc. NEWCAST Forum, (Bundeseverband der Deutschen Gießerei Industrie, 2011), p.29.
3) H. Löblich: Proc. Deutscher Gießereitag 2013 und 5.NEWCAST
Fo-rum, (Verein Deutscher Giessereifachleute, 2013), pp.14–17. 4) EN 1563: Founding-Spheroidal graphite cast irons, 2011.
5) T. Umetani, T. Ikeda, N. Sura, K. Ashizuka, T. Nemoto, H. Takada and K. Ogi: J.JFS. 86 (2014) 36–42.
6) T. Okumoto and T. Aizawa: Imono 35 (1963) 670–677.
7) K. Nagai, K. Kishitake and T. Owadano: Imono 58 (1986) 350–355. 8) H. Nagayoshi, H. Yasuda and K. Imanishi: J.JFS. 68 (1996) 506–511. 9) H. Yamamoto, T. Kobayashi and H. Fujita: J.JFS. 72 (2000) 107–112. 10) K. Nagai, S. Izumi, K. Kishitake and T. Owadano: Imono 58 (1986)
653–658.
11) JIS-G5502: Spheroidal graphite iron castings, 2001.
12) JIS- G 0551: Steels-Micrographic determination of the apparent grain
size, 2005.
13) JIS-Z 2243 standard: Brinell hardness test-Test method, 2008. 14) JIS-Z2241: Metallic materials-Tensile testing-Method of test at room
temperature, 2011.
15) T. Shiota, T. Matuoka and S. Komatu: Imono 63 (1991) 601–606. 16) JIS-Z2242: Method for Charpy pendulum impact test of metallic
mate-rials, 2005.
17) R. Sandstrom and Y. Bergstrom: Met. Sci. 18 (1984) 177–186. 18) N. Sugiura, T. Kobayashi, I. Yamamoto, S. Nishido and K. Hayashi: J.
Jpn. Inst. Light Met. 45 (1995) 638–642.
19) K. Matsugi, G. Bando, G. Sasaki and O. Yanagisawa: J.JFS. 79 (2007) 229–234.
20) T. Kobayashi, H. Matsubara and Y. Ueda: Tetsu-to-Hagane 69 (1983) 1183–1188.
21) S. Nunomura and M. Nakashiro: Tetsu-to-Hagane 64 (1978) 860–869. 22) T. Nobuki, T. Shiota and M. Hatate: J.JFS. 75 (2003) 749–756. 23) T. Nobuki, T. Shiota and M. Hatate: J.JFS. 76 (2004) 555–561. 24) P.E. Bennett and G.M. Sinclair: Trans. ASME 65 (1966) 518–524. 25) E. Fuji, Y. Ohkuma, Y. Kawaguchi and M. Tsukamoto: The society of
naval architects of Japan 158 (1985) 619–629.
26) K. Goto, H. Hirosawa and M. Toyoshada: The society of naval archi-tects of Japan 176 (1994) 501–507.
27) F. Minami, T. Hashida, M. Toyoda, J. Morikawa, T. Ohmura, K. Arimo-chi and N. Konda: The society of naval architects of Japan 184 (1998) 453–463.
28) H. Yamamoto, T. Kobayashi and H. Fujita: Tetsu-to-Hagane 85 (1999) 765–770.
[image:7.595.53.282.70.241.2]29) M. Toyosada, E. Fujii, K. Nohara, Y. Kawaguchi, K. Arimochi and K. Isaka: The society of naval architects of Japan 161 (1997) 343–356. Fig. 20 Relationships between critical R value and Si content for 3 4%Si