Noncontact De
fl
ection Distribution Measurement for Large-Scale Structures
by Advanced Image Processing Technique
Shien Ri
1,+1, Tatsuro Numayama
1,+2, Masumi Saka
1, Kenichi Nanbara
2and Daisuke Kobayashi
2 1Department of Nanomechanics, Tohoku University, Sendai 980-8579, Japan2Chubu Electric Power Co., Inc., Nagoya 459-8522, Japan
Ambient unexpected vibration infield experiment for large-scale structures is an essential problem to perform highly accurate displacement measurement. In this paper, an advanced image processing (AIP) technique combining the sampling moiré method and digital image correlation (DIC) method is developed for noncontact measuring deflection distribution of large-scale structures. This technique has demonstrated promising results in both laboratory andfield experiments. Experimental results in laboratory show that the artificial vibration can be abated remarkably by DIC using a subset image of background without loading. Experimental results infield show that AIP technique can successfully measure the displacement distribution of a long crane with sub-millimeter deflection under natural vibration environment. The most attractive advantage of AIP technique is only each single image is required before and after deformation. This indicates the noncontact deflection distribution measurement is possible with high resolution and high accuracy by ease setup for the dynamic structural evaluation of infrastructures.
[doi:10.2320/matertrans.I-M2011852]
(Received November 13, 2009; Accepted October 29, 2011; Published January 12, 2012)
Keywords: structural health monitoring, noncontact deflection measurement, sampling moiré method, digital image correlation, ambient vibration
1. Introduction
Structural health monitoring (SHM) is a noticeable technology1,2) to reduce maintenance cost of civil structures such as long bridge and crane, etc. For the structural evaluation of civil structures, various tests are usually performed to know the structural properties such as natural frequencies, dynamic responses, deflection, strain and stress distributions. In addition, it is important to monitor the variation of these properties in time history of short-term or long-term as well as damages to evaluate the structural integrity. One of these properties is vertical deflection of long structures in the area of civil engineering. For instance, a long-term measurement allows continuous monitoring of the structures and permit constant safety oversight so that an immediate warning is issued when extreme deflections are detected.
Generally, electrical resistance strain gauges and displace-ment transducers are widely used to monitor health of structures. Recently, laser Doppler vibrometer (LDV)3,4)and
fiber Bragg grating sensors5,6)have successfully been applied for long-term structural health monitoring for large-scale structures. However, these sensors are basically point measurement. Hence, they are much expensive and time-consuming for distribution analysis. Other conventional monitoring instruments such as global positioning system (GPS)7,8) have also various practical limitations in obtaining accurate displacement data. Most of the current GPS have shown that it has an accuracy of about «1 cm in the horizontal direction and«2 cm in the vertical direction.
Nowadays, the average age of many civil infrastructures such as highway bridges in Japan will soon become 40 or
even 50 years soon, so the necessity of frequent and detailed inspection and maintenance/repair is expected to increase significantly in the near future. The characteristic features in monitoring and inspection of large-scale structures are:
(1) The areas to be inspected or monitored are quite huge; Both high spatial resolution and high accurate displace-ment measuredisplace-ment technique is needed.
(2) Some of the components to be inspected are difficult and dangerous to access; Noncontact and remote sensing technique is desirable.
There is, therefore, a real need for developing a technique enable automatic and noncontact measurement of displace-ment distribution for various large-scales structures with high accuracy and good spatial resolution.
Optical methods such as fringe projection,9) electronic speckle pattern interferometry (ESPI)10,11)and phase-shifting digital holography (PSDH)1214) are useful to measurement shape, displacement and strain distribution in full-field of structures. However, the measurement area of these inter-ferometric methods is still small. In addition, Interinter-ferometric methods are difficult to use in out of laboratory since it is very sensitive to vibration. Therefore, field experiment is difficult to perform accurate displacement measurement for large-scale structures under natural vibration environment.
Another approach for large-scale structures monitoring is use of image processing or image analysis method. Wahbeh et al.15) present a vision-base approach for measuring displacements of vibrating systems. In this method, a resolution digital camera is used to record two high-resolution red lights (LED) were mounted on the measured targets and a nonlinear Gaussian regression curve fit is utilized to determine the center of the red spot of the LEDs. Lee and Shinozuka16)also present a vision-based system for remote sensing of bridge displacement by image processing. A target has four white spots with known geometry and black background is used and the centers of four white spots are determined from the black and white image. In these image
+1Corresponding author, E-mail: ri-shien@aist.go.jp. Present Address:
National Institute of Advanced Industrial Science and Technology (AIST), Tsukuba 305-8568, Japan
+2Graduate Student, Tohoku University
Special Issue on APCNDT 2009
analysis methods, however, the accuracy of detection of the center positions of spots is limited.
Digital image correlation (DIC)17,18) is another kind of image processing technique for measuring displacement distribution. DIC technique using random patterns (natural patterns) can obtain the deformation of surface from small scale to large scale by comparison of the digital images before and after deformation. Recently, DIC is also applied to measure the displacement of real bridge.19)This method does not need a complicated optical setup. However, it required much long calculating time to obtain high resolution results. As mentioned above, it is a big challenge to achieve a sub-millimeter accuracy displacement measurement with a large measurement area in meter scale for structural health monitoring. In this study, we propose an advanced image processing (AIP) technique, combining sampling moiré method and DIC method, for noncontact measurement of deflection distribution of large-scale structures. Sampling moiré method is applied to rapidly measure the displacement distribution of large-scale structures. DIC method is used to compensate the unexpected vibration in field experiment. Deflection measurement of objects under ambient vibration environment by our AIP technique indicates the powerfulness for measuring displacement distribution of structures with high accuracy and high resolution by ease setup. The basic principle and results in laboratory and filed experiment are presented.
2. Principle of Advanced Image Processing Technique
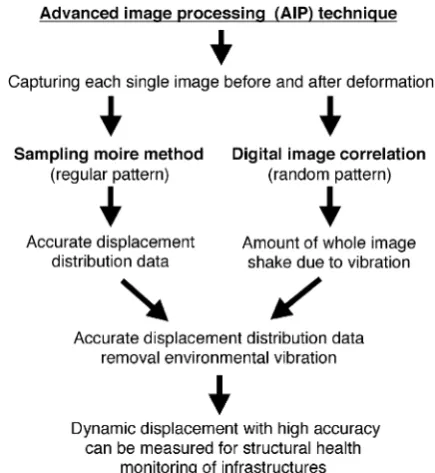
Ambient unexpected vibration infield experiment of large-scale structures measurement is an essential problem in order to perform high accurate displacement measurement. However, few study reports this issue to removal vibration in image analysis method. In this study, we propose an advanced image processing (AIP) technique combining the sampling moiré method and digital image correlation method for noncontact measuring displacement of large-scale struc-tures under environment of natural vibration. The concept and procedure of the AIP technique is shown in Fig. 1. In AIP technique, sampling moiré method is applied to measure the accurate displacement distribution of large-scale structures by using a regular grating of interested area. To overcome the practical problem, i.e., ambient vibration, in
field experiment for measuring large-scale structures, DIC method is used to compensate the imperceptible image shake due to the unexpected vibration by using a random (natural) pattern of background. Our goal is to develop a technique, in which only each single digital image is required before and after deformation, for accurate displacement distribution measurement.
2.1 Displacement measurement by sampling moiré method
Sampling moiré method,20,21)which developed recently by one of the authors, is a novel image analysis technique. If a regular grating pattern is sampled at an interval that is nearly equal to the pitch of the grating, a moiré fringe pattern is obtained. If the sampling phase is shifted, the phase of the moiré fringe is also shifted. The phase of the moiré fringe is
analyzed from the phase-shifted moiré patterns by using a phase-shifting method. The displacement distribution meas-urement is performed by analyzing the phase information of moiré fringes from two grating images before and after deformation.
The detailed principle of the sampling moiré method for small deformation measurement is explained in Fig. 2. First, Fig. 2(a) shows the intensity image of the grating captured by a CCD camera, prior to deformation (¤=0). When every N-pixel (in this case, N=4) from the first sampling point is picked up from Fig. 1(a) horizontally and after image interpolated from the neighboring sampled intensities, a moiré fringe pattern is obtained. If instead of the second,
Fig. 1 Concept and procedure of advanced image processing (AIP) technique.
[image:2.595.316.534.68.305.2] [image:2.595.318.534.357.598.2]third, and fourth sampling points are selected, multiple phase-shifted moiré fringe patterns are obtained from a single image, as shown in Fig. 2(b). In the sampling moiré method, N is defined as the “thinning-out index” and it is approximately equal to the pitch p of the grating. In Fig. 2(b), the k-th phase-shifted moiré fringe image can be expressed approximately as follows:
Imði; j;kÞ ¼Iaði; jÞcos ¤mði; jÞ þ2³ k N
þIbði; jÞ;
ðk¼0;1; ; N1Þ ð1Þ
whereIaði; jÞrepresents the amplitude of the grating intensity in thei,jcoordinates of the CCD plane, and is sensitive to the phase change of the grating; Ibði; jÞ represents the back-ground intensity, which is insensitive to the change in phase; and¤mði; jÞis the initial phase value of the moiré fringe. The wrapped phase value of the moiré fringe, shown in Fig. 2(c), can be obtained by phase-shifting methods using Fourier transform (PSM/FT)22) or discrete Fourier transform (DFT) algorithms described in eq. (2):
¤mði; jÞ ¼ arctan
X
N1
k¼0
Imði; j;kÞsinð2³k=NÞ
X
N1
k¼0
Imði; j;kÞcosð2³k=NÞ
: ð2Þ
Figure 2(a0) shows the intensity image of the Ronchi grating captured by a CCD camera after a slight deformation (¤¼p) from the initial position in Fig. 2(a). Figures 2(b0) and 2(c0) show the phase-shifted moiré fringe patterns and wrapped phase distribution after deformation, respectively. The phase change (phase difference) of Figs. 2(c) and 2(c0),
¤mði; jÞ ¼¤0mði; jÞ ¤mði; jÞ, is shown in Fig. 2(d). Our previous study20) reported that the deformation ¤ can be represented follows:
¤ði; jÞ ¼ p¤mði; jÞ
2³ : ð3Þ
From eq. (3), it is clear that the displacement ¤ is directly proportional to the phase difference ¤m before and after deformation. If a dimensional grating is used, two-dimensional distribution of deformation¤x and¤y inxandy directions can be measured.
2.2 Vibration compensation by digital image correlation technique
Digital image correlation23,24) is an image analysis technique based on the comparison of two digital images recorded at different states, one before deformation and the other one after deformation. In digital image correlation (DIC) technique, random speckle-like black-and-white dot patterns on an object surface are observed and stored in a computer. Theses two image patterns are referred as reference and deformed images are compared to match subsets from one image to another. Figure 3 shows the subsets before and after deformation in DIC. The interested point in the reference image is characterized by a rectangular subset, an (m©n) pixel area. The corresponding subset, also an (m©n) pixel area, in the deformed image is estimated at a certain location with a specified range. Once the location of
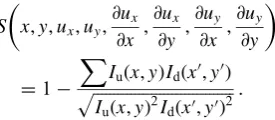
this subset in the deformed image is found, the displacements of this subset can be determined. Generally, a normalized cross-correlation coefficient,S, defined below, is used for the best estimate of the displacements.
S x; y; ux; uy;@ux@x ;@ux@y ;@uy@x ;@uy@y
¼1
X
Iuðx; yÞIdðx0; y0Þ ffiffiffiffiffiffiffiffiffiffiffiffiffiffiffiffiffiffiffiffiffiffiffiffiffiffiffiffiffiffiffiffiffiffi
Iuðx; yÞ2Idðx0; y0Þ2
p : ð4Þ
Here, x and y are the coordinates of a point on the subset before deformation andx0andy0are those after deformation. ux and uy are the displacement components at the center of the subset in the horizontal and vertical directions. Iuðx; yÞ represent the gray level at the location of ðx; yÞ in the reference image (undeformed subset) U, and Idðx0; y0Þ represent the gray levels at the location of ðx0; y0Þ in the deformed subset image D, respectively. The coordinates x0 and y0 after deformation are related to the coordinatesxand ybefore deformation by
x0¼xþuxþ@ux @x xþ
@ux @y y; y0¼yþuyþ@uy
@x xþ @uy
@y y; ð5Þ
wherexandyare thex- andy-directional components of the distance from the center of the subset to the considered point (x,y), respectively.
The correlation coefficient S is a function of two displacement components ux anduy, and four displacement gradients@ux=@x,@ux=@y,@uy=@xand@uy=@y. Therefore, the displacements are determined by searching for the best set of displacements and displacement gradients, that minimize the correlation coefficientS. A coarse search, pixel by pixel, is performed within the specified range in the deformed image to find the best-matched pattern. In this process, the approximate displacements are first estimated within the accuracy of one pixel with zero gradients. After the
first estimation, the process varies to search for both the displacements and the displacement gradients by the NewtonRaphson (NR) method. In this step, to increase the resolution of the correlation method, a bilinear interpolation method is used to reconstruct a continuous intensity instead of a discrete intensity pattern.
[image:3.595.318.531.73.227.2] [image:3.595.347.485.314.374.2]In this study, DIC method is used to overcome the practical problem of small vibration infield experiment. A subset from the background area without deformation is chosen. Then the average of displacements ux, uy, in a small area (generally 20©20 pixels), is used to calculate the whole image shake. Therefore, the calculating procedure does not need much time. The true displacements ¤x and ¤y can obtain by compensate the vibration component using DIC as indicated in eq. (6). As the result, an accurate displacement distribution measurement can be performed under environment of natural vibration.
¤
xði; jÞ ¼¤xði; jÞ ux
¤
yði; jÞ ¼¤yði; jÞ uy: ð6Þ
3. Three-Point Bending Experiment in Laboratory
To verify the effectiveness of the AIP technique, a symmetric three-point bending test under vibration environ-ment is performed to measure the deflection of an aluminum specimen.
3.1 Experimental setup
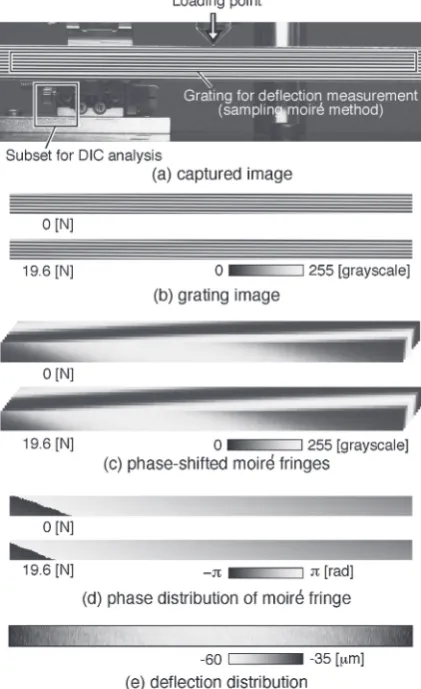
Figure 4 shows the laboratory experimental setup. The specimen is an aluminum (A6063) with 360 mm in length, 12 mm in depth, and 12 mm in thickness. An adhesive tape of a Ronchi grating with 1.13 mm pitch is pasted on the surface of the specimen. A static loading is applied to the center position of two supporting points and the span of the two supporting points is 250 mm. A digital interface CCD camera (SONY, XCD-SX90) with a PENTAX CCTV lens C1614-M with f=16 mm and F/1.4 is used. The camera resolution is 1280©960 pixels and 10-bit digital image is recorded. The distance between the CCD camera and the specimen is 500 mm. In this setup, one pixel size of the recorded image corresponds to 121.4 µm.
Firstly, we captured a single digital image before loading. Secondly, 19.6Nloading is applied at the center position of the specimen. Then, a series of 41 images is recorded under ambient artificial vibration condition. The shutter speed of the CCD camera is set as 1/15 s and the interval time of image capturing is 2/15 s. In sampling moiré method, thinned-out is performed by 10 pixels along the horizontal direction for obtaining the deflection distribution. A subset with 121©121 pixels on the background area without loading, as shown in Fig. 5(a), is used to investigation the shake of the 41 images. The average of 20©20 pixels displacement amount analyzed by DIC is used to compensate the whole image shake due to vibration.
3.2 Experimental results
Figure 5 shows the results of deflection measurement by sampling moiré method. Figure 5(a) shows the recorded image and the analyzed area. Figure 5(b) shows the grating image (1200©60 pixels) in analyzed area before and after loading at 0.93 s. Figure 5(c) shows the 10 phase-shifted images of the moiré fringe obtained by sampling moiré method. The wrapped phase distribution of the moiré fringe and deflection distribution are shown in Figs. 5(d) and 5(e), respectively.
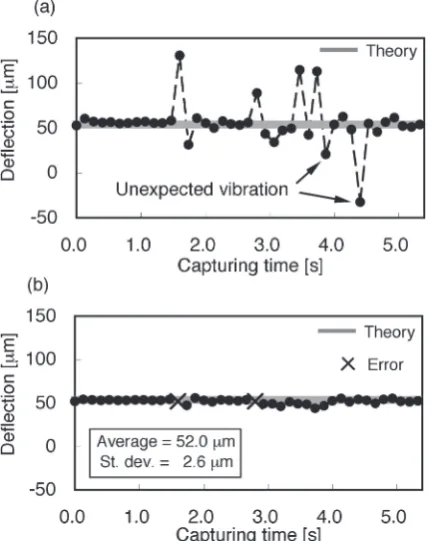
Figure 6 shows the experimental results of measured deflection without and with vibration compensation. It clearly shows that the artificial vibration can be abated remarkably by using our method. The theoretical deflection at center position is 53.6 µm. Therefore, the average error and the standard deviation are 1.6 and 2.6 µm even under vibration environment except two measurement error. This means that the measurement accuracy can reach to 1/700 of the grating pitch 1.13 mm. The two unexpected measurement error at 1.6 and 2.8 s are caused image blurring at quick vibration period and the calculating procedure of correlation coefficient in DIC does not working well. In this case, the shutter of the CCD should choose higher speed.
Fig. 4 Experimental setup in laboratory.
[image:4.595.315.542.71.186.2] [image:4.595.321.532.223.568.2]In summary, laboratory experimental results indicate that AIP technique has great potential for capturing accurate small deflection distribution under both natural vibration and ambient artificial vibration environment.
4. Deflection Measurement of a Long Crane in Field Experiment
In many crane, the vertical displacements are the most relevant parameters to be monitored in both the short and long term. Here, as one application of displacement distribution measurement of large-scale structures, the deflection of a long crane (about 10 meter) as shown in Fig. 7(a) is measured by handling a heavy block (nominal
Fig. 6 Experimental results of measured deflection with and without vibration compensation.
(a)
(b) (c) (d)
(b') (c') (d')
Fig. 7 Photograph of the measured crane (a); recorded digital images (8-bit grayscales) before and after hanging heavy block at left position (b) and (b¤), center position (c) and (c0), and left position (d) and (d0), respectively.
[image:5.595.62.278.71.342.2] [image:5.595.332.517.267.345.2] [image:5.595.109.487.401.760.2]weight: 2 ton). Thirty magnetic sheets (300 mm©100 mm) with drawn reference grating of 38.5 mm pitch, as shown in Fig. 8, are attached on the surface of the measurement area of the crane. An ordinary CCD camera (SONY, XCD-SX90; 1280©960 pixels) is installed on a fixed point away from the crane to record the images and change three different positions (left, center, and right sides) to analyze the deflection of whole crane. Theses recorded digital images (8-bit grayscales) before and after hanging heavy block at left, center, left positions are shown in Figs. 7(b)7(d) and Figs. 7(b0)7(d0), respectively. In sampling moiré method, thinned-out is performed by 9 pixels along the horizontal direction for obtaining the deflection distribution. A subset with 121©121 pixels on the periphery of the crane without loading, as shown in Figs. 7(b)7(d¤), is used to investigation the CCD camera shake. In this experiment, pixel size of the CCD corresponds to 3.85 mm and 0.11 pixels displacement in left position, 0.17 pixels in center position, and¹0.1 pixels in right position were detected.
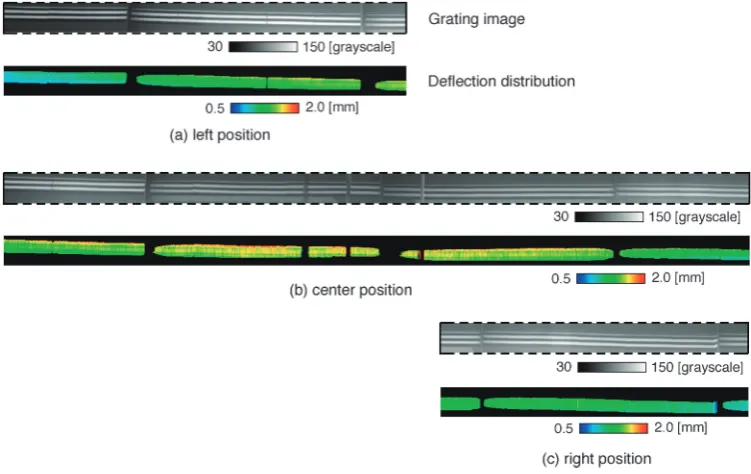
Figures 9(a)9(c) show the grating images and the deflection distributions after vibration removal at left, center, and right positions, respectively. Figure 10 shows the measured deflection of the crane after loading. The average value of 10©10 pixels at each analyzed location is used. The unshaded marks represents the deflection of the analyzed location without vibration removal, and the shaded marks represents the deflection after vibration removal. After compensate the measurement error due to the imperceptible vibration, 1.56 mm deflection can be detected successfully at center position of the crane. It is shown that the proposed method has the potential of leading to an economical and robust, accurate measurement system for obtaining the displacement distribution of large-scale structures. In addition, our deflection measurement method based on image vision is a promising technique since the resolution and image quality of the CCD and CMOS camera are dramatically increased in recent years.
5. Conclusions
With the aim of monitoring or inspection of infrastructures, we developed an advanced image processing (AIP) technique combining the sampling moiré method and DIC method for measuring the deflection distribution of large-scale structures. The most attractive advantage of our method is that this technique requires only two digital images before and after deformation. Therefore, this technique can easily be applied to dynamic phenomenon measurement by using a high-speed camera. This method has demonstrated promising results in both laboratory and field experiments. Experimental results in laboratory show that ambient unexpected vibration, which is an essential problem in the case of field experiment, can
Fig. 9 Grating image and the deflection distribution at (a) left position, (b) center position, and (c) right position.
[image:6.595.323.529.343.543.2]be abated remarkably by DIC using a subset image of still background. In addition, experimental results in field show that our method can be successfully used to measure deflection in a long crane with the accuracy of sub-millimeter in displacement under the environment of natural vibration. This indicates the noncontact deflection distribution measure-ment is possible with high resolution and high accuracy by ease setup for the structural evaluation of infrastructures.
REFERENCES
1) C. Boller:Intl. J. Systems Sci.31(2000) 13331349.
2) J. M. Ko and Y. Q. Ni:Eng. Struct.27(2005) 17151725.
3) H. H. Nassif, M. Gindy and J. Davis:NDT&E Int.38(2005) 213218.
4) Y. Fujino and M. Abe: Proc. 1st Int. Conf. on Structural Health Monitoring and Intelligent Infrastructure, (2003) pp. 3950. 5) S. T. Vohra, M. D. Todd, G. A. Johnson, C. C. Chang and B. A.
Danver: Proc. SPIE 3746, (1999) pp. 3237.
6) P. Moyo, J. M. W. Brownjohn, R. Suresh and S. C. Tjin:Eng. Struct.27
(2005) 18281834.
7) S. Nakamura:J. Struct. Eng.126(2000) 14131419.
8) L. Xu, J. J. Guo and J. J. Jiang:J. Sound Vib.254(2002) 105116.
9) M. Lehmann, P. Jacquot and M. Facchini:Exp. Tech.23(1999) 3135.
10) C. Joenathan, B. Franze, P. Haible and H. J. Tiziani: Appl. Opt.37
(1998) 26082614.
11) A. Martinez, J. A. Rayas, R. Rodriguez-Vera and H. J. Puga:Appl. Opt.
43(2004) 46524658.
12) I. Yamaguchi, J. Kato and H. Matsuzaki:Opt. Eng.42(2003) 1267 1271.
13) Y. Morimoto, T. Matui, M. Fujigaki and N. Kawagishi:Opt. Eng.46
(2007) 025603, 8 pages.
14) Y. Morimoto, T. Matui, M. Fujigaki and A. Matsui:Strain44(2008) 4956.
15) A. M. Wahbeh, J. P. Caffrey and S. F. Masri:Smart Mater. Struct.12
(2003) 785794.
16) J. J. Lee and M. Shinozuka:NDT&E Int.39(2006) 425432.
17) M. A. Sutton, M. Cheng, W. H. Peters, Y. J. Chao and S. R. McNeil:
Image Vis. Comput.4(1986) 143150.
18) M. A. Sutton, J. J. Orteu and H. W. Schreier:Image Correlation for Shape, Motion and Deformation Measurements, (Springer, New York, 2009) pp. 81117.
19) S. Yoneyama, A. Kitagawa, S. Iwata, K. Tani and H. Kikuta: Exp. Tech.31(2007) 3440.
20) S. Ri, M. Fujigaki and Y. Morimoto:Exp. Mech.50(2010) 501508.
21) S. Ri, Y. Morimoto and M. Fujigaki: Inspection Engineering14(2009) 16 (in Japanese).
22) Y. Morimoto and M. Fujisawa:Opt. Eng.33(1994) 37093714.
23) M. A. Sutton, S. R. McNeill, J. D. Helm and Y.-J. Chao: Photo-mechanics, ed. by P. K. Rastogi, (Springer-Verlag, 2000) pp. 323372. 24) S. Yoneyama and Y. Morimoto:JSME Int. J. Series A46(2003) 178