Strain-Controlled Fatigue Behavior in Thin Pure Copper Sheet
for Smart Stress-Memory Patch
Takayuki Shiraiwa
+and Manabu Enoki
Department of Materials Engineering, School of Engineering, The University of Tokyo, Tokyo 113-8656, Japan
A new sensing method called“smart stress-memory patch”has been proposed for fatigue damage evaluation of structures. This patch estimates the number of cycles and stress amplitude using its crack length. In this study, fatigue crack growth behavior in thin pure copper sheet was investigated under strain-controlled testing to evaluate the sensor characteristics when the patch is attached to structure. Electrodeposited (ED) copper of 99.96%purity with an average grain size of 2 µm provided a stable crack propagation and easy observation of crack length. The relationship between stress intensity factor range and crack growth rate wasfitted on one curve regardless of strain amplitude. The scattering in fatigue crack growth was evaluated by a stochastic model, and it demonstrated that the error of fatigue cycles estimated by the patch is small enough. Furthermore, stress transfer between the patch and structure was calculated on the simple assumption that the patch is perfectly bonded on the structure, and it was shown that the patch attached to structure can estimate the number of cycles and stress amplitude on the structures.
[doi:10.2320/matertrans.MBW201117]
(Received November 28, 2011; Accepted December 19, 2011; Published February 8, 2012)
Keywords: fatigue crack growth, strain-controlled testing, electrodeposited copper, fatigue sensor, structural health monitoring
1. Introduction
Structural health monitoring (SHM) is highly required to ensure the reliability of bridges, ships, trains, aircraft, power plants and industrial machines. Especially, a long-term sensing method of fatigue damage is very important to avoid the fracture caused by cyclic loading. Strain gauge, FBG (Fiber Bragg Grating) sensor13)and wireless strain sensing
systems46) are utilized to monitor strain and to evaluate
fatigue damage. However, there are several problems on the practical use such as necessity of wiring, electrical power supply and complicated measuring devices. Concept of smart stress-memory patch (hereinafter called “smart patch”) was proposed to overcome above problems in the previous papers.712) Sensor in smart patch consists of a thin metal sheet with a pre-crack, and the number of fatigue cycles and stress amplitude on structure can be estimated from fatigue crack growth in the sensor. Smart patch is a promising technique for long-term SHM because it needs neither power supply nor wiring. Furthermore, the patch is successfully applied to batteryless wireless system to measure the crack length in the sensor using RFID (Radio Frequency Identification).12)
The fatigue crack growth behavior in the sensor under stress-controlled fatigue test has been investigated to estimate stress amplitude and fatigue cycles.7,8) However, when the
patch is attached to structure, the sensor is subjected to strain-controlled loading under the change in strain of the structure. Therefore, it is necessary to evaluate fatigue behavior in the sensor under strain-controlled conditions for application of smart patch to structure. While most studies about fatigue in thin metal sheet have focused on stress-life (S-N) and strain-life (¾-N) curves for reliability of microelectronic products,1316)the fatigue crack growth behavior under strain-controlled testing has not been enough explored in detail.
In this article, fatigue crack growth behavior of the sensor (thin pure copper sheet) was evaluated under uniaxial
strain-controlled fatigue testing in order to obtain the characteristics of the attached sensor to structure. The scattering in crack growth was also examined by a stochastic model to assess the error in estimation of fatigue cycles and stress amplitude. From these observations, a method to evaluate fatigue cycles and residual fatigue life of structure using smart patch was proposed.
2. Principle of Smart Stress-Memory Patch
The details of the principle were described in the previous paper.7)A schematic image is shown in Fig. 1(a). Sensor in
the patch consists of a thin metal sheet with a pre-crack. Since fatigue damage in structure tends to occur in structural component, more than one sensor is attached, for example, close to the welded part. When the structure is subjected to cyclic loading, the sensor is also cyclically loaded in response to the change of strain in the structure. Then, fatigue crack growth from pre-crack in the sensor will occur according to the cyclic loading. After a certain period, the crack length in each sensor will be measured by optical microscope or wireless measurement of electrical resistance change. The number of fatigue cycles (N) and stress amplitude (¦·) on the structure can be estimated from the crack length detected from two sensors with different characteristics as shown in Fig. 1(b).
3. Experimental Procedure
3.1 Materials
The sensor was made of electrodeposited (ED) copper of 99.96%purity with an average grain size of 2 µm because of its good corrosion resistance and easily observation of the crack length. This small grain size provides stable crack propagation. The ED copper sheet with a thickness of 0.1 mm was cut to rectangular coupons with a dimension of 40 mm©5 mm. A single notch with a length of 2.5 mm and a width of 0.3 mm was induced at the center from one side of the coupon. The notch tip was a roundshaped with a
+Graduate Student, The University of Tokyo
radius of approximately 150 µm. Additionally, the notch tip was sharpened to curvature radius of about 30 µm by the blade (High-stainless 100 µm, Feather Safety Razor Co., Ltd.). One side of the coupon was polished to a mirrorfinish using 3 and 1 µm alumina slurry to observe crack length clearly. Afterward, fatigue pre-crack was introduced until total crack length reached to about 2.7 mm.
3.2 Fatigue test
Both ends of the sensor were clamped in jigs mounted in a fatigue testing machine (MMT-100N, Shimadzu), and the gauge length between the upper and lower jigs is adjusted to 20 mm. Fatigue tests were performed under maximum crosshead displacement (umax) of 20, 25 and 30 µm,
displace-ment ratio of R=0.1 and frequency of 19 Hz. Given that strain is defined as a crosshead displacement divided by gauge length of specimen, strain ratio is R=0.1 and maximum strain (¾max) is 0.10, 0.125 and 0.15%,
respec-tively. Change in crack length as a function of the number of fatigue cycles was monitored optically with digital micro-scope (VHX-600, Keyence). The tests were conducted two times under each condition to evaluate the reproducibility and the scattering in fatigue crack growth.
4. Analytical Procedure
4.1 Finite element analysis of stress intensity factor
A proper shape factor (f(¡)) for the present sensor geometry is necessary to characterize the fatigue crack growth behavior as a function of stress intensity factor range (¦K). It is commonly known that the stress intensity factor (K) of single edge-cracked tension specimen with prescribed end displacements can be expressed by
K¼·pffiffiffiffiffiffi³afð¡;¢Þ; ·¼ E
1¯2
u L
¡¼ a
W; ¢¼ L
W ð1Þ
where W is width of the specimen, L is gauge length of the specimen, ais crack length, Eis Young’s modulus,¯is Poisson ratio, u is displacement on the specimen, ¡ is normalized crack length and¢is ratio of the gauge length to the width.17)Although the shape factor has been investigated
in the range of ¢=0.5 to 3,18) the present sensor has the
higher value of ¢=4.0 (L=20 mm,W=5 mm).
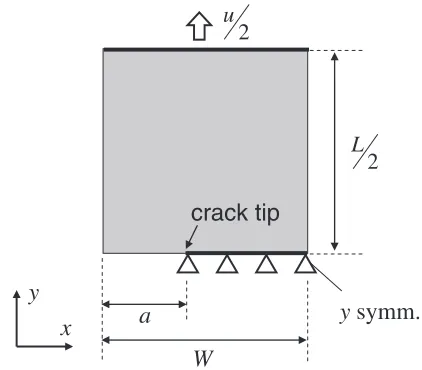
In order to evaluate shape factor of the sensor (¢=4.0), linear elastic stress analysis was performed byfinite element method (FEM). Geometry and boundary conditions for the simulation are shown in Fig. 2, whereLwas 20 mm,Wwas 5 mm, Young’s modulus was 120 GPa, Poisson ratio was 0.34 and u was changed from 2 to 30 µm in the same as experimental conditions. The model was sectioned into quadrilateral plane stress elements with size of 0.05 mm© 0.05 mm. In the analysis, ten integration paths were defined from the crack tip to the outside, and the J-integral was calculated for normalized crack length (¡=a/W) ranging from 0.1 to 0.9. Since theJ-integral reached a constant value from thefifth path in each condition, the constant value was used for calculation of stress intensity factor. Under plane stress conditions, the stress intensity factor can be described by
J¼K2=E ð2Þ
and the shape factor was systematically solved using eqs. (1) and (2) for the above range of crack length.
4.2 Stochastic analysis of fatigue crack growth
It is significant to evaluate the scattering in fatigue crack growth in the sensor because the error in estimation of fatigue cycles and stress amplitude from crack length becomes larger with the scattering. Scattering of this copper
(a) (b)
pre-crack
a2
screw cover
a1
structure adhesive
sensor foundation
Crack length in sensor
,
a
N Δσ= const.
Fatigue cycles, N
Sensor 1
Sensor 2
Fig. 1 (a) Schematic image of smart stress-memory patch and (b) principle to estimate cyclic number from crack length.
2
u
y
symm.
y
x
W
2
L
a
crack tip
[image:2.595.112.481.68.200.2] [image:2.595.319.530.251.436.2]sensor under stress-controlled fatigue test has been inves-tigated using a stochastic model.8)In this model, a random
variable (Z) is introduced to Paris law as the following equations:
da
dN ¼ZCðKÞ
m ð3Þ
where da/dNis crack growth rate andCandmare materials constants. If logZ follows a normal distribution with zero mean, the probability density function is written by
gðlogZÞ ¼ ffiffiffiffiffiffi1
2³
p ·SD
exp ðlogZÞ2
2V
ð4Þ
where ·SD is standard deviation and Vis variance of logZ.
Integrating both sides of eq. (3) from initial normalized crack length (¡0) to certain crack length (¡), relationship between
fatigue cycles and crack length including the scattering was obtained by
NZ¼Z1 WC Z¡
¡0
Kmd¡ ð5Þ
where NZ is fatigue cycles including scattering. The experimental data obtained in present work were applied to the above stochastic model, and statistical properties of logZ
were evaluated to predict the crack growth process including the scattering.
5. Results and Discussion
5.1 Fatigue crack growth
Fatigue crack path of the sensor exhibited the significantly straight line as shown in Fig. 3. It allows us to measure the crack length easily. Figure 4 shows relationships between the number of fatigue cycles and crack growth rate calculated by the incremental polynomial technique under each test condition. Tests performed two times under the same condition showed good repeatability. The crack growth rate was almost constant with fatigue cycles in the range of
a=2.7 mm to 4 mm under low strain amplitude, and it slightly decreased with fatigue cycles especially at maximum strain of 0.15%. This tendency is quite different from that of the stress-controlled fatigue behavior.7)
5.2 Stress intensity factor
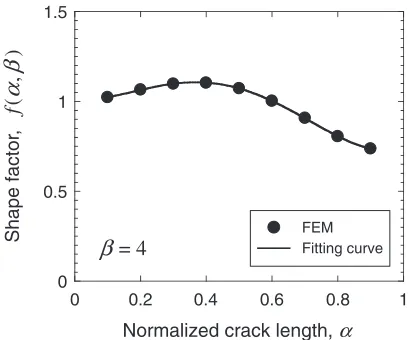
Shape factor for the present sensor geometry was calculated by FEM to examine the fatigue crack growth characteristics as a function of stress intensity factor range, as shown in Fig. 5. Shape factor of function of¡can befitted as follows:
fð¡Þ ¼1:010:11¡þ3:39¡28:12¡3þ4:57¡4: ð6Þ
Relationship between stress intensity factor range calculated by the above equation and fatigue crack growth rate under each experimental condition are shown in Fig. 6. It can be
fitted on Paris equation as:
da
dN ¼CðKÞ
m; K¼ ð1RÞK
max ð7Þ
wherem=3.91 andC=5.85©10¹13andK
maxis the value
of stress intensity factor at u=umax. The correlation
coefficient was 0.980. Therefore, it was shown that the relationship between stress intensity factor range and crack growth rate can be expressed by one curve regardless of strain amplitude under strain ratio ofR=0.1.
Notch
500
μ
m
Fig. 3 Fatigue crack path of the copper thin sheet.
10-9 10-8 10-7
Fatigue cycles, N / 104
Crack growth rate,
da/dN
/ m/cycle
εmax= 0.10 %
εmax= 0.125 %
εmax= 0.15 %
5 10 15 20
0
Fig. 4 Relationships between fatigue cycles and crack growth rate.
Normalized crack length, α
Shape factor
,
f
(
0 0.5 1 1.5
0 0.2 0.4 0.6 0.8 1
= 4
β
)
β
α
,
FEM Fitting curve
[image:3.595.313.540.71.239.2] [image:3.595.314.539.285.471.2] [image:3.595.325.530.520.690.2]5.3 Scattering in fatigue crack growth
In order to evaluate the scattering in fatigue crack growth, LogZwas calculated from eq. (3) for each experimental data as shown in Fig. 7. In thesefigures, mean value (®) is almost zero and standard deviation (·SD) is smaller than rolled Cu
(·SD=0.130.178)). It demonstrates that the scattering of ED
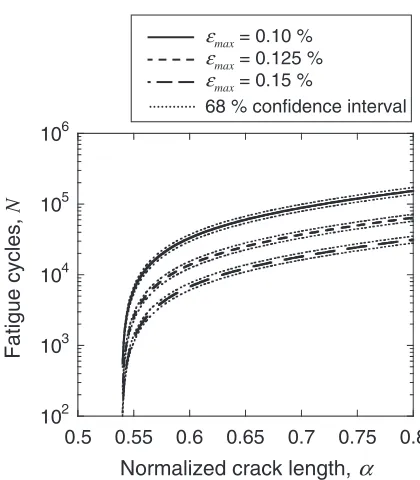
Cu is small compared with rolled Cu. LogZ of all data are also plotted on a normal distribution sheet as shown in Fig. 8. They are wellfitted by straight line, therefore, it is confirmed that logZ follows to a normal distribution with zero mean. Then, relationship between fatigue cycles and crack length including two-sided confidence interval was obtained from eq. (5) with logZ=«·SDas shown in Fig. 9. The confidence
interval is sufficiently narrow and it is expected that the difference in maximum strain can be estimated with the error less than 0.025%.
5.4 Evaluation of fatigue damage
Based on fatigue testing results, a method to evaluate fatigue damage of structure using smart patch will be discussed.
5.4.1 Attachment to structure
When the patch is attached to structure, the sensor is subjected to strain-controlled loading under the change in
10-9
10-8
10-7
10 12 14 16 18 20
Stress intensity factor range, ΔK / MPa · m1/2
Crack growth rate,
da/dN
/ m/cycle
εmax= 0.10 %
εmax= 0.125 %
εmax= 0.15 %
Fitting curve
Fig. 6 Relationship between stress intensity factor range calculated from FEM and experimental crack growth rate.
-1 -0.5 0 0.5 1
0.55 0.6 0.65 0.7 0.75 0.8 -1 -0.5 0 0.5 1
0.55 0.6 0.65 0.7 0.75 0.8 -1 -0.5 0 0.5 1
0.55 0.6 0.65 0.7 0.75 0.8
ε
max= 0.10 %
ε
max= 0.125 %
ε
max= 0.15 %
(a) (b) (c)
Random variable,
log
Z
μ= 0.0101
σSD= 0.0579
μ= -0.0377
σSD= 0.0508
μ= -0.0237
σSD= 0.0389
Normalized crack length,
α
Normalized crack length,
α
Normalized crack length,
α
Fig. 7 LogZcalculated from eq. (3) for each experimental data with maximum strain of (a) 0.10%, (b) 0.125%and (c) 0.15%.®is mean value and·SDis standard deviation, respectively.
Random variable, log Z
Probability (%)
-0.4 -0.2 0 0.2 0.4
1 5 10 20 30 50 70 80 90 95 99 99.9
0.1
Fig. 8 Normal distribution plot of logZ.
102 103 104 105 106
0.5 0.55 0.6 0.65 0.7 0.75 0.8
εmax= 0.10 %
εmax= 0.125 %
εmax= 0.15 %
68 % confidence interval
Normalized crack length,
α
Fatigue cycles,
N
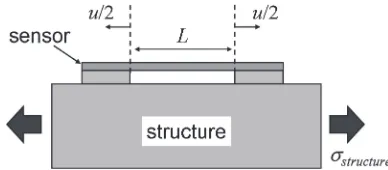
[image:4.595.57.280.68.255.2] [image:4.595.316.541.73.250.2] [image:4.595.73.526.315.449.2] [image:4.595.320.530.520.760.2]strain of the structure. A simple model for the attached sensor to structure is depicted in Fig. 10. It is assumed that the
far-field stress in the plate is a uniaxial tension (·structure) in elastic
region and the sensor is perfectly bonded on the plate. If thickness of the sensor is enough thin, strain distribution in the plate is uniform regardless of the presence of the sensor, and ·structureis described as follows:
·structure¼EstructureLu ð8Þ
where Estructure is Young’s modulus of structure, u is the
displacement on the sensor and L is gauge length of the sensor, respectively. In the following sections, a method to estimate fatigue damage parameters will be proposed in the case that the structure is subjected to cyclic loading with the stress ratio (R=·structure,min/·structure,max) of 0.1, material of
which is steel (Estructure=200 GPa).
5.4.2 Estimation of fatigue cycles
Since strain ratio of the attached sensor is also 0.1 in the above case, the fatigue crack growth behavior in the sensor can be predicted from the results as shown in Fig. 9. Substituting eq. (8) to eqs. (1) and (5) with logZ=0, fatigue cycles can be expressed as:
N¼W
C
ffiffiffiffiffiffiffiffi
³W
p
·structureEsensor ð1¯2ÞEstructure
mZ¡
¡0
fpffiffiffiffi¡ifð¡iÞgmd¡i
·structure¼ ð1RÞ·structure,max ð9Þ
whereEsensoris Young’s modulus of the sensor. The effect of
scattering is not considered in this equation. Fatigue cycles were calculated by eqs. (6) and (9) as a function of stress amplitude (¦·structure) and normalized crack length in the
sensor, as shown in Fig. 11. Stress amplitude can be estimated from crack length detected from two sensors with different characteristics, as the details were described in the previous paper.7)Therefore, it was shown that fatigue cycles
on structures can be estimated using smart patch.
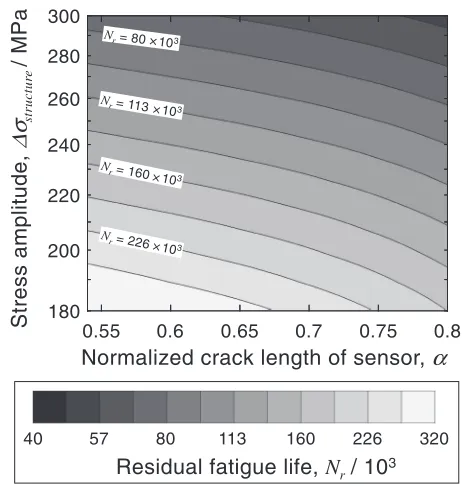
5.4.3 Estimation of residual fatigue life
Evaluation of residual fatigue life of structure is important to avoid the rapture caused by cyclic loading. Residual fatigue life (Nr) is commonly defined as:
Nr ¼NfN ð10Þ
where Nf is a number of cycles to failure. Based on many
studies about fatigue life of structural components, relation-ship between stress amplitude and the number of cycles to failure is generally characterized by S-N curve in high-cycle fatigue situations as:
Nf ¼CSN·mSN ð11Þ
where CSN and mSN is material constants and ¦· is stress
amplitude.19) For example, S-N curve of general structural
steel with mSN=3 and the fatigue strength at two million
cycles (FAT) of 100 MPa is shown in Fig. 12. Substituting fatigue cycles (N) in the previous section (Fig. 11) to eqs. (10) and (11) with mSN=3 and FAT of 100 MPa, the
[image:5.595.70.264.69.154.2]residual fatigue life can be calculated as a function of stress amplitude and normalized crack length in the sensor, as shown in Fig. 13. It was demonstrated that residual fatigue life can be estimated from stress amplitude and crack length in the sensor. As shown in the figure, the structure is safe when the stress amplitude is low and the crack length is small. Since this patch needs neither power supply nor wiring, these results are significant for a long-term monitor-ing of fatigue damage of structure.
Fig. 10 Simple model for the attached sensor to structure.
180 200 220 240 260 280 300
0.55 0.6 0.65 0.7 0.75 0.8
Stress amplitude,
Δσ
structur
e
/ MPa
Normalized crack length of sensor,
α
Fatigue cycles,
N
/ 10
31 4 16 64 256
N = 4 × 10
3
N = 16
× 10
3
N = 64
× 10 3
Fig. 11 Estimation map of fatigue cycles as a function of stress amplitude on structure and normalized crack length of the sensor.
Stress amplitude,
Δσ
structur
e
/ MPa
Fatigue cycles to failure, Nf
50 100 200 300 400
104 105 106 107
FAT 100
[image:5.595.312.542.69.312.2]1
3
[image:5.595.319.531.373.545.2]6. Conclusions
Fatigue crack growth behavior in thin pure copper sheet with pre-crack was evaluated under strain-controlled fatigue testing in order to obtain the sensor characteristics of smart patch and the following conclusions were obtained.
(1) Relationship between stress intensity factor and crack growth rate is fitted on one curve regardless of strain amplitude under strain ratio ofR=0.1.
(2) The scattering in fatigue crack growth was evaluated by a stochastic model, and it demonstrated that the error of estimated fatigue cycles using smart patch is small enough.
(3) Based on these fatigue testing results, this new sensing method to evaluate fatigue cycles and residual fatigue
life of structure is promising for structural health monitoring.
Acknowledgement
This study was partially supported by ISIJ Research Promotion Grant and research fellowship program (No. 22·10020) of Japan Society for the Promotion of Science (JSPS).
REFERENCES
1) C. Doyle, A. Martin, T. Liu, M. Wu, S. Hayes, P. A. Crosby, G. R. Powell, D. Brooks and G. F. Fernando:Smart Mater. Struct.7(1998) 145158.
2) D. C. Lee, J. J. Lee, I. B. Kwon and D. C. Seo:Smart Mater. Struct.10
(2001) 285292.
3) M. Majumder, T. K. Gangopadhyay, A. K. Chakraborty, K. Dasgupta and D. K. Bhattacharya:Sens. Actuat. A: Phys.147(2008) 150164.
4) A. Eriguchi, S. Ogawa, J. Otake and T. Sato: J. Res. Taiheiyo Cement Corp.158(2010) 5564.
5) A. Mita and S. Takahira: Struct. Eng. Mech.17(2004) 331346. 6) Y. Ikemoto, S. Suzuki, H. Okamoto, H. Murakami, H. Asama, S.
Morishita, T. Mishima, X. Lin and H. Itoh:Sens. Rev.29(2009) 127 136.
7) S. Nambu and M. Enoki:Mater. Trans.48(2007) 12441248.
8) S. Nambu and M. Enoki:ISIJ Int.47(2007) 16871691.
9) Y. Fujino, S. Nambu and M. Enoki: Mod. Phys. Lett. B22(2008) 11051110.
10) S. Nambu and M. Enoki:ISIJ Int.51(2011) 8892.
11) T. Shiraiwa and M. Enoki:ISIJ Int.51(2011) 250255.
12) T. Shiraiwa and M. Enoki:ISIJ Int.51(2011) 14801486.
13) H. D. Merchant, M. G. Minor and Y. L. Liu: J. Electron. Mater.28
(1999) 9981007.
14) M. Judelewicz, H. U. Künzi, N. Merk and B. Ilschner:Mater. Sci. Eng. A186(1994) 135142.
15) M. Gonzalez, F. Axisa, M. V. Bulcke, D. Brosteaux, B. Vandevelde and J. Vanfleteren:Microelectron. Reliab.48(2008) 825832.
16) M. Hommel, O. Kraft and E. Arzt:J. Mater. Res.14(1999) 23732376.
17) Y. Murakami: Stress Intensity Factor Handbook, (Pergamon Press, Tokyo, 1987) pp. 99100.
18) P. J. Torvik:J. Appl. Mech.46(1979) 611617.
19) S. Suresh: Fatigue of Materials, (Cambridge University Press, Cambrige, 1998) p. 223.
180 200 220 240 260 280 300
0.55 0.6 0.65 0.7 0.75 0.8
Residual fatigue life,
N
r/ 10
340 80 160 320
Stress amplitude,
Δσ
structur
e
/ MPa
Normalized crack length of sensor,
α
57 113 226
Nr= 226 × 103
Nr= 80 ×103
Nr= 160 × 103
Nr= 113 ×10
[image:6.595.52.283.68.311.2]3