be decreased by more than 70%. However, no so significant improvement on the surface roughness can be obtained without vibration. Based on
this experimental study, the surface asperities variation was approximately proportional to the forming energyW, which increases the ability of
dislocations to overcome the forming resistance in micro-forging. [doi:10.2320/matertrans.M2011254]
(Received August 18, 2011; Accepted December 6, 2011; Published January 25, 2012)
Keywords: surface modification, vibration, micro-forging
1. Introduction
The trend towards further miniaturization, particularly in thefield of electronics production, is now booming. Electric productions are becoming smaller and with more functions.1) This is mainly due to the development of micro-electro-mechanical systems (MEMS) technology. Compared with traditional processes, the newly developed MEMS technol-ogy has more advantages.2,3) Microforming is suitable for manufacturing small metallic parts in big scale productions, due to its high productivity and economic values.4,5) As the dimensions of MEMS devices become smaller, the surface asperities of metallic foils may affect the product dimension accuracy and properties. To maintain a high performance of the MEMS devices, it is necessary to modify the surface of metallic foils to improve the surface asperities before microforming processes.
Researchers have made much effort to manufacture highly precise devices with low surface roughness.69) Among the processes used for reducing surface roughness, micro-forging is suitable for thin metallic foils for its low forming load and excellent performance.
In this study, micro-forgings with and without vibration of phosphor bronze C5191 foils and titanium foils were performed to improve the surface asperities. This study aims to address the relationship between vibration parameters and metal surface characteristics. Particular emphasis was given to vibration time, static force and vibration amplitude. As comparison, titanium foils were used to elucidate the effect of material type on vibration-aided micro-forging results. The results showed that the surface roughness can be reduced by more than 70%. This indicates that vibration-aided micro-forging is an effective process to improve the surface asperities.
2. Experimental Conditions and Setup
In this study, phosphor bronze C5191 foils and titanium foils were used, all with initial thickness of 100 µm. Square
pieces with dimensions of 5 mm©5 mm were cut from the sheet for this experiment.
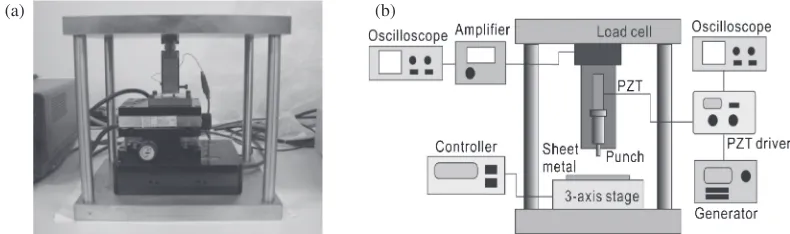
An experimental facility was developed in this study for vibration-aided micro-forging, which can apply both static force and vibration as shown in Fig. 1(a). The facility set is composed of an oscilloscope, an amplifier, a PZT driver, a wave generator and a 3-axis stage controller. Figure 1(b) depicts a detailed geometry of the facility. Different static forces were obtained by lifting and lowering the 3-axis stage. Vibration was provided by a punch connecting to PZT, which can generate vertical sine vibration with frequency of about 1.4 kHz. The vibration time was set to between 1 to 3 s. The punch vibrated at different PZT voltages from 30 to 150 V to get different amplitudes. The corresponding relationship between vibration amplitude and PZT voltage is presented in Table 1. The material of the punch is tungsten-carbide (WC), with diameter of 1.0 mm. The roughness of the punch is 6 nm. The samples werefixed on the 3-axis stage during the experiment.
In order to assess the effect of different parameters on vibration-aided micro-forging, different vibration time, static forces and PZT voltages were used as summarized in Table 2 and five micro-forgings were made for each case. The vibration amplitude was measured using LASER DISPLACEMENT METER (LC-2400). To detect the surface roughness difference between before and after vibration-aided micro-forging, NANOSCALE HYBRID MICRO-SCOPE (KEYENCE VN-8010) was used to measure the foils Ravalues. The hardness of the metal foils surface was
analyzed with SCANNING PROBE MICROSCOPE (SPM-9500J2).
3. Results
3.1 Effect of static force on vibration-aided micro-forging
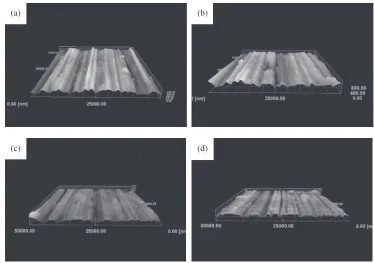
Figure 2 shows how the surface topographies of foils vary with static force. In Fig. 2(a), which shows the surface topography of phosphor bronzer foils before micro-forging, initial asperities are visible. In Figs. 2(b)2(d), the top of the asperities is found to be flatten after vibration-aided micro-forging, and the surface gets smoother with larger static forces. When static force gets to 150 N, the surface becomes veryflat with only few slight scratches remained.
+1Graduate Student, Tokyo Metropolitan University
+2Graduate Student, Tokyo Metropolitan University. Present address:
The relationships between static force and maximum forming force, surface roughness and hardness are presented in Fig. 3. Here, zero static force means no micro-forging was applied to the samples, and in the following analysis, zero vibration time and PZT voltage have the same meaning. As shown here, the maximum forming force rises from 108 N at 50 N to 248 N at 150 N, which means that the foils were stamped at higher pressure. The surface roughness reduces vastly from 65 nm at 50 N to 24 nm at 150 N with a reduction of 63%. Compared to the samples before vibration-aided micro-forging, a pronounced drop in surface roughness can
be obtained even with a small static force of 50 N. On the other hand, the hardness rises from 3.5 to 4.95 GPa and an increasing trend of work hardening can be observed with increasing static force. Based on the results, the static force was found to have significant effects on maximum forming force, surface roughness and hardness.
To confirm the effects of vibration on micro-forging, a micro-forging of phosphor bronzer foils without vibration was performed. The static force was set to 108 N, 189 N, 248 N which are the maximum forming forces with vibration at 50 N, 100 N, 150 N respectively. Figures 4(b)4(d) are
(a) (b)
Fig. 1 (a) Experimental setup (b) configuration of the vibration-aided micro-forging device.
Table 1 Relationship between vibration amplitude and PZT voltage.
PZT
voltage 30 V 90 V 150 V
Vibration
amplitude 0.39 µm 2.95 µm 5.43 µm
Table 2 Experimental cases.
Material Vibration time PZT voltage Static force
Phosphor bronze
foils
1 s 30 V 50 N
2 s 90 V 100 N
3 s 150 V 150 N
Titanium 2 s 150 V 150 N
(a) (b)
(c) (d)
Fig. 2 Surface topographies of phosphor bronze foils at different static forces with same vibration time (2 s) and PZT voltage (150 V)
[image:2.595.99.494.71.188.2] [image:2.595.78.496.253.606.2]roughness was obtained with increasing maximum forming force can be observed in both cases. It is also found that surface roughness of samples without vibration does not decrease so notably as it does with vibration. Figure 5(b) shows the difference of hardness between with and without vibration. For both cases, hardness is increasing with higher maximum forming force. Similarly to surface roughness, the samples hardness that without vibration increases slightly while it rises more significantly with vibration.
3.2 Effect of vibration time on vibration-aided micro-forging
The surface characteristics at different vibration time are presented in Fig. 6. The PZT voltage and static force were set to 150 V and 100 N respectively, and vibration time was selected from 1 to 3 s.
The surface roughness measurements in Fig. 6(a) show that the maximum forming forces are slightly higher with longer vibration time while the surface roughness is shown to be a little smaller as shown in Fig. 6(b). On the other hand, there seems no distinct regularity between time and hardness. Based on the measurement results, the vibration time is shown to have very limited effects on the surface character-istics.
Static force, Fs/N
150 100 50 0 0 20 40 60 80 100 120
2s, 150V
Surface roughness,
Ra
/nm
Static force, Fs/N
150 100 50 0 0 1 2 3 4 5 6 7
Hardness,
H
/GPa
Static force, Fs/N 2s, 150V
(c) (b)
Fig. 3 Effect of static force on (a) maximum forming force; (b) surface
roughness; (c) hardness.
(d) (c)
(b) (a)
Fig. 4 Surface topographies of phosphor bronze foils at different maximum forming forces and same vibration time (2 s) without vibration
[image:3.595.99.242.69.440.2] [image:3.595.109.483.499.762.2]3.3 Effect of PZT voltage (vibration amplitude) on vibration-aided micro-forging
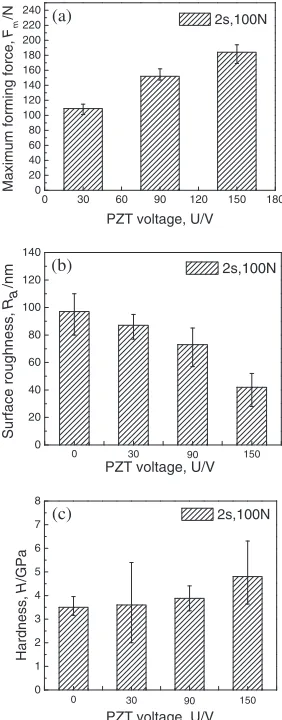
The effect of PZT voltage on maximum forming force, surface roughness values and hardness is presented in Fig. 7. In Fig. 7(a), the maximum forming force increases with larger PZT voltage. As is shown in Fig. 7(b), a significant decrease in surface roughness can be derived even with a small vibration amplitude when applied PZT voltage of 30 V, and lower surface roughness can be obtained when higher PZT voltage is used. The surface roughness decreases from 97 nm before micro-forging to 42 nm at PZT voltage of
150 V, with a decrease of 56.7%. In Fig. 7(c), the hardness is rising when higher PZT voltage is applied, and the hardness value increases by 37% compared with the samples before micro-forging.
3.4 Effect of material type on vibration-aided micro-forging
Figure 8 is surface topographies of different foils before and after vibration-aided micro-forging under the same experimental conditions (2 s, 150 N, 150 V). In Figs. 8(a) and 8(b) which are the surface topographies of phosphor 0 20 40 60 80 100 120
140 With vibration at 2 s, 150 V Without vibration at 2 s
Surface roughness,
Ra
/nm
Maximum forming force, Fm/N
0 108 189 0
1 2 3 4 5 6 7 8 9 10 Hardness, H /GPa
Maximum forming force, Fm/N
With vibration at 2 s, 150 V Without vibration at 2 s
0 108 189
(a) (b)
248 248
Fig. 5 Comparison of micro-forging with and without vibration on (a) surface roughness; (b) hardness.
3 2 1 0 40 80 120 160 200 240 280 150v,100N
Maximum forming force,
Fm
/N
Duration time, T/s
3 2 1 0 0 20 40 60 80 100 120 140 150V,100N
Duration time, T/s
Surface roughness, Ra /nm 3 2 1 0 0 1 2 3 4 5 6 7 8 Hardness, H /GPa
Duration time, T/s 150V,100N
(c) (b) (a)
Fig. 6 Effect of vibration time on (a) maximum forming force; (b) surface
roughness; (c) hardness.
180 150 120 90 60 30 0 0 20 40 60 80 100 120 140 160 180 200 220 240
Maximum forming force,
Fm
/N
PZT voltage, U/V 2s,100N 0 20 40 60 80 100 120 140 90 150 30 Surface roughness, Ra /nm
PZT voltage, U/V 2s,100N 0 0 1 2 3 4 5 6 7 8 0 Hardness, H /GPa
PZT voltage, U/V 2s,100N 90 150 30 (a) (b) (c)
Fig. 7 Effect of PZT voltage on (a) maximum forming force; (b) surface
[image:4.595.142.456.71.191.2] [image:4.595.98.242.228.607.2] [image:4.595.356.497.232.592.2]bronzer foils before and after vibration-aided micro-forging, the surface roughness is found to decrease drastically while it is not so notably with titanium foils as shown in Figs. 8(c) and 8(d).
Figures 9(a) and 9(b) show the measurement results of surface roughness and hardness with different foils. In Fig. 9(a), the surface roughness value of phosphor bronzer foils reduces by 75%, but the titanium foils surface roughness value decreases merely 6%. In Fig. 9(b), both phosphor bronzer and titanium foils hardness is found to increase after vibration-aided micro-forging. In addition, titanium foils hardness increases slightly less than phosphor bronzer foils. Based on the result, the vibration-aided micro-forging is shown to have better effect on phosphor bronzer foils.
4. Discussion
Based on the analysis above, the vibration time seems to have little effect on surface roughness and hardness. On the contrary, static force and PZT voltage cause greater changes on surface characteristics. As shown in Fig. 5, significant
decrease in surface roughness and increase in hardness occurred after applying vibration. To elucidate the impact of static force and PZT voltage on surface roughness and hardness, the forming energy W under different conditions were calculated. The simplified model of the vibration-aided micro-forging is shown in Fig. 10. The forming energy W
can be written as eq. (1). To locate the weight of dynamic energyWdand static energyWsonW,fis introduced as scale factor.
W¼WdþWs ¼FddþfFsd
¼Fd ðFd=kÞ þfFs ðFs=kÞ
¼Fd2=kþfFs2=k ð1Þ
where
Fd¼Fd0Fs ð2Þ
Fs¼1 t
Zt
0
FðtÞdt ð3Þ
Where k is coefficient of elasticity of the punch; F(t) is relationship between time and load; Fd0 is average force of up-half period ofF(t).
(c) (d)
Fig. 8 Surface topographies of different foils with vibration-aided micro-forging (a) phosphor bronze foils before; (b) phosphor bronze
foils after; (c) titanium foils before; (d) titanium foils after.
0 20 40 60 80 100 120
Surface roughness,
Ra
/nm
Material type before after
Phosphor bronzer Titanium 0
2 4 6 8
Hardness,
H
/GPa
Material type before after
Phosphor bronzer Titanium
(a) (b)
Fig. 9 Comparison of (a) surface roughness; (b) hardness with different
foils before and after vibration-aided micro-forging at (2 s, 150 V, 150 N).
Vibration Static
force
Applying static force only
Applying static force and vibration Before
[image:5.595.112.484.67.327.2]forging
[image:5.595.317.535.381.466.2] [image:5.595.49.293.382.478.2] [image:5.595.316.549.625.747.2]Different Wand different surface characteristics variation can be derived under different experimental conditions. The surface roughness variation (Rr) should be linear to
Fd2+f·Fs2, so there must be a certainfvalue which makes Y(f) minimum. Y(f) is difference between experimental data and linear fit which can be written as eq. (4). By applying differentfvalues, it is found that when fequals to 0.2, Y(f) is the minimum, which means Fd2+f·Fs2 coincides with surface roughness variation (Rr) the best. Applying f
equaling to 0.2, we can get the relationship between surface characteristics variation and Was shown in Fig. 11. When
f equals to 0.2, hardness variation (Hr) is also linear to
Fd2+f·Fs2. This suggests that the weight of dynamic force on deformation is much higher than static force, and the contribution ratio of dynamic energy and static energy in deformation is approximate 5 : 1. We can conclude that, the effect of PZT voltage on reducing surface roughness and increasing hardness is more significant than that of static force.Rr andHrcan be expressed as eqs. (5) and (6).
YðfÞ ¼
ffiffiffiffiffiffiffiffiffiffiffiffiffiffiffiffiffiffiffiffiffiffiffiffiffiffiffiffiffiffiffiffiffiffiffiffiffiffiffiffiffiffiffiffiffiffi 1
6 X5
i¼0
½gðf; aiÞ hðaiÞ2 v
u u
t ð4Þ
Where h(ai) is experimental data, andg(f,ai) is linearfit of
h(ai).
Rr ¼RbeforeR
Rbefore 100% ð5Þ
Hr ¼HHbefore
Hbefore 100% ð6Þ
Where Rbeforeand Ris surface roughness before and after micro-forging.Hbefore andH are hardness values before and after micro-forging.
During the deformation of metal foils, the dislocations were assumed to be obstructed. In vibration-aided micro-forging, the forming energyWis thought to be preferentially absorbed by dislocations, and the energy increases their ability to surmount obstacles so as to make the metallic foils deform more. When the energy is larger, it will be easier for the dislocations to overcome obstacles and the foils deform more thoroughly. This may be the actual cause of why vibration-aided micro-forging can reduce surface roughness and increase hardness under a comparative low stress.
What should be noted is that although the vibration-aided micro-forging is effective in improving phosphor bronzer foils surface asperities, it seems to be less effective on
titanium foils (Figs. 8 and 9). This may attribute to the fact that titanium has a dense-hexagonal structure (HCP), which has very few slip systems and is hard for dislocations slip and the equipment used in this study can not provide enough energy to drive dislocations.
There are still some cases needed further investigations as shown in the followings:
(1) Investigation on why the contribution ratio of the dynamic energyWdand the static energyWsis 5 : 1. (2) Consideration of further effective parameters including
heat effects and effects induced by microstructure modification.
5. Conclusions
Vibration-aided micro-forging under different experimen-tal conditions were performed on phosphor bronzer foils and titanium foils. The vibration-aided micro-forging was found an effective process to improve surface characteristics. In particular, the surface roughness and hardness difference was studied and very pronounced decrease and increase were found in surface roughness and hardness. However, micro-forging without vibration did not lead to a significant difference in surface roughness and hardness. Based on the results, contribution ratio of dynamic energy and static energy in deformation is approximate 5 : 1, and the effect of PZT voltage on surface deformation is more significant than that of static force.
REFERENCES
1) J. Jeswiet, M. Geiger, U. Engel, M. Kleiner, M. Schikorra, J. Duflou, R.
Neugebauer, P. Bariani and S. Bruschi:CIRP J. Manuf. Sci. Technol.1
(2008) 217.
2) T. Masuzawa:CIRP Annal.49(2000) 473488.
3) H. V. Brussel, J. Peirs, D. Reynaerts, A. Delchambre, G. Reinhart, N.
Roth, M. Weck and E. Zussman:CIRP Annal.49(2000) 451472.
4) U. Engel and R. Eckstein: J. Mater. Sci. Technol.125126(2002) 3544.
5) F. Vollertsen, Z. Hu, H. S. Niehoff and C. Theiler: J. Mater. Sci. Technol.
151(2004) 7079.
6) J. Xu, C. J. Wang, B. Guo, D. B. Shan, Y. Sugiyama and S. Ono:Trans.
Nonferrous Met. Soc. China19(2009) 526530.
7) S. Mahabunphachai, Ö. N. Cora and M. Koc: J. Power Sources195
(2010) 52695277.
8) H. Ike:Wear258(2005) 14041410.
9) S. Spinler, S. Schmidbauer and J. Klotzsche: Microelectron. Eng.50
(2000) 311319.
0 2000 4000 6000 8000 0
20 40 60 80 100
R
r
(%)
experiment data at f =0.2 fit line of experiment data
75.26% (150 V, 150 N)
55.67% (150 V, 100 N)
33% (150 V, 50 N) 24.74% (90 V, 100 N) 10.31% (30 V, 100 N) before
Fd2+f*Fs2
0 2000 4000 6000 8000 0
10 20 30 40 50 60 70
experiment data at f =0.2 fit line of experiment data
45.57% (150 V, 150 N) 39.3% (150 V, 100 N)
17.3% (150 V, 50 N) 11% (90 V, 100 N) 3.14% (30 V, 100 N) before
H
r
(%)
Fd2+f*Fs2
[image:6.595.130.467.72.199.2](a) (b)