The Equilibrium Relation of Immiscibility in an Fe-Cu-B System at 1873 K
Katsuhiro Yamaguchi
*, Hideki Ono and Tateo Usui
Division of Materials and Manufacturing Science, Graduate School of Engineering, Osaka University, Suita 565-0871, Japan
The equilibrium relation of the phase separation in the Fe-Cu-B system is investigated at 1873 K for potential use in the separation of copper from iron in steel scrap recycling. Liquid immiscibility is confirmed even at low boron content in iron,½mass%B(in Fe)¼0:006. By combining the Taylor series equation proposed by Wagner and that of the quadratic formalism proposed by Darken, the thermodynamic interaction parameters of copper for boron in molten iron, which can be applied with precision over the wide concentration range, are derived. The first and the second order interaction parameters of copper for boron in molten iron at 1873 K are:
"B
Cu¼ Cu,BCu ¼12:1ð0:6Þ; BCu¼ 18:9ð11:0Þ ðNB(in Fe)<0:34Þ eBCu¼0:254ð0:014Þ;rBCu¼ 0:032ð0:014Þ ð½mass%B(in Fe)<8:9Þ
Moreover, the immiscibility range in the Fe-Cu-B system is also investigated by applying a symmetrical and regular solution model.
[doi:10.2320/matertrans.M2009415]
(Received December 15, 2009; Accepted March 29, 2010; Published May 19, 2010)
Keywords: recycling, steel scrap, tramp element, copper, boron, quadratic formalism, immiscibility
1. Introduction
The recycling of iron and steel scrap is an important industrial process in preventing resource depletion and preserving the environment. In particular, recycling contrib-utes to the reduction of carbon dioxide emissions from iron-and steelmaking processes. However, it is difficult to recycle scrap containing higher amounts of tramp elements, such as copper and tin, which cannot be removed by oxidizing refining in a conventional steelmaking process. For this reason, large amounts of iron and steel scrap have accumu-lated without being recycled.
The liquid phase of the Fe-Cu binary system is miscible over the whole composition range. It has been reported that it separates into the Fe- and Cu-rich phases by adding C,1–3)
Si,4) P5) or B.6) The recovery of iron and copper from the
Fe-Cu-B alloy has been discussed using two liquid phases
separation.7) However, the effect of boron on the liquid
immiscibility of the Fe-Cu system has not been clarified owing to the lack of experimental results at low boron content. In this study, the equilibrium relation of the phase separation in the Fe-Cu-B system is investigated at lower boron content and 1873 K. Using this additional data, the interaction parameters of boron for copper are re-evaluated. In the re-evaluation, the Taylor series equation proposed by
Wagner8)and that of the quadratic formalism proposed by
Darken9,10) are combined, as performed recently by Miki
et al.11,12)Mikiet al.determined many of the thermodynamic
parameters in the multi-component system by using the Redlich-Kister type polynomial. In this work, the equations proposed by Darken and Wagner are combined to reduce the unknown interaction parameters in the Fe-Cu-B system. Moreover, the immiscibility range in the Fe-Cu-B system is also investigated by applying a symmetrical and regular solution model.
2. Experimental
Preparation of the Fe-1 mass%B alloy was carried out as follows; high purity electrolytic iron and reagent grade boron (purity: 99.8%) were charged in an alumina crucible and
were melted at 1873 K in an Ar-10 vol%H2atmosphere using
an induction furnace. The experimental apparatus consisted of a mullite tube (60 mm outer diameter, 52 mm inner
diameter, 1000 mm length) and a vertical MoSi2 electric
resistance furnace, which was connected to a proportional integral derivative (PID) action controller with a Pt-6%Rh/ Pt-30%Rh thermocouple. Totally 10 g of the resultant Fe-1 mass%B alloy and electrolytic iron and Fe-10 g of reagent grade copper (purity: 99.0%) were charged in an alumina crucible (15 mm outer diameter, 12 mm inner diameter, 100 mm height). The alumina crucible was inserted into a graphite holder (42 mm outer diameter, 34 mm inner diam-eter, 150 mm height) and placed in a furnace with argon atmosphere for 5 h at 1873 K to obtain the equilibrium Fe-and Cu-rich phases. The graphite holder was then withdrawn from the furnace and the sample was rapidly quenched in ice-cooled water. The boron and copper contents in the Fe-rich phase as well as the boron and iron contents in the Cu-rich phase were analyzed by inductively coupled plasma atomic emission spectrometry (ICP-AES). In this work, a small amount of aluminum from the alumina crucible may become dissolved in the iron. However, the effect of the aluminum in the iron is not taken into account as it is considered negligible as indicated by the results of several similar experiments.6,13)
3. Results
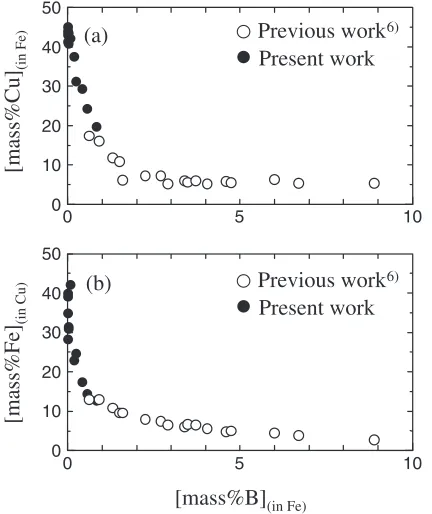
The experimental results in Table 1 show that the boron content in the Cu-rich phase is much lower than that in the Fe-rich phase, and liquid immiscibility is confirmed even at the low boron content in iron,½mass%B(in Fe)¼0:006. The
effect of the boron content on the copper content in the Fe-rich phase and on the iron content in the Cu-Fe-rich phase is
shown in Figs. 1(a) and (b), respectively, where the data points at the higher content of boron were obtained in our
previous study.6) These results are also plotted on the
isothermal section of the Fe-Cu-B ternary system at 1873 K in Fig. 2. The miscibility gap between the two liquid phases increases with increasing boron content in the Fe-rich phase. The calculated immiscibility curve in Fig. 2 will be ex-plained below.
4. Discussion
4.1 Determination of interaction parameters between
copper and boron in molten iron
By applying the Taylor series equation proposed by
Wagner,8) the activity coefficient of the Cu in the Fe-rich
phase is expressed by:
lnðCu(in Fe)=Cu(in Fe) Þ
¼"CuCuNCu(in Fe)þ"BCuNB(in Fe)þCuCuN
2
Cu(in Fe)
þBCuNB(in Fe)2 þCu,BCu NCu(in Fe)NB(in Fe)
ð1Þ
where "ij and ij are the first and second order interaction parameters of j for i, i;ji is the second order interaction parameter of i and j for i,
i is the activity coefficient of
component i at infinite dilution and Niðin FeÞ is the mole
fraction of component i in the Fe-rich phase. From the
equation of quadratic formalism proposed by Darken,9,10)the
activity coefficient of the Cu in the rich phase of the Fe-Cu-B system is expressed as:
lnðCu(in Fe)=Cu(in Fe) Þ
¼ 2Fe-CuNCu(in Fe)þ ðCu-BFe-CuFe-BÞNB(in Fe)
þFe-CuNCu(in Fe)2 þFe-BNB(in Fe)2 ð2Þ
þ ðFe-CuþFe-BCu-BÞNCu(in Fe)NB(in Fe)
whereij is a constant which characterizes the
thermody-namic property of the ij binary solution at constant
temperature and pressure. By comparing the coefficients for each term in eqs. (1) and (2), the unknown parameters,"B
Cu
andCu,BCu , are related as follows:
"BCu ¼Cu-BFe-CuFe-B¼ Cu,BCu ð3Þ
Taking eq. (3) into consideration, eq. (2) can be rewritten as:
flnðCu(in Fe)=Cu(in Fe) Þ " Cu
CuNCu(in Fe)CuCuN
2
Cu(in Fe)g=N
2
B(in Fe)
¼ fð1NCu(in Fe)Þ=NB(in Fe)g"BCuþ B
Cu ð4Þ
Values are available for Cu ð¼8:58Þ,14) "CuCu ð¼ 6:74Þ15)
andCuCuð¼9:9Þ.15)The activity of copper is known from the activity data for the Fe-Cu binary alloy16)because the boron
content in the Cu-rich phase is negligibly small. Accordingly, the activity coefficient of copper in iron,Cu, is determined
by taking the equilibrium of the copper between the Fe- and Cu-rich phases into account. Figure 3 shows the relationship between the left hand side of eq. (4) and theð1NCu(in Fe)Þ=
NB(in Fe) term in the range of NB(in Fe)>0:014. The values
for"B
CuandBCuare derived from the slope and the intercept,
respectively, of the regression line in Fig. 3. The derived values are:
"BCu¼ Cu,BCu ¼12:1ð0:6Þ;
BCu¼ 18:9ð11:0Þ ðNB(in Fe)<0:34Þ ð5Þ
By using the relations between"ijandeij, as well asij,eijand
[image:2.595.318.534.74.191.2]rijexpressed by eqs. (6) and (7), the mass percent interaction
Table 1 Two liquid phases separation in Fe-Cu-B system at 1873 K.
Sample Fe-rich (upper part) Cu-rich (lower part)
No. [mass%Cu] [mass%B] [mass%Fe] [mass%B]
1 40.9 0.006 34.8 0.001
2 46.5 0.012 39.6 0.007
3 42.2 0.016 39.4 0.007
4 44.7 0.019 28.1 0.004
5 45.4 0.027 31.7 0.007
6 39.8 0.033 30.5 0.006
7 42.1 0.091 41.1 0.058
8 36.5 0.183 23.0 0.038
9 32.0 0.250 25.0 0.029
10 29.5 0.433 17.5 0.019
11 23.9 0.568 14.4 0.016
12 19.6 0.840 12.5 0.023
0 10
0 10 20 30 40 50 0
5
5 10
0 10 20 30 40 50
Previous work
6) [image:2.595.45.293.84.258.2] [image:2.595.63.279.291.548.2]Present work
[mass%Fe]
(in Cu)
[mass%Cu]
(in Fe)
[mass%B]
(in Fe)Previous work
6)Present work
(a)
(b)
Fig. 1 Boron content of Fe-rich phase on the copper content in Fe-rich phase (a) and on the iron content in Cu-rich phase (b).
0.2 0.4
0.6 0.8
0.2 0.4
NFe NB
Fe-rich phase (Present work)
Fe-rich phase (Previous work)6)
Cu-rich phase (Present work)
Cu-rich phase (Previous work)6)
Immiscibility curve (calc.)
Fe Cu
parameters,eB Cu andr
B
Cu, are expressed by eq. (8), whereMi
is the atomic weight of elementi.
"ij¼230ðMj=MFeÞe
j
i þ f1 ðMj=MFeÞg ð6Þ
ij¼ ð230=MFe2Þf100Mj2rijþMjðMFeMjÞe j ig
þ1=2ðMFeMjÞ2=MFe2 ð7Þ
eBCu¼0:254ð0:014Þ; rBCu¼ 0:032ð0:014Þ
ð½mass%B(in Fe)<8:9Þ ð8Þ
These derived parameters are valid for the concentration range ofNB(in Fe)<0:34. In our previous work,6)the first and
the second order interaction parameters were determined separately to be eBCu¼0:18 (½mass%B(in Fe)<3:3) and
rBCu¼ 0:015(½mass%B(in Fe)<8:9). In this work, a
slight-ly larger value is derived for the first order interaction parameter of boron for copper by combining the equations proposed by Darken and Wagner.
4.2 Influence of boron on the liquid immiscibility of the Fe-Cu-B system
In order to describe the liquid immiscibility of the Fe-Cu-B system, we consider the mixing of the Fe-B and Cu pseudo-binary system, because boron, which is an interstitial element, is only dissolved in the Fe-rich phase. The boron in the Fe-rich phase is assumed to affect the liquid immiscibility of the Fe-Cu-B system by decreasing the mixing enthalpy of the pseudo-binary system. The compo-sition of the pseudo-binary system is then described by the ratio of the mole fraction of the substitutional elements, Fe and Cu, andN0
Cuis expressed by:
NCu(in M)0 ¼NCu(in M)=ðNFe(in M)þNCu(in M)Þ
ðM¼Fe, CuÞ ð9Þ
The variation of the boron mole fraction in the Fe-rich phase withN0
Cu(in Fe) andN0Cu(in Cu) is shown in Fig. 4. Plots
are almost symmetrical aroundN0
Cu¼0:5, and the
immisci-bility gap increases with increasing boron content in the Fe-rich phase. In this work, based on the fact that the experimental results can be explained by a symmetrical solution when we consider the Fe-B and Cu pseudo-binary system, the experimental results are analyzed as follows; when a symmetrical and regular solution model is applied to the Fe-Cu alloy in the Fe-Cu-B system, the Gibbs free energy of mixing one mole of total Fe and Cu is expressed as:
Gmix¼AFe-Cu-Bð1NCu0 ÞN
0
Cu
þRTfð1NCu0 Þlnð1NCu0 Þ þNCu0 lnNCu0 g ð10Þ
whereAFe-Cu-Bis a type of interaction parameter among Fe,
Cu and B, which is independent of temperature and pressure. In this model, the affinity between Fe and Cu changes as the boron content in the Fe-rich phase varies. This in turn affects the Gibbs free energy of mixing of the pseudo-binary system.
Accordingly, the value for AFe-Cu-B, which is a coefficient
of the enthalpy term in eq. (10), is a function of the boron content in the Fe-rich phase. The second term on the right hand side of eq. (10) is an entropy term. From eq. (10),
theGmix curve becomes symmetrical atN0
Cu¼0:5. When
two liquid phases separation occurs, theGmix curve has a
common tangent, two contact points and two local minima. The composition of the two contact points and the local minima is the same as a result of the symmetry of theGmix
curve. Therefore, the composition of the coexisting Fe- and Cu-rich phases is in agreement with the local minima of the
Gmix curve. Accordingly, the composition of the Fe- and
Cu-rich phase can be calculated by differentiating eq. (10) as a function ofN0
Cuand equating the derivative to zero.
dGmix dN0
Cu
¼AFe-Cu-Bð12NCu0 Þ þRTln
NCu0
1N0
Cu
¼0 ð11Þ
The relationship given by eq. (11) is plotted in Fig. 5. The
values for AFe-Cu-B are determined from the experimental
results of the Fe-rich phase as a function of boron content in this phase, and the experimental results of the Cu-rich phase are compared with the calculated curve of eq. (11) in Fig. 5. The experimental results are in good agreement with the calculated curve, implying that the model is valid as applied to all samples used in this study.
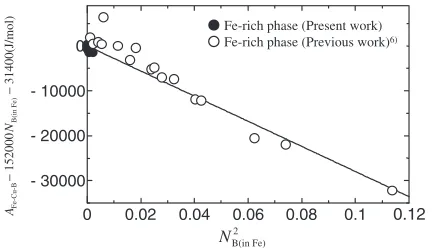
The relationship betweenAFe-Cu-Band the mole fraction of
boron in the Fe-rich phase is shown in Fig. 6. The value of
AFe-Cu-B monotonically increases in the range of NB(in Fe)< 0:14, and the regression equation is derived as follows: Present work
Previous work6)
B(in Fe) Cu(in Fe) 1
N N
0 10 20 30 40 50 60
0 200 400 600 800 1000
{}
2 B(in Fe) 2 Cu(in Fe) Cu Cu
Cu(in Fe)
Cu Cu
Cu(in Fe)
Cu(in Fe)
/
ln
N
N
N
ρ
ε
γ
γ
°
Fig. 3 Relationship between the left hand side of eq. (4) and
ð1NCu(in Fe)Þ=NB(in Fe).
0 0.1 0.4
(M
=
Fe,Cu)
'Cu (in M)
N
0 1
Fe-rich phase (Present work)
Fe-rich phase (Previous work)6)
Cu-rich phase (Present work)
Cu-rich phase (Previous work)6)
0.2 0.3 0.5
Fe-rich phase
Cu-rich phase
N
B(in Fe) [image:3.595.320.532.71.273.2] [image:3.595.65.279.74.215.2]AFe-Cu-B¼152000NB(in Fe)þ31400 ðJ/molÞ
ðNB(in Fe)<0:14Þ ð12Þ
In order to extend the application range, a quadratic term is added as follows:
AFe-Cu-B152000NB(in Fe)31400¼kNB(in Fe)2 ð13Þ
The relationship between the left hand side of eq. (13) and
NB(in Fe)2 is shown in Fig. 7. The value forkis derived from
the slope of eq. (13) and is found to be 280000 from
the regression line which passes through the origin at
NB(in Fe)¼0. As a result, the following equation is derived
forNB(in Fe)ranging from 0.14 to 0.34:
AFe-Cu-B
¼ 280000NB(in Fe)2 þ152000NB(in Fe)þ31400ðJ/molÞ
ð0:14<NB(in Fe)<0:34Þ ð14Þ
As shown in Fig. 4, the plots of NB(in Fe) are nearly
sym-metrical around N0
Cu¼0:5, and this model can be applied
at even higher boron contents (0:14<NB(in Fe)<0:34).
For this reason, the pseudo-binary system model can be reasonably applied over the entire concentration range investigated in this work, and, in the region of 0:14<
NB(in Fe)<0:34, the dependence of AFe-Cu-B on the boron
content becomes small, as shown in Fig. 6.
The immiscibility curve can be described usingAFe-Cu-B.
The value for AFe-Cu-Bis calculated from eqs. (12) and (14)
using the mole fraction of boron in the Fe-rich phase. Two solutions are derived by substituting the AFe-Cu-B value into
eq. (11) with the exception ofN0
Cu¼0:5. The larger solution
is N0
Cu(in Cu), and the smaller one is NCu(in Fe)0 . The mole
fraction of iron and copper in the Fe-rich phase can be calculated from eqs. (15) and (16).
NCu(in Fe) ¼ ð1NB(in Fe)ÞNCu(in Fe)0 ð15Þ
NFe(in Fe)¼1NCu(in Fe)NB(in Fe) ð16Þ
The immiscibility curve determined from this calculation and shown in Fig. 2 agrees very well with our experimental results.
5. Conclusion
Liquid immiscibility in the Fe-Cu-B system has been investigated at 1873 K with the following conclusions:
(1) It has been confirmed that two liquid phase separation occurs even at the lower boron content in iron,
½mass%B(in Fe)¼0:006.
(2) The first and second order interaction parameters of copper and boron in molten iron as derived from the experimental results by combining Wagner’s equation with the quadratic formalism proposed by Darken at 1873 K are:
"BCu¼ Cu,BCu ¼12:1ð0:6Þ; BCu¼ 18:9ð11:0Þ
ðNB(in Fe)<0:34Þ
eBCu¼0:254ð0:014Þ;rBCu¼ 0:032ð0:014Þ
ð½mass%B(in Fe)<8:9Þ
(3) By applying a symmetrical and regular solution model in the Fe-B and Cu pseudo-binary system, the immis-cibility curve of the Fe- and Cu-rich phases is reproduced very well. The Gibbs free energy of mixing is expressed as:
Gmix ¼ ð1NCu0 ÞNCu0 AFe-Cu-B
þRTfð1NCu0 Þlnð1NCu0 Þ þNCu0 lnNCu0 g
whereNCu0 is given by:
NCu(in M)0 ¼NCu(in M)=ðNFe(in M)þNCu(in M)Þ
ðM¼Fe, CuÞ
andAFe-Cu-Bis expressed as:
0 1
0 50000 100000
Fe-rich phase (Present work) Fe-rich phase (Previous work)6)
Cu-rich phase (Present work) Cu-rich phase (Previous work)6)
Immiscibility curve (calc.)
Fe-rich phase Cu-rich phase
)
/(J mol
-1
Fe-Cu-B
A
(M
=
Fe,Cu)
'Cu (in M)
N
Fig. 5 Relationship betweenAFe-Cu-BandNCu(in M)0 in the Fe- and Cu-rich phases.
0 0.2 0.4
30000 40000 50000
NB(in Fe)
Fe-rich phase (Present work) Fe-rich phase (Previous work)6)
)
/(J mol
-1
Fe-Cu-B
A
Fig. 6 Variation ofAFe-Cu-Bwith addition of boron.
0 0.02 0.04 0.06 0.08 0.1
- 30000 - 20000 - 10000 0
Fe-rich phase (Present work)
Fe-rich phase (Previous work)6)
−
31400(J/mol)
−
152000
B(in Fe)
Fe-Cu-B
N
A
2 B(in Fe)
N
0.12
[image:4.595.64.278.71.270.2] [image:4.595.64.273.323.449.2] [image:4.595.62.279.488.614.2]AFe-Cu-B¼152000NB(in Fe)þ31400ðJ/molÞ
ðNB(in Fe)<0:14Þ
AFe-Cu-B¼ 280000NB(in Fe)2 þ152000NB(in Fe)
þ31400ðJ/molÞ
ð0:14<NB(in Fe)<0:34Þ
REFERENCES
1) K. Yamaguchi and Y. Takeda: Metall. Rev. MMIJ15(1998) 26–37. 2) S. E. Amara, A. Belhadj, R. Kesri and S. H. Thibault: Z. Metallkd.90
(1999) 116–123.
3) K. Marukawa, T. Tanaka and S. Hara: Eng. Mater.48(2000) 62–65. 4) M. Hino, T. Nagasaka and T. Washizu: J. Phase Equilibria20(1999)
179–186.
5) T. Yoshida, S. Ueda and K. Yamaguchi: CAMP-ISIJ17(2004) 3. 6) K. Taguchi, H. Ono-Nakazato and T. Usui: ISIJ Int.46(2006) 29–32. 7) K. Taguchi, H. Ono-Nakazato and T. Usui: ISIJ Int.46(2006) 633–
636.
8) C. Wagner: Thermodynamics of Alloys, (Addison-Wesley, Cambridge, MA, 1952).
9) L. S. Darken: Trans. Met. Soc. AIME239(1967) 80–89. 10) L. S. Darken: Trans. Met. Soc. AIME239(1967) 90–96. 11) T. Miki and M. Hino: ISIJ Int.44(2004) 1800–1809. 12) T. Miki and M. Hino: ISIJ Int.45(2005) 1848–1855.
13) H. Ono-Nakazato, K. Taguchi, R. Maruo and T. Usui: ISIJ Int.47
(2007) 365–369.
14) The Japan Society for the Promotion of Science, The 19th Committee on Steelmaking:Steelmaking Data Sourcebook, (Gorden and Breach Science Publishers, New York, 1988) 278.
15) C. H. P. Lupis and J. F. Elliott: Acta Met.14(1966) 529–538. 16) The 140th Committee of Japan Society for Promotion of Science: