Indentation Size Effect for the Hardness of Refractory Carbides
Akihiro Nino
1;*, Ayumi Tanaka
1, Shigeaki Sugiyama
2and Hitoshi Taimatsu
1 1Department of Materials Science and Engineering, Faculty of Engineering and Resource Science, Akita University, Akita 010-8502, Japan2
Akita Prefectural Research and Development Center, Akita 010-1623, Japan
This study measured the Vickers hardness of the sintered refractory carbides B4C, Mo2C, NbC, TiC, V8C7, W2C, WC, WC–SiC, and ZrC
over a wide range of test forces between 0.49 and 196 N. The results showed an indentation size effect (ISE), with hardness values that increased with decreasing test force for the carbides. The test force dependence of the hardness was analyzed by the proportional specimen resistance (PSR) model. The value of thea1term that reflects the elastic resistance in the model was obtained for the carbides and compared with their
measured elastic, shear, and bulk moduli. It was not clear what type of modulus related strongly to thea1term. There was a strict correlation
between the hardness at an infinite test force and at a test force of 9.8 N. However, the hardness at a test force of 0.49 N a little poorly reflected the hardness at an infinite test force. The hardness at low test forces must be corrected using thea1value in comparing it with the hardness at a test
force of 9.8 N recommended for the Vickers hardness test by the Japanese Industrial Standard. [doi:10.2320/matertrans.M2010110]
(Received March 24, 2010; Accepted July 1, 2010; Published August 11, 2010)
Keywords: refractory carbide, indentation size effect, hardness, proportional specimen resistance model, tungsten carbide
1. Introduction
Carbides such as B4C, TiC, WC, and ZrC have very high melting temperatures. Since these refractory carbides have high hardness, high Young’s modulus, and good thermal and chemical stability, they have been used as materials for surface hard coating. The most important property for surface hard coating is hardness, which is usually determined by indentation hardness tests at low test forces. Recently, the hardness of thin coating films of cutting tools has been measured by the nanoindentation method at considerably low test forces, e.g., 10 mN for a TiC coating1)and 2 mN for a
B4C coating.2) These lower test forces minimize substrate influences on the hardness measurement, which can be significant for indentation depths deeper than 10% of the coating thickness. For the hardness measurement of bulk ceramics, however, a test force of 9.8 N (1 kgf) has been recommended by the Japanese Industrial Standard. Although this test force has been recommended, the hardness measure-ment is actually carried out at various test forces by researchers due to a variety of sample shapes. It is well known that hardness varies with test force, and measured hardness increases with decreasing test force. This phenom-enon has been called the indentation size effect (ISE) in metals3) and ceramics.4–7) Therefore, the ISE must be
considered when comparing the hardness determined at a low test force and the hardness determined at the high test forces used for large bulk materials.
The ISEs have been analyzed using several empirical models, including the traditional Meyer’s law, Hays-Kendall’s approach,3)and the proportional specimen
resist-ance (PSR) model.7)The ISE has been extensively researched
to analyze hardness variation with test forces. The PSR model is based on the effective test force, which is obtained by subtracting the term of the elastic resistance and the fric-tion effect between the indenter facet and the specimen sur-face from the applied test force. The PSR model is the only
model of those used in these studies that has been success-fully applied to analyze the ISE of brittle materials.4,6–9)
In the present study, the change in hardness with test force and elastic properties was measured for the refractory carbides B4C, Mo2C, NbC, TiC, V8C7, W2C, WC, WC– SiC, and ZrC. The analysis of the measured hardness changes and the applicability of the model to refractory carbides are discussed in relation to their elastic moduli.
2. Experimental Procedure
Powders of B4C, Mo2C, NbC, SiC, TiC, VC, W, WC, and ZrC were used as starting materials. The chemical compo-sition and average particle diameter of these powders are given in Table 1. The sintered bodies of the single-phase carbides, except for W2C, were directly obtained from the respective powders. W2C was reaction-sintered from a mixture of W and WC powders (1 : 1:2 mole ratio). A WC–15 mol% SiC composite was prepared from the WC and SiC powders to examine the ISE in the composite carbide. Every powder or mixture was pressed in a graphite die with an inner diameter of 20 mm at an applied pressure of 50 MPa. The obtained compacts were pressure-sintered with a resistance-heated hot pressing machine (SPS-2080, Spark-Plasma Sintering Machine) at a heating rate of 50C min1 and an applied pressure of 50 MPa in the sintering temper-ature range from 1550 to 2000C. Both sides of each sintered body, with a diameter of 20 mm and a height of7mm, were ground by 0.75 mm. One ground surface was polished using a 1-mmdiamond paste.
The density of the sintered bodies was determined by Archimedes method. Young’s modulus and Poisson’s ratio were measured by a pulse-echo method with an elastody-namic rate-measuring system (Toshiba Tungaloy, UMS-HL). The Vickers hardness of the sintered bodies was measured under test forces from 0.49 to 196 N at a holding time of 15 s. The Japanese Industrial Standard (JIS R1610) recommends that a specimen for the Vickers hardness test has more than 0.5 mm thickness and a flat and smooth surface. The polished
*Corresponding author, E-mail: nino@ipc.akita-u.ac.jp
sintered bodies met this recommendation. The average grain sizes of the tungsten carbides were measured by the intercept method using their backscattered electron micrographs.
3. Results and Discussion
3.1 Elastic properties of sintered bodies
The sintering temperature, relative density, Young’s modulus, and Poisson’s ratio of sintered bodies are shown in Table 2. The sintered bodies were polycrystalline and have no preferential texture. Therefore, the elastic modulus values are regarded as those of isotropic materials. The relative density of the specimens sintered in this study ranged from 98 to 100%. These small porosity values have a negligible influence on Young’s modulus. Young’s modulus of the prepared refractory carbides ranged from 400 to 712 GPa. Young’s modulus of the carbides has been reported in the literature as 460 GPa for B4C,10,11) 223–534 GPa for
Mo2C,10,12–18)338–540 GPa for NbC,10,12–17,19)269–486 GPa
for TiC,10,12–15,17,18,20,21) 255–434 GPa for VC,12–15,18,20,21)
430 GPa for W2C,13,14,22) 519–707 GPa for WC,10,12,14–16,20)
[image:2.595.42.548.82.245.2]and 195–549 GPa for ZrC.12–15,17,22) Poisson’s ratio of ceramics at relatively low porosity is not influenced by the porosity, as reported for Al2O3,23) B4C,11) NbC,19) TaC,19) and WC–WB–W2B.24) The other elastic moduli can be determined by Young’s modulus and Poisson’s ratio data in Table 2.
[image:2.595.47.551.288.446.2]3.2 Hardness of refractory carbides
Figure 1 shows the test force dependence of the Vickers hardness in B4C, Mo2C, and NbC. Li and Bradt reported the anisotropy of ISE in single-crystal TiO2 and SnO2.7) The sintered bodies were polycrystalline and have no preferential texture. At a low test force, where the size of an indentation Table 2 Sintering condition and properties of the sintered bodies.
cabide sintering temperature (C)
relative density (%)
Young’s modulus (GPa)
shear modulus (GPa)
bulk modulus
(GPa) Poisson’s ratio
B4C 2000 100 460 191 257 0.202
Mo2C 1550 100 400 156 307 0.283
NbC 1800 99 494 200 311 0.235
TiC 1800 100 454 187 263 0.212
VC 1600 100 428 175 256 0.221
W2C 1900 99 442 172 338 0.282
WC (0.43mm) 1800 100 702 291 401 0.208
WC (1.4mm) 1800 99 714 297 402 0.204
WC (2.5mm) 1800 99 708 293 403 0.207
WC–15 mol% SiC 1600 98 672 280 375 0.201
ZrC 1900 99 415 172 234 0.205
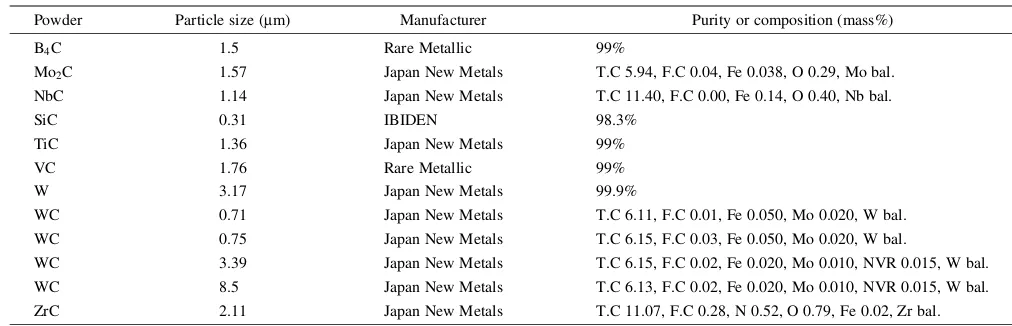
Table 1 Chemical composition of the initial material powders.
Powder Particle size (mm) Manufacturer Purity or composition (mass%)
B4C 1.5 Rare Metallic 99%
Mo2C 1.57 Japan New Metals T.C 5.94, F.C 0.04, Fe 0.038, O 0.29, Mo bal.
NbC 1.14 Japan New Metals T.C 11.40, F.C 0.00, Fe 0.14, O 0.40, Nb bal.
SiC 0.31 IBIDEN 98.3%
TiC 1.36 Japan New Metals 99%
VC 1.76 Rare Metallic 99%
W 3.17 Japan New Metals 99.9%
WC 0.71 Japan New Metals T.C 6.11, F.C 0.01, Fe 0.050, Mo 0.020, W bal.
WC 0.75 Japan New Metals T.C 6.15, F.C 0.03, Fe 0.050, Mo 0.020, W bal.
WC 3.39 Japan New Metals T.C 6.15, F.C 0.02, Fe 0.020, Mo 0.010, NVR 0.015, W bal.
WC 8.5 Japan New Metals T.C 6.13, F.C 0.02, Fe 0.020, Mo 0.010, NVR 0.015, W bal.
ZrC 2.11 Japan New Metals T.C 11.07, F.C 0.28, N 0.52, O 0.79, Fe 0.02, Zr bal.
T.C: total carbon, F.C: free carbon, NVR: non volatile residue, bal: balanced.
Fig. 1 Variation of Vickers hardness as a function of the test force for B4C,
[image:2.595.281.542.292.672.2] [image:2.595.321.531.438.666.2]is very small, a hardness value obtained at a test force reflects the anisotropy of a grain. Since the Vickers hardness value was determined by the average of seven readings for each test condition, the hardness approaches an average value for any crystalline direction. Consequently, the hard-ness values are regard as those of isotropic materials. The hardness of these carbides increased with decreasing test force. For example, the hardness value for B4C increased from 27.8 GPa at a test force of 19.6 N to 39.5 GPa at 0.49 N. This phenomenon is known as the ISE. Each carbide has a unique test force effect. Figure 2 illustrates the test force dependence of the Vickers hardness in TiC, VC, and W2C. The hardness measurements for the TiC and VC carbides lack data in the large test force range because these carbide specimens cracked under high test force due to their low fracture toughness. The TiC, VC, and W2C refractory carbides also exhibited sharp increases in hardness in the small test force range. Figure 3 shows the hardness changes
of WC, WC–15 mol% SiC, and ZrC with test force. The Vickers hardness increased with decreasing test force in WC, WC–15 mol% SiC, and ZrC.
All the refractory carbides exhibited the sharp increase in hardness in the range of small test forces. The ISE has already been reported in -brass,3) aluminum,3)
Al2O3,5,6,25) cobalt-based alloy,26) copper,3) diamond,8)
glass,4) iron,3) MgB2,9) mullite,6,25) nickel,3) steel,3)
sap-phire,27) vitreous silica,28) SiC,6) SiC whisker-toughened
Si3N4,6,25) Si3N4,4,6,25) SnO2,7) soda-lime glass,6)
Ti(C,N)-based cement,6,25) TiC,3) TiO2,7) TZP,4,6,25) W2C,22) and
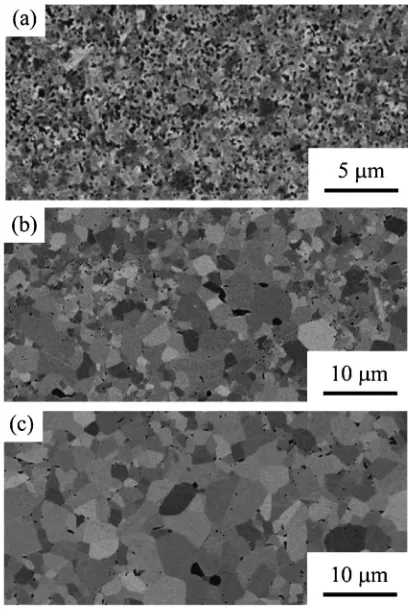
ZrO2-toughened mullite.6) In metallic materials, specimen surfaces elastically and then plastically deform during indentation tests. However, because these refractory carbides are brittle, specimen surfaces elastically deform and then fracture during indentation tests. The plastic deformation must be negligible in the tests. According to the PSR model, the ISE results from the elastic resistance as described in the section 3.3. Figure 4 shows the backscattered electron micrographs of the tungsten carbides. These tungsten carbides have no preferential texture. The average grain size was 0.43mmfor (a), 1.4mmfor (b) and 2.5mmfor (c). For polycrystalline ceramics, smaller grain sizes give higher hardness values, according to a Hall-Petch-like relationship, which has been generally observed in ceramics.29) The
Vickers hardness of WC with different average grain sizes was also measured as a function of test force. As shown in Fig. 5, the Vickers hardness increased with decreasing test force for every WC grain size. Specimens with smaller WC grain sizes had higher hardness values compared to specimens with larger grain sizes.
Fig. 2 Variation of Vickers hardness as a function of the test force for TiC, V8C7, and W2C.
Fig. 3 Variation of Vickers hardness as a function of the test force for WC, WC–15 mol% SiC, and ZrC.
[image:3.595.65.270.69.273.2] [image:3.595.323.527.71.377.2] [image:3.595.64.274.322.527.2]3.3 Application of the PSR model
Li and Bradt proposed the PSR model to explain the ISE on microhardness.7) In the model, they considered that the
effective test force is the applied test force minus the specimen resistance, which is linearly proportional to the indentation size. The PSR model can be expressed as
P¼a1dþa2d2 ð1Þ
where a1 is a constant, a2 is the Kick’s law coefficient8) related to the test-force-independent hardness, and d is the indentation size. The terma2d2, which equalsPminusa1d, represents the effective indentation test force. In order to analyze hardness data measured at various test forces, eq. (1) can be rearranged as
P
d2 ¼ a1
d þa2: ð2Þ
Vickers hardness is defined by
HV¼1:854 P
d2: ð3Þ
When infinite test force is applied,
HVðP¼ 1Þ ¼1:854a2: ð4Þ
Equation (2) shows that the terms a1 and a2 can be evaluated by linear regression plots of Pd2 versus d1. Figures 6, 7, and 8 show Pd2 versus d1 plots for B4C, Mo2C, NbC, TiC, VC, W2C, WC, WC–15 mol% SiC, and ZrC. The correlation coefficients calculated for the carbides were higher than 0.96. These results indicate that the test force dependence on hardness can be explained by the PSR model for the carbides. The slope and the intercept of a line correspond to thea1 and thea2values, respectively. Thea1 and a2 values obtained from the experimental results for the carbides are summarized in Table 3. Figure 9 shows the Fig. 6 Pd2versusd1for B
4C, Mo2C, and NbC.
Fig. 7 Pd2versusd1for TiC, V
8C7, and W2C.
Fig. 8 Pd2versusd1for WC, WC–15 mol% SiC, and ZrC.
[image:4.595.64.275.64.276.2] [image:4.595.323.529.72.276.2] [image:4.595.323.528.321.528.2] [image:4.595.65.273.331.542.2]relation between the hardness at an infinite test force, at a test force of 0.49 N and at a test force of 9.8 N (JIS). The hardness at a test force of 9.8 N was linearly proportional to the hardness at an infinite test force. The physical meaning of the hardness at an infinite test force is not clear, but the hardness is unambiguously determined for the material. The hardness at a test force of 9.8 N was exactly reflected the hardness at an infinite test force. However, the hardness at a test force of 0.49 N a little poorly reflected the hardness at an infinite test force. The hardness at low test forces must be corrected using thea1value in comparing it with the hardness at a test force of 9.8 N.
3.4 Estimation of hardness at any test force
Li and Bradt7)reported that the terma
1d is similar to the elastic resistance of a spring, anda1 is related to an elastic component of the specimen. However, they pointed out that thea1term includes not only an elastic component, but also a friction component at the indenter facet-specimen interface. We considered the contribution of friction between a speci-men surface and an indenter during an indentation test. Figure 10 represents the distribution of forces in a hardness test, where Pis the test force,P0is the decrease of the test force by the friction resistance, Pt is the true indentation
force,F is the pushing force perpendicular to the specimen surface, and A is the friction resistance force between the
indenter and the specimen surface. The friction resistance force is expressed as
A¼F; ð5Þ
where is the friction coefficient. The decrease in the test force by the friction is given by
P0¼Acos¼Fcos: ð6Þ
The true indentation force, which is actually applied on the specimen surface, equals the test force,P, minus the friction resistance,P0:
Pt¼PP0¼PFcos¼PPsincos: ð7Þ
Finally, the true indentation force is given by Pt¼Pð1sincosÞ
¼P 11
2sin 2
¼Pð10:35Þ ð¼68Þ: ð8Þ
[image:5.595.348.503.68.199.2]This equation indicates that the true indentation force decreases at a constant rate with respect to the test force, i.e., the true test force is not influenced by the indentation size. Therefore, the a1 term must be a constant due to the elastic contribution only.
Figure 11 shows the relationship between thea1value and Young’s modulus for the carbides. The correlation coefficient Fig. 9 Relation between the hardness at an infinite test force, at a test force
[image:5.595.46.291.84.233.2]of 0.49 N and at a test force of 9.8 N.
[image:5.595.76.259.132.416.2]Fig. 10 Schematic illustration of the distribution of forces during a Vickers hardness test.
Fig. 11 Correlation between thea1 term and Young’s modulus for the
carbides. Table 3 a1anda2values of the PSR model for the carbides.
carbide a1(104Nm1) a2(GPa)
B4C 3.29 14.3
Mo2C 1.33 8.03
NbC 2.09 7.67
TiC 3.22 10.4
VC 2.32 9.67
W2C 1.81 9.08
WC (0.43mm) 1.57 13.4
WC (1.4mm) 1.66 10.1
WC (2.5mm) 1.68 9.23
WC–15 mol% SiC 1.97 11.3
[image:5.595.343.511.256.422.2] [image:5.595.88.249.262.425.2]of the a1 value versus Young’s modulus plots was low: r¼0:45. The similar correlation was seen in other elastic moduli. The ISE of substances over a much wider elastic modulus range needs to be examined to clarify the elastic effect on thea1 value. The ISE of the refractory carbides in the present study conformed closely to the PSR model. In the model, the resistance to the elastic deformation corresponds to the a1d term. In the hardness measurement, the d does not correspond to an elastically-deformed part. The d was represented by the combination ofdefor elastically-deformed
part anddf for a fractured part. The true resistance for the
elastic deformation is proportional toa0
1de, wherea01 is the constant. Hence, the de should be proportional to the d
becausea1d equals toa01de. It is difficult to naively correlate
thea1term with the elastic moduli because the proportion of the deto the d can not be evaluated. The fractureability of
materials is influenced by not only the Young’s modulus but also the microstructure.
4. Conclusion
The test force dependence of the Vickers hardness for B4C, Mo2C, NbC, TiC, V8C7, W2C, WC, WC–15 mol% SiC, and ZrC was investigated. The proportional specimen resistance model was applied to measured hardness changes in the carbides, and the applicability of the model to the tested carbides was discussed. Several conclusions were made based on the results, as stated below.
The Vickers hardness of the carbides was greatly increased with decreasing test force. The carbides had unique test force effects. The test force dependence of the hardness observed for the carbides agreed well with the proportional specimen resistance (PSR) model. It was not clear what type of modulus related strongly to thea1term. The hardness at a test force of 9.8 N was linearly proportional to the hardness at an infinite test force. However, the hardness at a test force of 0.49 N a little poorly reflected the hardness at an infinite test force. The hardness at low test forces must be corrected using thea1value in comparing it with the hardness at a test force of 9.8 N.
REFERENCES
1) A. Mani, P. Aubert, F. Mercier, H. Khodja, C. Berthier and P. Houdy: Surf. Coat. Technol.194(2005) 190–195.
2) E. Pascual, E. Martı`nez, J. Esteve and A. Lousa: Diamond Relat. Mater. 8(1999) 402–405.
3) C. Hays and E. G. Kendall: Metall.6(1973) 275–282.
4) Z. Peng, J. Gong and H. Miao: J. Eur. Ceram. Soc.24(2004) 2193– 2201.
5) D. J. Clinton and R. Morrell: Mater. Chem. Phys.17(1987) 461–473. 6) J. Gong, J. Wu and Z. Guan: J. Eur. Ceram. Soc.19(1999) 2625–2631. 7) H. Li and R. C. Bradt: J. Mater. Sci.28(1993) 917–926.
8) H. Li and R. C. Bradt: Diamond Relat. Mater.1(1992) 1161–1167. 9) U. Ko¨lemen: J. Alloy. Compd.425(2006) 429–435.
10) L. E. Toth:Transition Metal Carbides and Nitrides, (Academic, New York, 1971).
11) R. S. Liebling: Mat. Res. Bull.2(1967) 1035–1039.
12) I. N. Frantsvich, E. A. Zhurakovskii and A. B. Lyashchenko: Inorg. Mater.3(1967) 6–12.
13) V. S. Neshpor and G. V. Samsonov: Fiz. Met. Metalloved.4(1957) 181–182.
14) C. Kral, W. Lengauer, D. Rafaja and P. Ettmayer: J. Alloy. Compd.265 (1998) 215–233.
15) A. T. Santhanam:Transition Metal Carbides and Nitrides, S. T. Oyama (Ed.), (Blackie Acad. And Prof., London, 1996) Chap. 2, p. 29. 16) P. T. B. Shaffer: Plenum Press Handbook of High Temperature
Materials, (Materials Index Plenum Press, New York, 1964) No. 1. 17) P. Ettmayer and W. Lengauer:Carbides, Encyclopedia of Inorganic
Chemistry, (Wiley, New York, 1994) pp. 519–531.
18) S. T. Oyama:Transition Metal Carbides and Nitrides, S. T. Oyama (Ed.), (Blackie Acad. And Prof., London, 1996) Chap. 1, p. 9. 19) C. K. Jun and P. T. B. Shaffer: J. Less-Common Metals23(1971) 367–
373.
20) A. P. Miodownik: Mater. Sci. Technol.10(1994) 190–192. 21) R. H. J. Hannink and M. J. Murray: J. Mater. Sci.9(1974) 223–228. 22) H. Taimatsu, S. Sugiyama and Y. Kodaira: Mater. Trans.49(2008)
1256–1261.
23) M. Asmani, C. Kermel, A. Leriche and M. Ourak: J. Euro Ceram. Soc. 21(2001) 1081–1086.
24) S. Sugiyama and H. Taimatsu: J. Euro Ceram. Soc.24(2004) 871–876. 25) J. Gong and Z. Guan: Mater. Lett.47(2001) 140–144.
26) K. Sangwal, B. Surowska and P. Błaziak: Mater. Chem. Phys. 77 (2002) 511–520.
27) R. Riedel: Handbook of Ceramic Hard Materials, vol. 1, (WILEY-VCH, Weinheim, 2000) p. 190.
28) H. Li and R. C. Bradt: J. Non Cryst. Solids146(1992) 197–212. 29) R. W. Rice, C. Cm. Wu and F. Borchelt: J. Am. Ceram. Soc.77(1994)