Modeling Temperature Gradient Evolution of CoSb
3Material
for Thermoelectric Devices during Spark Plasma Sintering
Yanhong Cai
1, Degang Zhao
1;2, Xueying Zhao
1,
Lidong Chen
1, Wan Jiang
1;*and Pengcheng Zhai
31State key Laboratory of High Performance Ceramics and Superfine Microstructures,
Shanghai Institute of Ceramics, Chinese Academy of Sciences, Shanghai 200050, P.R.China
2Graduate School of Chinese Academy of Sciences, 19 Yuquan Road, Beijing 100049, P.R.China
3Department of Engineering Structure and Mechanics, Wuhan University of Technology, Wuhan 430070, P.R.China
The temperature distribution and evolution of Mo/Ti/CoSb3materials used as thermoelectric couples of devices during spark plasma sintering were simulated by finite element method, and the results agree well with the die interior temperature measured by thermocouple. The sample and punches have higher temperature in whole sintering process, the highest temperature region is existed in CoSb3region, and the radial temperature gradient in CoSb3region is obvious. It was confirmed by experiments that the temperature gradient in sample results in non-uniform microstructure and thermal conductivity difference. The temperature gradient increases with decreasing thermal conductivity and increasing electrical resistivity of CoSb3-based compound, from the point of view of the thermal conductivity and electrical resistivity, respectively, the optimization method of the combined mechanical property and thermoelectric property of CoSb3-based compound was proposed.
[doi:10.2320/matertrans.MRA2008203]
(Received July 3, 2008; Accepted January 13, 2009; Published March 4, 2009)
Keywords: temperature distribution, finite element method, thermoelectric material, spark plasma sintering, microstructure
1. Introduction
Spark plasma sintering (SPS) technique, also known as field activated sintering, employs pulsed direct current (DC) passing through a graphite die containing the sample to intensify sintering, the samples are sintered by Joule’s heat generated in the sintered material and transferred from the graphite dies and punches. In the SPS process, the pulsed electric current flows through the sintered conduction material, and generates spark plasma at particle contacts, which creates a local high-temperature state for an extremely short time and causes evaporation of the powder surface, leading to the formation of the necks. However, the high-temperature state is localized on the surface of particles, and the neck can then be cooled due to thermal diffusion during the off state of the pulse. By applying the repeated on-off current, the local high-temperature field moves throughout the sample, and the temperature within particles tends to become uniform, the temperature gradients in sample significantly decrease. The general advantages of field assisted sintering, compared to traditional hot pressing or hot isostatic pressing are lower sintering temperature, shorter processing time, and higher heating rates thereby minimizing grain growth, which improves material property to a certain extent.1–3) Although these characteristics brought growing
interest and widespread use of SPS technique, further research indicated that high heating rates, especially in combination with short dwell times, could cause temperature gradients in sample, and subsequently sintering inhomoge-neity led to non-uniform microstructure, including grain size, etc, finally might appear mechanical properties difference in the sintered sample. Therefore, the temperature field within the sample during SPS process should be understood and
controlled to the best of our abilities.4,5)Recently, there have been some works in simulating temperature distribution of sample during SPS process, including conducting and insulating materials.1,4,6,7) However, for semi-conducting material used as thermoelectric (TE) devices, the thermo-electric property is sensitive to temperature, and mechanical property is relevant with temperature distribution in sample, thus it is necessary to study the temperature distribution and evolution of semi-conducting material during Spark Plasma Sintering.
TE devices have attracted a great deal of attention because of their application in solid state power generation using exhaust or waste heat sources.8)Efficiency of TE device is
highly dependent on the figure of merit of the TE material and temperature difference across the device. Recently CoSb3-based skutterudite compound is regarded as one of
the most promising materials to construct TE device working at intermediate temperature region (500–800C), because of its relatively low thermal conductivity and high electrical conductivity.9,10) However, as the key technology for fabricating TE device, the joining of metal electrode and CoSb3 material is still a difficult problem. Nowadays,
molybdenum (Mo) disk is chosen as electrodes due to its high electrical conductivity and thermal conductivity, and thermal expansion coefficient closing to that of CoSb3.10)
And considering the difference in order of magnitude of thermal conductivity and electrical conductivity between CoSb3 and Mo, Ti is applied as the transition layer since its
thermal conductivity and electrical conductivity are inter-mediate between those of CoSb3and Mo. CoSb3powder, Ti
powder and Mo disk electrode have been simultaneously sintered by SPS technique, in which the uniform temperature distribution is important for uniform microstructure and mechanical properties of Mo/Ti/CoSb3sample for the
long-term use in power generation. However, there are few reports
on the details of the temperature distribution in electrode and CoSb3-based thermoelectric materials during sintering
proc-ess.
To the best of our knowledge, the temperature is generally tested by focusing a pyrometer or infrared thermometer on the outer die wall surface during SPS process, but it could not give the real temperature distribution in sample, the most effective way to find this out might be numerical simulation.4)
In the present study, we prepared Mo/Ti/CoSb3samples by
SPS technique, and simulated the temperature distribution of sample during sintering with finite element method, observed the microstructures in CoSb3region using scanning electron
microscope (SEM), and measured the thermal conductivity in CoSb3 region by laser flash method. Furthermore, we
discussed how to optimize the properties of CoSb3-based
compound from the point of view of the thermal conductivity and the electrical resistivity, respectively.
2. Experimental Procedure
One-step sintering experiments of Mo/Ti/CoSb3materials
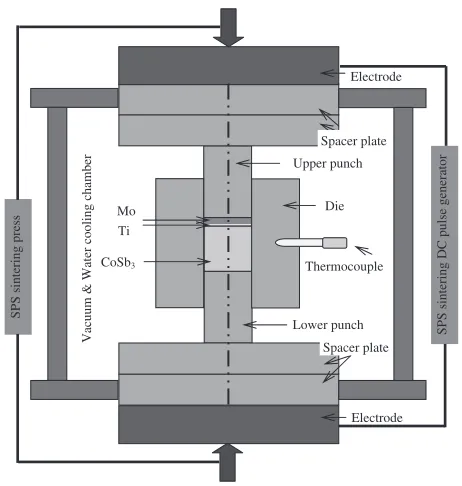
were carried out using SPS apparatus (SPS-2040, Sumitomo Coal Mining Co., Tokyo, Japan), and the schematic of the SPS apparatus was showed in Fig. 1. In order to produce a present time-temperature profile during sintering, power is controlled through the application of voltage difference on the ends of top and bottom electrode plates, and the pulse current flows into top electrode plate, through upper spacer plate, upper punch, graphite die (Shanghai Toyo Tanso Company Limited, Japan) set that contains the sample, lower punch, and then flows out from bottom electrode plate of the apparatus. Meanwhile, the thermocouple is located in half-way point between the interior and exterior wall of the graphite die where was drilled hole for temperature monitor-ing.
During SPS process, using a pulse current of 12 ms on and 2 ms off, and the pulsed current value at different sintering stages were given in Table 1. Mo/Ti/CoSb3 materials were
loaded into the graphite die of 10 mm inner diameter and punch unit, the uniaxial pressure applied on the upper spacer plate were kept constant at each minutes, and the pressure at different sintering stages were showed in Table 2. Heat was generated while electrical current flowing through all components of SPS apparatus, the temperature showed in the thermocouple increased from 35.6C to 590C in 5 mins,
and the holding time was 10 mins at 590C before turning off
the power and removing the pressure. Finally, the disk shaped Mo/Ti/CoSb3 multi-layer sample was simultaneously
pre-pared by one-step SPS sintering process in a vacuum.
3. Theoretical Model
Joule heating occurs when a pulse DC flowing through the sintering system and the heat generation causes temperature change of the material. Owing to the thermal property and the electrical property of the material being dependent on temperature, the variable material properties would influence the thermal and electrical transfer during the sintering process. Therefore, the theoretical model is transient and thermal-electrical coupling, and the governing equations based on Ohm’s and Fourier’s laws for electrical and thermal analyses can be written as following eqs. (1) and (2), respectively
r2=e¼0 ð1Þ
Whereis voltage,eis electrical resistivity.
CP@T @t kr
2T ¼qq_ ð2Þ
Where , CP, T, k and qq_ represent density, specific heat, temperature, heat conductivity and amount of heat generation per second,qq_¼ jrj2=e.
Boundary and initial conditions are established for the governing equations, and the boundary conditions for the electrostatic potential are as follows
Upper punch
Lower punch Die
Thermocouple CoSb3
Ti Mo
Spacer plate
Spacer plate Electrode
Electrode
Vacuum & Water cooling chamber SPS sintering DC pulse generator
SPS sintering press
[image:2.595.49.547.84.110.2]Fig. 1 Schematic of the SPS apparatus. Table 1 Peak value of pulsed current vs. time during SPS process.
Time (sec) 0–60 60–120 120–180 180–240 240–300 300–900 900–1500
[image:2.595.51.547.148.175.2]Current peak value (A) 50 100 150 200 250 181.5 0
Table 2 Pressure vs. time during SPS process.
Time (sec) 0–60 60–120 120–180 180–240 240–300 300–900 900–1500
[image:2.595.311.542.201.444.2]¼0 at the top electrode ð3aÞ
¼0 at the bottom electrode ð3bÞ
@=@r¼0at the outer surface of the die ð3cÞ
The SPS process takes place in vacuum, so heat loses mainly by radiation from all the lateral surfaces towards surrounding environment, especially at high temperature; and there is heat loss by convection towards water cooled electrodes.
The heat transfer by radiation can be determined by Stefan-Boltzmann law
_
q
qr¼s" ðTe4T 4
sÞ ð4aÞ
with qqr_, the heat loss per unit time per unit surface, s, Stefan-Boltzmann constant,", the emissivity,Te, the temper-ature of emitting surface,Ts, the temperature of surrounding environment.
In the present case, the heat transfer was modeled as a convective heat transfer due to the contact of the spacer plates with the water cooled electrodes. Convection can be described by
_
q
qc¼h ðTpTwÞ ð4bÞ
withTp,Twandhare the temperature of the spacer plates near the contact surfaces, the temperature of the cooling water and the convection coefficient, respectively.1,6,11,12)
4. Finite Element Simulation
In view of the symmetry, two-dimensional modeling was adopted in the simulation, and thermal-electrical coupling elements were employed due to the relatively high depend-ence of thermal and electrical properties on the temperature. Because thermal conductivity and electrical conductivity of the powder could not be measured exactly at present, the thermal conductivity and electrical conductivity of CoSb3
and Ti in solid state were used. But the variation of thermal conductivity and electrical conductivity with temperature during sintering was considered and the effect of thermal conductivity and electrical conductivity on temperature distribution in sample was discussed in details, so although the densification process was not treated like it was, yet could be reflected at a certain extent. The graphite was also treated as isotropic in the model due to the measured properties of graphite using as die, punches and spacer plates being quite uniform. Despite this simplification, the results serve to shed light on the important consequences of temperature distribu-tions in the SPS process.6)A schematic of the spark plasma
sintering apparatus used in the experiments and simulation was shown in Table 3.
The reliable material property parameters dependent on temperature in the simulation were measured. The electrical resistivity of CoSb3, Ti, Mo and graphite was measured by
standard DC four-probe method in a flowing Ar atmosphere. The thermal conductivity of CoSb3, Ti, Mo and graphite were
measured by laser flash method (Netzsch, LFA427). The density of material at several temperatures was calculated using the thermal expansion coefficient measured by Neztsch DIL 402C. The specific heat of CoSb3 and graphite was
measured by ASTM E1269-05 (PE DSC-2C), and the specific
heat of Mo and Ti only slightly depends on temperature, therefore a constant value was used during simulation. Thermal conductivity, electrical resistivity, specific heat and density applied in the simulation were listed in appendix.
The contact interface existed between the spacer plates, the punch and the spacer plate, and two thin graphite papers were placed on the top and bottom surface of the sample respectively to prevent possible contamination to the punch-es, similarly, one graphite paper was set between the sample and the die, thus the thermal and electrical properties are discontinuous at the interface, and the contact electrical resistance and thermal resistance between all contact inter-face should be taken into account.1,4) By measuring the electrical resistance of the two-layer graphite papers and the electrical resistance of the sample, respectively, and the total electrical resistance of two-layer graphite papers and sample under the same pressure as the experiments, the contact resistance between graphite paper and sample was obtained, and the contact resistance between punch and graphite paper could be know by the same way, so the resistance of two graphite papers and corresponding contact interface could be obtained and used as resistance of the horizontal graphite papers in simulation for simplification. The electrical resistivity of the horizontal graphite papers was determinded by the relationship of resistance and resistivity, and supposed the variation of electrical resistivity with temperature is same as graphite. The thermal conductivity of horizontal graphite papers in simulation could be calculated as the method of literature 1), and it was assumed to be inversely proportional to the electrical resistivity,P¼grgr=P, where and
are the thermal conductivity and electrical resistivity respec-tively, p and gr denote the horizontal graphite papers and graphite,is a fitting coefficient and was supposed to be 1.2. The electrical resistivity and thermal conductivity of vertical graphite papers used as simulation were acquired by similar manner. The specific heat and density of the graphite papers were taken to be same as that of the graphite. The electrical resistivity between the spacer plates, the punch and the spacer plate were derived from matching experiments with simu-lations, corresponding thermal conductivity could be calcu-lated as the above method, and specific heat and density were taken to be similar to that of graphite. Fanet al.10)indicated that the intermediate layers formed around the interface of Mo/Ti/CoSb3sample did not bring any electrically resistive
[image:3.595.306.550.92.219.2]layers. The interfacial resistance in the present sample was
Table 3 The scale specifications of SPS Components and material in Fig. 1.
Scale of SPS components and material
Outer diameter/inner diameter/thickness
CoSb3 Outer diameter: 10 mm; thickness: 8 mm Ti Outer diameter: 10 mm; thickness: 200mm Mo Outer diameter: 10 mm; thickness: 1.2 mm Upper/Lower
punch (graphite) Outer diameter: 10 mm; thickness: 20 mm
Die (graphite) Outer diameter: 30 mm; inner diameter: 10 mm thickness: 30 mm
minimized, thus the contact resistance in the interface between CoSb3 and Ti, Ti and Mo were ignored. All the
contact electrical resistivity and thermal conductivity were also given in the appendix. Although the contact electrical resistivity and thermal conductivity could not quite accu-rately reflect the physical circumstances, it can shed consid-erable light on the material parameters at the contact zone during the simulation process of temperature.
In the simulation, the initial temperature of the whole system was set to be 35.6C, the boundary temperature at the
top, bottom water-cooled electrodes and surrounding envi-ronment were kept at a constant temperature of 35.6C
according to the actual temperature in experiments. Uniform pressures showed in Table 2 were applied on the top boundary, and zero vertical displacements were assumed for the bottom boundary. Although these boundary condi-tions do not exactly reflect the actual experimental con-ditions, they are considered appropriate approximations. The emissivity of graphite only slightly depends on temperature and was taken to be 0.8, and the convection coefficient was 880 W/(m.K), in agreement with literature data.1)
5. Results and Discussion
The temperature distributions of Mo/Ti/CoSb3 sample
[image:4.595.307.550.72.254.2]during spark plasma sintering were simulated using the theoretical model and experimental data mentioned above.
Figure 2 shows the measured and simulated temperatures at the halfway point of graphite die wall during sintering and holding stages. The simulated temperatures are slightly lower than the measured temperatures in the front two minutes of sintering, after that, the simulated and measured temperatures agreed very well. The reason for this phenomenon could be that the parameters of CoSb3and Ti bulk material instead of
that of powder were used in simulation. Actually, in the early stage of sintering, powder particles were packed loosely, little contact surface between particles led to high electrical resistivity, and then more heat was generated during this stage. Subsequently the pulse current caused a spark discharge between particles of the powder and induced the formation of the necks by volume diffusion through the contact points of adjacent powder particles,3)with the partial
contact surfaces vanishing, the electrical resistivity of CoSb3
[image:4.595.313.542.305.456.2]and Ti gradually decreased and closed to that of bulk material, the measured temperatures fit well with the simu-lated temperatures. It could be inferred that the simusimu-lated temperatures may mirror true temperatures during the later stages of sintering.
Figure 3 shows the temperature distribution in the spacer plates/punches/sample/die system at sintering 120 seconds, the highest temperature region in the system concentrated on the punches and the sample due to high current density in punches, and high electrical resistivity in the sample, particularly the influence of the contact resistance around the sample. From above analysis, it is known that the measured temperature by thermocouple set in die wall is lower than that of sample. Thus, the measured temperature could not reflect actual temperature in the sample. Therefore, it is confirmed again that it is necessary to simulate the temperature distribution of the sample during SPS process.
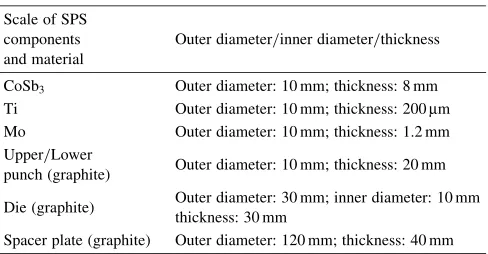
Generally, we more concern about the temperature in the sample during sintering. Figure 4 illustrates the temperature distribution at sintering 120 and 240 seconds, respectively. As displayed in Fig. 4, the temperature and temperature gradient increased with increasing sintering time, the highest temperature in sample from 168.28C at 120 seconds
Sintering and Holding Time, t/s
Temperature,
T
/
°
C
Fig. 2 The measured and simulated temperatures in the center of graphite die wall during sintering and holding time.
Fig. 3 Temperature in the spacer plates/punches/sample/die system at sintering 120 seconds T/C.
CoSb3 Mo
Ti
(a) Mo
Ti
CoSb3
(b)
8mm 1.2mm 0.2mm
5mm 5mm
[image:4.595.62.275.596.758.2]increased to 485.71C at 240 seconds, and the temperature
gradient increased from 7.05C at 120 seconds to 33.98C at
240 seconds. It is also noted that the temperature in central region of the sample was higher than that of the borders due to heat loss by radiation from the border surfaces of sintering system. The radial temperature gradient in CoSb3
was higher than that of Mo and Ti, and the reason may be that the lower thermal conductivity of CoSb3 led to slower
thermal diffusion. The highest temperature in the Mo/Ti/ CoSb3 sample was existed in CoSb3 region, which could be
explained that more heat was produced in CoSb3 region
while current flowing through the sample attributing to the greater electrical resistivity of CoSb3.
Although binary CoSb3 exhibits good electrical transport
properties, but the ZT value is not very high for the relatively high thermal conductivity. In order to enhance the thermo-electric property, doping and/or filling are performed.13–18)
By inserting filler atom such as rare-earth or alkaline earth atom into Sb-icosahedron voids of the binary CoSb3; the
lattice thermal conductivity was reduced greatly due to rattling of filler atoms around their equilibrium positions, and efficiently scattering the phonons. The filler atoms also significantly affect electrical transport properties such as carrier concentration and mobility by Wiedemann-Franz law. On the other hand, doping was also reported to reduce lattice thermal conductivity as well as control carrier concentration considerably. The substitution for Co or Sb by dopants can influence the electronic structure, increase carrier concen-tration and electric conductivity of the material. Furthermore, the increase of content of dopant can be very effective in reducing lattice thermal conductivity due to enhanced scattering of phonons on impurities. And hot junction of TE devices studied serves at moderate temperature in long-term state, thus it is necessary to study the effect of the thermal conductivity and the electrical resistivity of CoSb3
-based compound on temperature gradient in the sample during holding time.
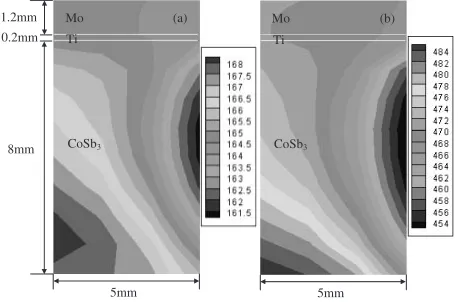
Figure 5 depicts temperature gradient variation in Mo/Ti/ CoSb3 sample with thermal conductivity of CoSb3-based
compound at the final stage of holding time, where k, the thermal conductivity of pure CoSb3 being dependent on
temperature, listing in Table A·1 of appendix. The temper-ature gradient in sample acquired from calculation was 22.38C shown in Fig. 5(a), 16.29C shown in Fig. 5(b) and
12.94C shown in Fig. 5(c), respectively, and it could be
concluded that the lower the thermal conductivity of CoSb3
-based compound, the greater the temperature gradient in sample. Actually, owing to the thermal conductivity of CoSb3 in solid state used in the simulation instead of that of
powders, the true temperature gradient in CoSb3 region
should slightly higher than the above results. For thermo-electric material, the heat is carried mainly by phonons, charge carriers and photons, otherwise the TE devices are usually used at low and moderate temperature, and thus the contribution of photons might be ignored.19) In order to
enhance the thermoelectric property, by doping and/or filling, the thermal conductivity of TE material could be reduced due to the coupling effect of electron–phonon scattering.14) As a result, slower thermal diffusion may
induce greater temperature gradient in sample.
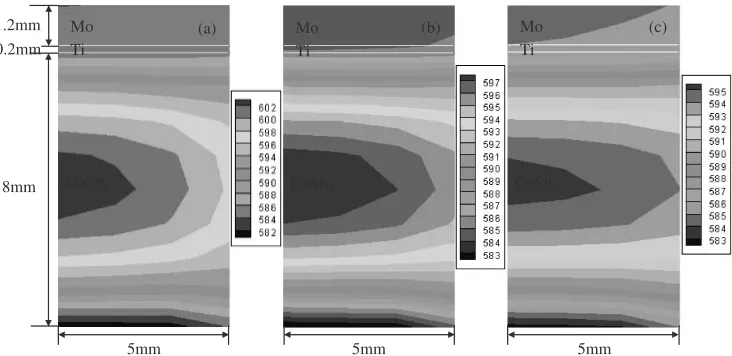
Figure 6 depicts the temperature gradient variation in Mo/Ti/CoSb3 sample with electrical resistivity of CoSb3
-based compound at the final stage of holding time, wheree, the electrical resistivity of pure CoSb3 being dependent on
temperature, listing in Table A·2 of appendix. The temper-ature gradient in sample acquired from calculation was 9.13C shown in Fig. 6(a), 11.42C shown in Fig. 6(b) and 12.94C shown in Fig. 6(c), respectively. It could be
concluded that the lower the electrical resistivity of CoSb3
-based compound, the smaller the temperature gradient in sample. In the microscopic theory, the electrical resistivity is determined by the contribution of each of charge carrier with its concentration, effective mass and relaxation time. The electrical resistivity decreases while carrier concentration increase, and the impact of the effective mass and relaxation time on the electrical resistivity is generally weak under the conditions of no temperature change and strong external influence.19) Hence by doping and/or filling, the carrier concentration increases and the electrical resistivity decreas-es, further by Wiedemann-Franz law, the thermal conduc-tivity increases, and using the above analysis about Fig. 5, the temperature gradient in sample decreases.
Mo Ti
CoSb3
(a) Mo Ti
CoSb3
Mo Ti
CoSb3
(b) (c)
5mm 5mm 5mm
8mm 1.2mm
0.2mm
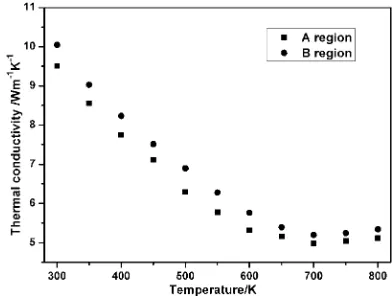
[image:5.595.116.482.71.249.2]The dependence of temperature in the sample on the microstructure of CoSb3 was investigated by SEM. The
surface micrographs of different temperature regions in CoSb3 were shown in Fig. 7, and it can be seen that the
average grain size in A region is slightly smaller than that of B region, which could be explained by grain growth kinetics theory that the higher the temperature, the faster the growth speed of grain. Furthermore, the mechanical property may be influenced by the non-uniform microstructure, based on hall-petch formula, the smaller the grain size, the better the strength, so fine grain size could enhance the strength of material, as mentioned in literature 20). Additionally the thermal conductivity of A region and B region in CoSb3was
mesured by laser flash method (Netzsch, LFA427) and shown in Fig. 8, and the effect of microstructure on thermal conductivity of CoSb3 was analysed, the results indicated
that the thermal conductivity of CoSb3 descends with
decreasing average grain size. The reason may be intensified scattering of grains boundary to phonons reduced the lattice thermal conductivity greatly, the thermal conductivity was decreased and thermoelectric property may be enhanced. From above analysis, the temperature gradient in sample during sintering would influence mechanical property and thermoelectric property of CoSb3 material, so it should be
decreased to the best of our abilities.
Determining how to optimize the properties of CoSb3
-based compound is important for the Mo/Ti/CoSb3materials
used as TE couples. From the point of view of thermal conductivity, the mechanical property and thermoelectric property are two competing factors. The mechanical property could be non-uniform due to non-uniform microstructure induced by greater temperature gradient with a decrease in thermal conductivity. On the other hand, the thermoelectric
(c) (b)
(a) Mo
Ti
CoSb3
Mo Ti
CoSb3
Mo Ti
CoSb3 8mm
1.2mm
5mm 5mm 5mm
0.2mm
Fig. 6 Variation of temperature distribution in Mo/Ti/CoSb3sample with electrical resistivity of CoSb3-based compound at holding 600 seconds (a)0:5e(b)0:75e(c)eT/C.
Mo Ti
CoSb3
(a)
B region A region
(b) (c)
Fig. 7 Scanning electron microscope images of surface topography in CoSb3region of sample (a) the position of A region and B region in sample (b) A region image (c) B region image.
[image:6.595.116.483.72.247.2] [image:6.595.87.512.299.434.2] [image:6.595.327.523.490.638.2]property could be enhanced with decreasing thermal con-ductivity. Therefore, the thermal conductivity should be optimized appropriately by rational choice of dopant and/or filler atom and precise determination of doping and/or filling quantity to meet the requirement of material property used as TE devices. From the point of view of electrical resistivity, the mechanical property could be uniform due to relatively uniform microstructure induced by smaller temperature gradient with decreasing electrical resistivity. In addition, the lower electrical resistivity could improve thermoelectric property of CoSb3-based compound. Therefore, the low
electrical resistivity is beneficial to the improvement of both the mechanical and thermoelectric properties for material used as TE devices at a certain extent.
6. Conclusions
The temperature distribution and evolution of Mo/Ti/ CoSb3 materials used as thermoelectric couple of TE device
were simulated by finite element method, the microstructures in different temperature regions of CoSb3 were observed by
SEM, and the thermal conductivity in different temperature regions of CoSb3were measured by laser flash method. In the
end, the optimization of CoSb3-based compound properties
was discussed in details. The main points of the present study are as follows:
(1) The simulation agree well with the available exper-imental data, such as the die interior temperature measured by thermocouple during sintering process. The sample and punches have the higher temperature in the whole sintering process, in which the highest temperature existed in CoSb3
region, and the radial temperature gradient of CoSb3 is
obvious.
(2) The temperature gradient in sample results in non-uniform microstructure and thermal conductivity difference, which may further influence the mechanical property and thermoelectric property of CoSb3, so the temperature gradient
in sintering should be decreased to the best of our abilities, for example, the graphite die is surrounded by insulation carbon felt to minimize heat losses and reduce temperature gradient. (3) The temperature gradient increases with decreasing thermal conductivity and increasing electrical resistivity of CoSb3-based compound. And the thermal conductivity of
CoSb3-based compound should be rationally optimized and
the electrical resistivity of CoSb3-based compound should be
decreased at a certain extent to improve simultaneously the mechanical property and thermoelectric property of CoSb3
material used as TE device.
In this study, the qualitative analysis about the effect of temperature gradient on the combined thermoelectric prop-erty and mechanical propprop-erty of material used as TE devices was done, and the quantitative study about the effect of temperature gradient on material strength, seebeck coeffi-cient, and etc. is required in the future research work.
Acknowledgements
The present study was supported by Natural Sciences Foundation of China (No. 50625414, 50821004), Program of Shanghai Subject Chief Scientist (No. 08XD14046), and National Basic Research Program of China (No. 2007CB607505).
REFERENCES
1) K. Vanmeensel, A. Laptev, J. Hennicke, J. Vleugels and O. Van der Biest: Acta Mater.53(2005) 4379–4388.
2) K. A. Khor, L. G. Yu, O. Andersen and G. Stephani: Mater. Sci. Eng. A 356(2003) 130–135.
3) E. Fleury, J. H. Lee, S. H. Kim, W. T. Kim, J. S. Kim and D. H. Kim: Metall. Mater. Trans. A34(2003) 841–849.
4) A. Zavaliangos, J. Zhang, M. Krammer and J. R. Groza: Mater. Sci. Eng. A379(2004) 218–228.
5) W. Yucheng and F. Zhengyi: Mater. Sci. Eng. B90(2002) 34–37. 6) X. Wang, S. R. Casolco, G. Xu and J. E. Garay: Acta Mater.55(2007)
3611–3622.
7) U. Anselmi-Tamburini, S. Gennari, J. E. Garay and Z. A. Munir: Mater. Sci. Eng. A394(2005) 139–148.
8) F. J. DiSalvo: Science285(1999) 703–706.
9) S. Furuyama, T. Iida, S. Matsui, M. Akasaka, K. Nishio and Y. Takanashi: J. Alloy. Compd.415(2006) 251–256.
10) J. Fan, L. Chen, S. Bai and X. Shi: Mater. Lett.58(2004) 3876–3878. 11) E. M. Heian, A. Feng and Z. A. Munir: Acta Mater.50(2002) 3331–
3346.
12) K. Matsugi, H. Kuramoto, T. Hatayama and O. Yanagisawa: J. Mater. Process. Technol.146(2004) 274–281.
13) X. Y. Zhao, X. Shi, L. D. Chen, W. Q. Zhang, W. B. Zhang and Y. Z. Pei: J. Appl. Phys.99(2006) 053711.
14) L. Yang, J. S. Wu and L. T. Zhang: J. Alloy. Compd.375(2004) 114– 119.
15) A. Weidenkaff, R. Robert, M. Aguirre, L. Bocher, T. Lippert and S. Canulescu: Renewable Energy33(2008) 342–347.
16) G. Chen, M. S. Dresselhaus, G. Dresselhaus, J.-P. Fleurial and T. Caillat: Int. Mater. Rev.48(2003) 45–66.
17) K. T. Wojciechowski: Mater. Res. Bull.37(2002) 2023–2033. 18) S.-Chul Ur, J.-Chul Kwon and Il.-Ho Kim: J. Alloy. Compd.442(2007)
358–361.
19) L. I. Anatychuk:Physics of thermoelectricity, (Institute of Thermo-electricity Kyiv, Chernivtsi, 1998) pp. 172–177.
Appendix
Table A3 Variation of specific heat with temperature.
Material Specific heat (J/(kgK)) (30C–590C)
Mo CP¼258
Ti CP¼540
CoSb3
CP¼215:06147þ0:05089T4:84899105T22:80711108T3 þ9:935821011T41:631941013T5þ1:002181016T6
Graphite CP¼741:99409þ2:09018Tþ0:00858T
29:63946105T3
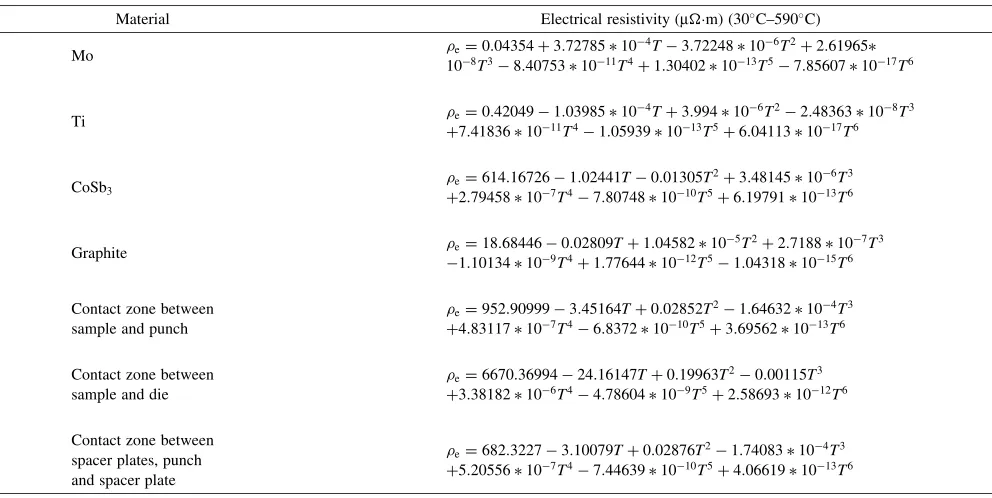
þ4:18839107T48:509811010T5þ6:544631013T6 Table A2 Variation of electrical resistivity with temperature.
Material Electrical resistivity (mm) (30C–590C)
Mo e¼0:04354þ3:7278510
4T3:72248106T2þ2:61965 108T38:407531011T4þ1:304021013T57:856071017T6
Ti e¼0:420491:0398510
4Tþ3:994106T22:48363108T3
þ7:418361011T41:059391013T5þ6:041131017T6
CoSb3
e¼614:167261:02441T0:01305T2þ3:48145106T3
þ2:79458107T47:807481010T5þ6:197911013T6
Graphite e¼18:684460:02809Tþ1:0458210
5T2þ2:7188107T3
1:10134109T4þ1:776441012T51:043181015T6
Contact zone between sample and punch
e¼952:909993:45164Tþ0:02852T21:64632104T3
þ4:83117107T46:83721010T5þ3:695621013T6
Contact zone between sample and die
e¼6670:3699424:16147Tþ0:19963T20:00115T3
þ3:38182106T44:78604109T5þ2:586931012T6
Contact zone between spacer plates, punch and spacer plate
e¼682:32273:10079Tþ0:02876T21:74083104T3
þ5:20556107T47:446391010T5þ4:066191013T6 Table A1 Variation of thermal conductivity with temperature.
Material Thermal conductivity (W/(mC)) (30C–590C)
Mo k¼149:253340:10275Tþ0:00111T
26:78401106T3
þ1:9908108T42:751931011T5þ1:437211014T6
Ti k¼25:182670:05532Tþ6:2992910
4T23:6199106T3
þ9:94248109T41:308891011T5þ6:624481015T6
CoSb3
k¼9:791940:01509T5:55976105T2þ4:4111107T3
1:40501109T4þ2:414941012T51:616591015T6
Graphite k¼147:938650:98518Tþ0:01158T
28:10465105T3
þ2:84086107T44:765171010T5þ3:068121013T6
Contact zone between sample and punch
k¼3:797720:03166Tþ3:9865104T22:71641106T3
þ9:29354109T41:526031011T5þ9:629291015T6
Contact zone between sample and die
k¼0:539430:00438Tþ5:51988105T23:79183107T3
þ1:30768109T42:162781012T5þ1:37391015T6
Contact zone between spacer plates, punch and spacer plate
k¼5:595740:05381Tþ6:98039104T24:64707106T3
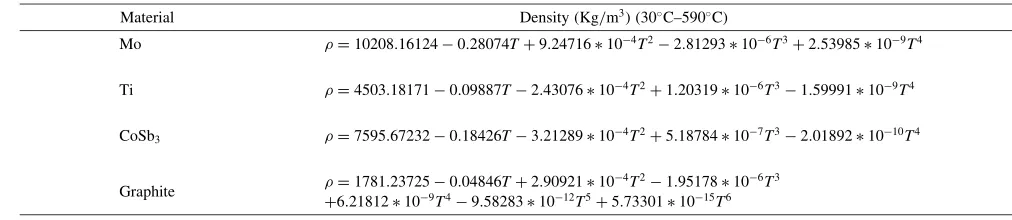
Table A4 Variation of density with temperature.
Material Density (Kg/m3) (30C–590C)
Mo ¼10208:161240:28074Tþ9:24716104T22:81293106T3þ2:53985109T4
Ti ¼4503:181710:09887T2:43076104T2þ1:20319106T31:59991109T4
CoSb3 ¼7595:672320:18426T3:21289104T2þ5:18784107T32:018921010T4
Graphite ¼1781:237250:04846Tþ2:9092110
4T21:95178106T3