Development of Model Materials for Physical Forming Simulation
of Metals and Alloys
*Satoru Kuwaharada
1, Kenji Nakanishi
2, Yuji Mure
1and Yasumichi Matsumoto
31Kagoshima Prefectural Institute of Industrial Technology, Kirishima 899-5105, Japan
2Department of Mechanical Engineering, Faculty of Engineering, Kagoshima University, Kagoshima 890-0065, Japan
3Department of Nano Science and Technology, Graduate School of Science and Technology, Kumamoto University,
Kumamoto 860-8555, Japan
In conjunction with experimental simulation of metal forming, the development of model materials, by which forming simulation can be carried out at a low stress level at room temperature, was performed. The model materials are mixtures of microcrystalline wax, rosin, mineral oil and powder. The flow curves of the model materials show three typical configurations, i.e., work-softening type, steady state deformation type and work-hardening type, which are observed in metals and alloys. The above configurations of the flow curves of the model materials could be changed and controlled by adjusting powder content. The flow curves of the model material could be predicted accurately using the work-hardening rate equation determined in this work. As an application example, experiments on and visio-plasticity analyses of the plane strain backward extrusion of magnesium alloy and its model material, which represent the deformation property of work-softening type materials, were carried out. We confirmed that the material flow and strain conditions in both materials correspond to each other with sufficient accuracy for engineering purpose. [doi:10.2320/matertrans.P-M2011814]
(Received November 8, 2010; Accepted April 19, 2011; Published June 22, 2011)
Keywords: backward extraction, experimental analysis, model simulation, flow curve, model material, magnesium alloy, plastic flow
1. Introduction
The simulation of metal forming is widely recognized and utilized as the technology to support the design of the metal forming process which related to deformation properties of material, die and tool configuration, processing temperature, processing speed and processing conditions, complicatedly. As is well known, the methods for simulating a metal forming process can be divided into two categories: (1) experimental (physical) simulation, in which the forming phenomenon is elucidated by carrying out an experiment and by analyzing the experimental results (visioplasticity analysis). (2) com-puter (logical) simulation, in which the forming phenomenon is expressed using a mathematical model with several equations (finite element method), which is solved by calculating the change in the parameter that represents the forming conditions. Since in experimental simulation, the deformation process of the product and its plastic flow are measured, it is an effective method for understanding a deformation process clearly when the friction condition between the working material and the die and tool and the deformation properties of the material are not known. Further, when oil clay or wax is used as a substitute material (model material) for the actual metallic material in the simulation, forming experiments on forging, extrusion, and rolling processes can be easily simulated at a low stress level and at room temperature. Moreover, experimental simula-tions using the model materials are convenient for
visual-ization analysis of plastic flow.1–5)Remark is that the model
material used in the simulation of metal forming processes must have deformation properties similar to those of the actual metallic material.
It is well known that a flow curve (a true stress–true strain curve measured by uniaxial compression test) that represents the deformation properties of a metallic material quantitatively is affected by the temperature and strain rate
in deformation process.6) The flow curve measured at
constant temperature and at constant strain rate shows work-hardening type of deformation in the temperature range between room temperature and warm-working tem-perature and steady state type or work-softening type of deformation in the temperature range corresponding to hot-working temperatures.
In the present investigation, we developed a model material that can exhibit all the three above-mentioned types of deformation at room temperature. This material was the wax clay in which the appropriate amount of powder was added and refined in the wax. Further, the blending conditions for the model materials were determined, and an equation for predicting the flow curves of the model materials was proposed.
As an application example, experiments on and visioplas-ticity analyses of the plane strain backward extrusion of magnesium alloy and its model material, which represent the deformation property of work-softening type in the hot-working process, were carried out and we studied in similarity comparison of the equivalent strain distribution of the product inside.
2. Experimental Procedure 2.1 Experimental materials
The model material used in the experiment carried out in this study was prepared by using wax clay, which was mixed with powder and wax, and the obtained mixture was then kneaded. wax was composed of microwax, mineral oil and rosin, and the powder used is a mixture of kaolin and lime.
*This paper was Originally Published in Japanese in J. JSTP51-593 (2010) 582–586.
The compositions of all the model materials are shown in Table 1. The mass ratio of the components in the soft
wax (Sample No. 1–9 in Table 1) was microwax:
mineral oil:rosin¼5 : 1 : 1. While, hard wax (Sample
No. 10–18 in Table 1) was composed of only microwax. Goodness of mixed state of the powder and wax and remarkable change of deformation properties were con-formed, then the model materials were prepared with different powder content in which powder component mass
ratio is kaolin:lime¼2 : 5.
2.2 Preparation of model material and uniaxial com-pression test
A surfactant (Noigen ET-129 manufactured by Dai-Ichi Kogyo Seiyaku Co., Ltd.) and the powder were mixed with
wax, which was melted in an oil bath heated to 150C to
obtain the compositions listed in Table 1. After cooling, the mixture of wax and powder were homogenized by kneading for 60 min using a two-axis kneading machine (PLASTI CORER-PL2000 manufactured by Brabender Co., Ltd.).
The model material obtained after kneading was heated at
150C, and melted again in order to cast in a metal barrel
mold of40150mm. The mold was cooled and the model
material solidified at around20C. A cylindrical specimen
of 4040mm was prepared from the above model
material by cutting the both ends with nylon thread to 40 mm height. Using the above specimen coated with Vaseline equally, the flow curves were measured by uniaxial compression till 50% of initial height (strain 0.7) using
autograph in the condition of 25C and compression speed
1 mm/s. Strain rate in a compression test at a constant ram
speed changed from 0.025 s1to 0.05 s1with an increase in
the strain from 0 to 0.7. In order to investigate the influence of strain rate on the flow curve of the model materials, additional uniaxial compression tests were carried out at
the strain rate variation from 0.05 s1to 0.1 s1with a change
in the strain from 0 to 0.7 by using2020mm specimens.
Then, the flow curves measured at the above two strain rate variations were compared each others.
In addition, it was confirmed that uniaxial compression tests of homogeneous deformation could be carried out by observation of outer profile of the specimens deformed in the above experiments.
2.3 The processing experiment of plane strain backward extrusion
The commercial magnesium alloy specimen used in this experiment was AZ31B plate with thickness of 6 mm (manufactured by Osaka Fuji Co., Ltd., and annealed
specimen with hardness, HV¼65). After cutting out a
6020mm, the fine grid lines, spaced 2 mm apart, were
scribed on the specimen. Two specimens were stacked together and used as a workpiece in the experiment. In the above workpiece preparation, one of the mating surfaces was the plane on which the grid lines were scribed and that plane became observation aspect of plastic flow (distorted grid line pattern).
Figure 1 shows the schematic sketch of the experimental apparatus of the plane strain backward extrusion. After the
specimen spread with lubricant MoS2uniformly was placed
into the die, backward extrusion (incremental forming test)
was carried out at a material temperature of 300C and ram
speed of 0.5 mm/s using the hydraulic press machine and tubular electric resistance furnace.
The model material was a wax clay (No. 11 listed in Table 1) representing the similar deformation properties and flow curve configuration to those of the AZ31B specimen
deformed at 300C, and the model material specimen with
the same dimensions as those of the AZ31B specimen was prepared. The grid lines spaced 2 mm apart were printed on one side of the model material specimen by the ink stamp. The two specimens of model material were stacked together, and placed into the plastic die as same as the previous description. The forming experiment was carried out under the same conditions as those in the uniaxial compression test;
i.e., the temperature was maintained at 25C, the punch ram
[image:2.595.334.514.73.209.2]speed was 1 mm/s and the specimen was lubricated using Vaseline. The plastic flow (distorted grid pattern) was then observed.
Table 1 Compositions of the model materials.
Sample Wax/mass% Powder/mass% Powder content No. Microwax Oil Rosin Kaolin Lime /mass%
1 66.6 16.7 16.7 — — 0
2 56.6 14.2 14.2 4.3 10.7 15
3 46.6 11.7 11.7 8.6 21.4 30
4 33.4 8.3 8.3 14.3 35.7 50
5 30.0 7.5 7.5 15.7 39.3 55
6 26.6 6.7 6.7 17.1 42.9 60
7 23.4 5.8 5.8 18.6 46.4 65
8 25.0 5.0 5.0 20.0 50.0 70
9 13.4 3.3 3.3 22.9 57.1 80
10 100.0 — — — — 0
11 85.0 — — 4.3 10.7 15
12 70.0 — — 8.6 21.4 30
13 50.0 — — 14.3 35.7 50
14 45.0 — — 15.7 39.3 55
15 40.0 — — 17.1 42.9 60
16 35.0 — — 18.6 46.4 65
17 30.0 — — 20.0 50.0 70
18 20.0 — — 22.9 57.1 80
a : Upper die b : Side die c : Lower die d : Work-piece e : Punch f : Heater
a
b
c d e
f Punch stroke
[image:2.595.46.292.83.329.2]3. Experimental Result and Discussion 3.1 Stress-strain curves of model materials
The stress-strain curves of the model materials prepared using the soft and hard wax are shown in Fig. 2. The configurations of the flow curves indicate that in the case of model materials prepared using soft wax with a powder
content (Pw) of055mass% and those prepared using hard
wax with Pw of 065mass%, the work-softening type of
deformation occurs and the maximum stress values are appeared at a strain of around 0.05. When powder content of the model materials was increased above the values men-tioned above, steady state type and work-hardening type of deformation were observed. Further, the stress required to deform the model material prepared using hard wax is about seven or eight times higher than that required for model materials prepared using soft wax, and variance of stress revel of the flow curves with regard to powder content is smaller in the model materials prepared by using hard wax than that in the model materials prepared by using soft wax.
Table 2 shows the values of experimental factors,C andn,
in eq. (1) by which the flow curves (–"curves) of materials
in a strain range of more than 0.05 were represented. Where, eq. (1) is well known as the empirical rule equation for metallic materials. Then, the value of n could be controlled by varying powder content in wax.
¼C"n ð1Þ
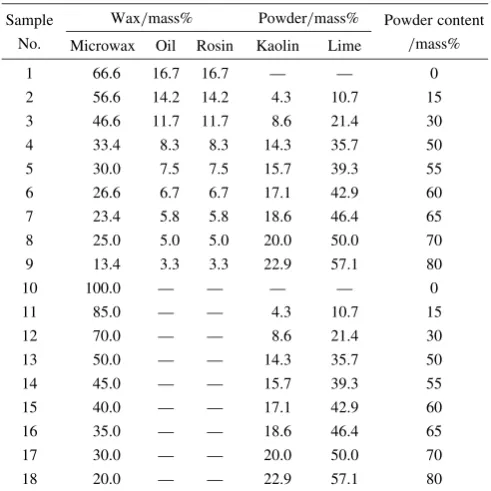
Figure 3 shows the flow curves at two different strain rates which were measured by uniaxial compression tests carried out at constant ram speed and using the specimens with different initial heights. Figures 3(A) and (B) show the strain
rate variations with regard to strain. While, Fig. 3(A)0 and
(B)0 represent the flow curves measured at the above strain
rate variations. The flow curves corresponding to the strain
rates""_1 and""_2 were compared in the case of both hard wax
and soft wax, and we could confirm that strain rate depend-ence of flow stress of the model materials was the same as that of the metallic materials; i.e., deformation resistance is
increased with increasing strain rate. Although the effect of strain rate on deformation resistance is low in the case of model materials with powder content of up to 60 mass%, it becomes remarkable that the strain rate does affect the deformation resistance of model materials with Pw of 80 mass%.
In the model material made of soft wax with Pw of
80 mass%, the flow curve measured at low strain rate (""_2)
exists at higher stress level compared to that measured at
high strain rate (""_1) up to strain 0.27. This is because the
work-hardening rate in the early stage (strain 0 to 0.02) of
deformation in the case of""_1is lower than that in the case of
_ "
"2. Deformation characteristic at larger strain range than 0.02
represents that work-hardening rate becomes larger at higher strain rate which is the same characteristic as that observed 0
0.2 0.4 0.6 0.8 1 1.2
0
Ture Strain, ε
T
rue Stress,
σ
/ MP
a
65 60 55 50 30 15 0 80
70 (B)
Powder content
(Pw:mass%)
0 0.05 0.1 0.15
0 0.2 0.4 0.6 0.8 0.2 0.4 0.6 0.8
Ture Strain, ε
T
rue Stress,
σ
/ MP
a Powder content(Pw:mass%)
30 15 0 55 50 60 65 70 80 (A)
[image:3.595.51.288.72.259.2]Fig. 2 Flow curves of the model materials using soft wax, (A), and using hard wax, (B).
Table 2 Candnvalue in eq. (1) of model materials show in Fig. 2.
Sample No. 1 2 3 4 5 6
Powder content/mass% 0 15 30 50 55 60
Cvalue 0.02 0.03 0.03 0.05 0.06 0.07
nvalue 0:43 0:27 0:21 0:08 0:03 0.01
Sample No. 7 8 9 10 11 12
Powder content/mass% 65 70 80 0 15 30
Cvalue 0.08 0.12 0.19 0.29 0.30 0.33
nvalue 0.07 0.13 0.25 0:16 0:16 0:13
Sample No. 13 14 15 16 17 18
Powder content/mass% 50 55 60 65 70 80
Cvalue 0.37 0.40 0.45 0.51 0.73 1.35
nvalue 0:10 0:09 0:05 0:04 0.00 0.19
0 0.05 0.1 0.15 0.2
0 0.2 0.4 0.6
True strain,ε
T
rue stress,
σ
/ MP
a
T
rue stress,
σ
/ MP
a
0 0.05 0.1
T
rue strain rate,
ε
/s
-1
0 0.5 1 1.5
True strain,ε
0 0.05 0.1
T
rue strain rate,
ε
/s
-1
(B)
ε1
ε2
(A)
ε1
ε2
(B)’
ε1
Pw 70
ε2
Pw 0
ε2
ε1
Pw 80 (mass%)
ε1
ε2
(A)’
Pw 80 (mass%)
Pw 60
Pw 0
ε1
ε2
ε1
ε2
ε2
ε1
0 0.2 0.4 0.6
[image:3.595.306.549.82.258.2] [image:3.595.307.549.268.545.2]in the metallic materials. While, the abovementioned effects are not observed in the case of hard wax. The deformation characteristic of model materials using hard wax shows that work-hardening rate and deformation resistance increase with increasing strain rate as same as metallic materials in all strain region of deformation.
3.2 Equation for prediction of deformation resistance of model material
Up to the present, a number of research papers concerning the equation of deformation resistance in plastic deformation
of metallic materials have been reported.7–10)An equation for
[image:4.595.49.291.71.260.2]predicting the deformation resistance of model materials was formulated on the basis of the experimental data shown in Fig. 2. The equation for predicting the deformation resistance was expressed using the work-hardening rate at a strain
ð@=@"Þ"in order to take into account the effect of the powder
particles dispersed in wax on the deformation resistanceat
each moment (at a strain") during the deformation process.
Equation (2) expresses the work-hardening rate at a strain
ð@=@"Þ" for the model materials, which is prepared by
adding a certain amount of powder, as the sum of the
work-hardening rate ð@0=@"Þ" (basic work-hardening rate) for
100% pure wax and the increase in the work-hardening rate
ð@=@"ÞRresulting from the addition of the powder.
The term representing the increase in the work-hardening
rate (ð@=@"ÞR in eq. (2)) at a strain"was determined using
the flow curves of 100% pure soft wax (Pw: 0 mass%) and of model materials with different powder contents (Pw:
3080mass%, shown in Fig. 2). Figure 4(A) shows the
relationships between the increment of work-hardening rate
ð@=@"ÞRin each powder content of model material and strain
". In addition, the result that plotted relations between the
mentioned above of ð@=@"ÞR and " to a semilogarithmic
graph is shown in Fig. 4(B). In the case of " >0:1, that a
reading error of flow curve in calculation of the value of term
ð@=@"ÞR and an error of finite difference calculation are
small in Fig. 4(B), the relation of ð@=@"ÞRplotted for each
powder content and"can be expressed approximately by the
equation of a linear function (3) or the eq. (4) renewed in
same one. In the equations,qandS0(orK) are experimental
factors. The factor qdid not depend on powder content and
was found to have a value of 6.0. While, it was proved thatS0
(or K) was a material factor whose value changed with the
powder content. In the case of a powder content for which
ð@=@"ÞRwas extremely small (Pw:3055mass%, shown in
Fig. 4(B)), though the differences between an approximation straight line by the eq. (3) and the plotted points seems remarkable because of semi logarithm expression of a small numerical value, it was confirmed that an approximation with the eq. (3) could be approved by an confirmation calculation to mention later.
@
@" "¼
@0
@"
"
þ @
@" R ð2Þ
ln @
@" R¼ q"þS0 ð3Þ
@
@" R¼Kexpðq"Þ; K¼expðS0Þ ð4Þ
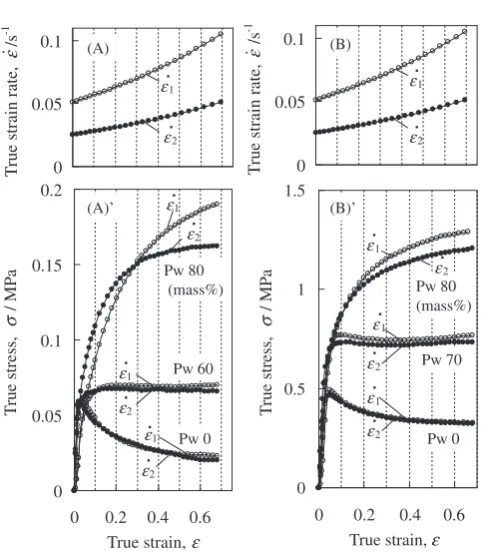
Similarly, the analysis results for the model materials
prepared using hard wax showed that the value ofqwas 6.0
and that the value ofKchanged with powder content. Since
the same powders were added in soft and hard wax, the hardening mechanism is thought about with a similar result.
The relationships between powder content andKin the case
[image:4.595.322.527.73.235.2]of materials prepared using soft and hard wax are shown in Fig. 5.
From the results of the abovementioned experiment and the analytical procedure, the equation of flow curve pre-diction for model materials could be expressed by eq. (5).
@
@" "¼
@0
@"
"
þKexpðq"Þ ð5Þ
Being alliance the segmental second order polynomial
equations which represented relations of K and powder
content of Fig. 5 and eq. (5) thatq¼6:0was substituted for,
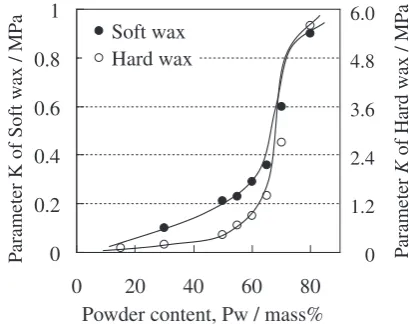
a computer program to do numerical calculation by Runge– Kutta-Gill method was corded. Then, the flow curves of model materials containing some different powder content 0
0.5 1
Ture Strain, Pw 30 Pw 50 Pw 55 Pw 60 Pw 65 Pw 70 Pw 80
0 0.2 0.4
0 0.2 0.4
Ture Strain,ε
ε
Pw 30 Pw 50 Pw 55 Pw 60 Pw 65 Pw 70 Pw 80 10
1
0.1
0.01
0.001
(B) (A)
ln(
∂
/
∂
σε
)R
(
∂∂
σ
/
ε
)R
/Mpa
Fig. 4 The relationships between work-hardening rate and strain of model materials using soft wax, [(@=@") with regard to", (A), andlnð@=@"Þwith regard to", (B)].
0 0.2 0.4 0.6 0.8 1
0 20 40 60 80
Powder content, Pw / mass% Soft wax
Hard wax
P
arameter K of Soft w
ax / MP
a
P
arameter
K
of Hard w
ax / MP
a
6.0
4.8
3.6
2.4
1.2
0
[image:4.595.344.549.457.540.2]were calculated by using the program. Figure 6 shows comparisons between the calculated (plotted solid circles and broad lines) and experimental results (plotted open circles and fine lines solid lines) for material prepared using soft wax. We can confirm that the results of flow curves predicted by using the equation of work-hardening rate are in good agreement with the actual measurement results.
3.3 Experiment on plane strain backward extrusion
The experiment and the visioplasticity analyses on the plane strain backward extrusion of magnesium alloy (AZ31B) and of the model material corresponding to AZ31B were carried out, and the equivalent strain distribu-tions in the products were compared mutually. It was known that plastic deformation of magnesium alloy is difficult at room temperature, but it is possible at a temperature of
more than 200C. Therefore, the extrusion experiment using
magnesium alloy was carried out at 300C.
The solid line in Fig. 7 shows the flow curve of magnesium
alloy (AZ31B) measured at 300C and at a punch ram speed
of 0.5 mm/s. The flow curve of the alloy indicates the work-softening phenomenon due to dynamic recrystallization occurring during a deformation process. We chose the
model material No. 11 listed in Table 1 (hard wax, Pw¼
15mass%) softening type of deformation observed in
deformation of AZ31B. The dotted line in Fig. 7 shows the flow curve of the model material made of hard wax and
powder (Pw¼15mass%), which was shown in Fig. 2(B).
When the flow curve of model material is compared with that of AZ31B, the stress level of deformation resistance is lower about 1/200. Further, in the strain range exceeding 0.15, it can be confirmed that the work-softening type of deformation indicated by both the flow curves are similar.
A series of incremental forming experiments in which the punch stroke stopping positions were changed some amount from a forming start position was carried out in order to analyze the plane strain backward extrusion process (non-steady state deformation) by applying the visioplasticity
method.5)Change of the grid pattern, which had been scribed
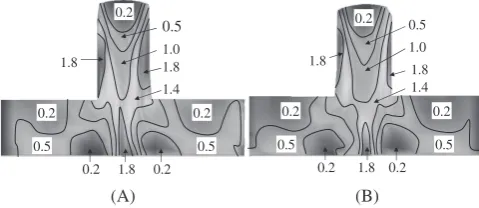
on (magnesium alloy) or printed on (model material) the observation plane of material flow of the workpiece, with regard to forming time was used for the numerical analysis. The equivalent strain distributions in the products at about 6 mm punch stroke position are shown in Fig. 8. It can be confirmed that the equivalent strain distribution in the product of the model material and that in the product of AZ31B are the similar result.
0 0.02 0.04 0.06
0 0.2 0.4 0.6
Ture Strain,
a) Pw 0 mass% K=0, q=6.0
0 0.02 0.04 0.06
0 0.2 0.4 0.6
Ture Strain,
b) Pw 30 mass% K=100, q= 6.0
0 0.02 0.04 0.06
0 0.2 0.4 0.6
Ture Strain,
c) Pw 50 mass% K=210, q=6.0
0 0.02 0.04 0.06
0 0.2 0.4 0.6
Ture Strain,
ε ε ε ε
d) Pw 55 mass% K=230, q=6.0
0 0.02 0.04 0.06 0.08
0 0.2 0.4 0.6
Ture Strain,ε ε ε ε
T
rue Stress,
/ MP
a
σ
e) Pw 60 mass% K=290, q=6.0
0 0.02 0.04 0.06 0.08
0 0.2 0.4 0.6
Ture Strain,
T
rue Stress,
/ MP
a
f) Pw 65 mass% K=360, q=6.0
0 0.03 0.06 0.09 0.12
0 0.2 0.4 0.6
Ture Strain,
T
rue Stress,
/ MP
a
g) Pw 70 mass% K=600, q=6.0
0 0.05 0.1 0.15 0.2
0 0.2 0.4 0.6
Ture Strain,
T
rue Stress,
/ MP
a
σ
T
rue Stress,
/ MP
a
σ
σ σ
T
rue Stress,
/ MP
a
σ
h) Pw 80 mass% K=900, q=6.0
T
rue Stress,
/ MP
a
σ
T
rue Stress,
/ MP
a
σ
Fig. 6 Flow curves predicted by the work-hardening rate equation (plotted solid circles and broad lines) and measured by experiment (plotted open circles and fine lines) using soft wax.
0 20 40 60 80 100
0 0.2 0.4 0.6 0.8
Ture Strain,ε
T
ure Stress of Mg allo
y,
/ MP
a
Mg alloy (300°C)
Model material
0.5
0.4
0.3
0.2
0.1
T
ure Stress of model material,
/ MP
a
σ
σ
0
[image:5.595.106.493.68.338.2] [image:5.595.324.527.381.561.2]4. Conclusions
A series of experiments and analyses were carried out for development of the model materials corresponding to the metallic materials by which a physical simulation of metal forming can be performed at a low stress level and at room temperature.
Deformation properties similar to those of metallic materials could be represented by the model materials made of wax clay in which the appropriate amount of powder was added and refined in the wax. The deformation characteristics (configuration of flow curves) could be corresponded to three typical configurations (work-softening type, steady state type and work-hardening type of deformation) by adjusting the powder content. In addition, we proposed the work-hardening rate equation by which the flow curves of the
model materials with different powder contents (Pw) could be predicted accurately, and the model material representing an arbitrary flow curve configuration could be fabricated.
As an application example, the experiments and strain analyses by visioplasticity method on the plane strain backward extrusion of AZ31B and its model material representing work softening type of deformation were carried out. We confirmed that product configuration, material flow in a forming process and strain distribution in the product of the actual material could be predicted with sufficient accuracy for engineering purposes by carrying out a physical forming simulation using the model material developed in the present investigation.
REFERENCES
1) Y. Kurino and A. Danno: J. Technol. Plast.13(1972) 768–775. 2) T. Wanheim, V. Maegaard and J. Danckert: Adv. Technol. Plast.2
(1984) 984–996.
3) T. Wanheim and S. Glibbery: Phys. Model. Metalwork Process. (1987) 143–152.
4) A. Azushima, H. Kakegawa, M. Akagawa, T. Suzuki and Y. Mastuoka: Proc. Conf. JSTP, (1987) pp. 355–358.
5) K. Nakanishi and Y. Mure: J. Technol. Plast.36-418 (1995) 1300– 1305.
6) F. P. Bariani and D. T. Negro: Ann. CIRP48(1999) 183–186. 7) K. Nakanishi, S. Kamitani and Y. Fukui: Research Reports of the
Faculty of Engineering, (Kagoshima University,36, 1994) pp. 19–32. 8) K. Nakanishi: J. Technol. Plast.30(1989) 262–269.
9) H. Miyagawa, H. Nakashima and H. Yoshinaga: Engineering Sciences Reports, (Kyushu University,13, 1992) pp. 325–331.
10) JSTP: Handbook for Technology of Plasticity, (Corona Publishing, Tokyo, 2006) pp. 31–34.
0.2
0.2
1.0
1.4 0.5
0.2 1.8 1.8
1.8
0.2 0.2
0.5 0.5
0.2
1.0
1.4
1.8
0.5
0.2
1.8 1.8
0.2
0.2 0.2
0.5 0.5
(B) (A)
[image:6.595.48.288.74.178.2]