Dynamic Material Flow Analysis and Forecast of Copper in Global-Scale:
Considering the Di
ff
erence of Recovery Potential between Copper and Copper Alloy
+Akihiro Yoshimura and Yasunari Matsuno
Graduate School of Engineering, Chiba University, Chiba 263-8522, Japan
The recovery of copper (Cu) from secondary sources has received much attention because of its scarcity of natural resources. In this work, we estimated the input, in-use stock and discard of copper and copper alloy during 19502015 in global scale, and forecast them until 2050. In addition, we estimated the potential of scrap recovery for copper/copper alloys. It was estimated that the total amount of in-use stock of copper and copper alloy were 177,000 kt and 44,200 kt in 2015, respectively. The in-use stock, discard and input of copper in 2050 will reach 381,000 588,000 kt, 15,40022,200 kt and 18,99033,000 kt, respectively, whereas those for copper alloy will reach 77,500134,000 kt, 3,0204,680 kt and 3,7607,200 kt, respectively. The copper content in recoverable scraps of copper and copper alloy will reach 15,10027,300 kt, and this accounts for 55.179.0%of copper content in annual input of copper and copper alloy in 2050. The range in forecast was caused by the difference in the saturation amount of in-use stock per capita and recovering rates of scraps. [doi:10.2320/matertrans.M2017399]
(Received December 18, 2017; Accepted March 29, 2018; Published May 11, 2018)
Keywords: copper, copper alloy, dynamic materialflow analysis, 2050
1. Introduction
Copper (Cu), used either as a pure metal or as an alloy by adding various elements, is an important material supporting modern society through its high electric and thermal conductivity, malleability, and ductility.1) The global copper production in 2016 was estimated to be 19,400 kt whereas the ore reserves were estimated to be 720,000 kt, and its reserves-to-production ratio was 37 years.2)The resource criticality of
copper is greater than that of other base metals such as iron and aluminum, and the recovery of copper from resources stocked in society is important.3)
For the effective recovery of copper from these scraps, it is important to grasp the amount of input to society, in-use stock quantity, and discard from end-of-life products. Materialflow analysis (MFA) is a useful tool for this purpose, and studies have been reported on copper MFA. Studies within the scope of a single country include the research on Japan by Daigo
et al.,4)USA by Chenet al.,5)France by Bonninet al.,6)and Brazil by Tanimoto et al.7)Furthermore, research on China, which has demonstrated remarkable economic growth in recent years, has been conducted by Xueyiet al.8)and Zhang et al.9)Studies that expanded the scope from a single country
to several countries include the studies on China, Taiwan, and South Korea by Terakado et al.,10)Asia by Kapur et al.,11)
North America by Spatariet al.,12)Central and South America
by Vexleret al.,13)and Europe by Bertramet al.14)and Ciacci et al.15) Furthermore, the studies by Graedel et al.16) and
Glöseret al.17)expanded the scope to the global scale.
[image:1.595.307.548.330.466.2]The total in-use stock quantity of resources in society at a certain point in time can also be obtained from the studies46,8,10,12,15,17)that carried out continuous analysis over multiple years (dynamic MFA4)), in addition to the studies that analyzed the amount of consumption, stock increase, and discard in a single target year,7,9,11,13,14,16) as presented in Table 1.
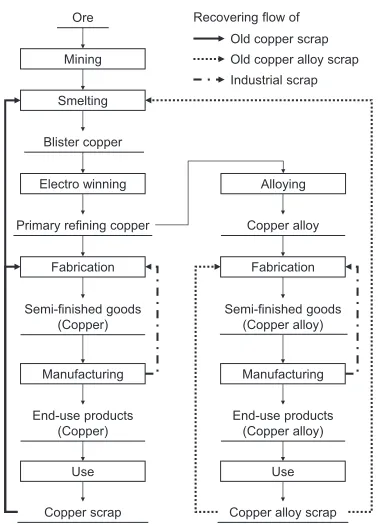
Figure 1 shows the flow of copper lifecycle from mining and smelting to processing into products and recycling from end-of-life products. As mentioned above, copper is used as a pure metal or alloy, and processed into products by manufacturers. Scraps are classified into processing scrap (new scrap) from product processing and obsolete scrap (old scrap) from end-of-life products.3)Processing scrap is widely
recycled as a raw material as it has a clear composition. Even obsolete scraps, such as waste electrical wires with high purity, are returned to the manufacturers and effectively used. However, there are differences in usage depending on the nature and quality of scrap. For example, low-copper-content obsolete scraps that cannot be used by manufacturers are processed in a flash furnace to be used as a raw material of blister copper.3) Therefore, it is necessary to estimate the discard of copper and amount of in-use stock, while distinguishing between copper and copper alloy for the effective utilization of future scraps. Except for the studies by Daigoet al.4)and Kapuret al.,11)dynamic MFA has not been
conducted with the distinction between copper and copper alloy, and hence, the recycling potential throughout the world has not been accurately estimated.
Table 1 Previous works of MFA of copper.
*: Considering the material flows for copper and copper alloys separately.
³: Focused on China, Korea and Taiwan.
+This Paper was Originally Published in Japanese in J. Japan Inst. Met.
Mater. 82 (2018) 817. Reference 38) was added in order to more precisely explain.
Furthermore, when evaluating the sustainability of resources, the future estimations of demand, scrap discard, and in-use stock quantity by considering economic growth are important. For steel materials, Hatayama et al.18) made
predictions up to the year 2050 by using forecasts of GDP per capita and population of each country. For copper, Zhang
et al.made predictions for China up to the year 208019)and
Gerstet al.made predictions globally up to the year 2100.20)
However, the distinction between copper and copper alloy was not considered in either study, and hence, the recycling potential was not evaluated.
In this work, we estimated and predicted the global-scale input, in-use stock, and discard of copper and copper alloy using dynamic MFA, which evaluates the flow from the production to the use and discard of refined copper, while distinguishing between copper and copper alloy used for both semi-finished and end-use products. From 1950 to 2015, the amount of in-use stock and discard were estimated from the amount of copper input classified by the respective applications. However, from 2016 to 2050, we predicted the input to society and discard of copper using the estimations of the in-use stock quantity with regard to the population of each country and GDP per capita, based on the method proposed by Hatayama et al.18) Furthermore, by examining
the recycling rate of scrap, we examined the possibility of reducing the required amount of new metal smelted from ore.
2. Methods
2.1 Materialflow analysis of copper and copper alloy 2.1.1 Object of the analysis
Figure 2 shows the system boundary of this study and estimated the flow surrounded by the dotted line with the refined copper produced as the starting point. Black arrows indicate the flows of copper and copper alloy from
consumption to scrap discard, and white arrows indicate the import and export of semi-finished and final products.
Statistics of each country for the consumption of refined copper, which was used as a starting point, were obtained.21,22)
In this work, 19 countries with high consumption of copper and the available long-term statistical data were considered. The countries covered in this work are listed in Table 2. These 19 countries accounted for 85.5% of the total global consumption of refined copper in 2015. Assuming that the consumed refined copper was processed into semi-finished productsfirst and subsequently used in end-use products, the consumption of semi-finished products in each country and region was estimated with regard to the indirect import/export amounts. This indirect import/export will be described later. Further, the end-use can be classified into seven categories,
®communication and power cable, civil engineering, building, electrical appliances, industrial equipment, vehicle and others®and by multiplying the consumption amount of
Ore
Mining
Smelting Refining
Semi finished goods Cable / Wire
Cu products Cu Cu alloy
End-use products
Cable / Wire
Electrical Appliances
Civil engineering
Vehicle Electrical waste Vehicle scrap (Shredder residue)
Low-grade scrap Building
Machinery
Others
Post-consumer scrap / waste
Cable / Wire
Vehicle scrap (Disassembled residue)
Cu products scrap High-grade scrap Refined Cu
Cu
Cu castings Cu Cu alloy
Import / Export
[image:2.595.305.548.65.243.2]Fig. 2 System boundary andflows of copper and copper alloy in this work.
Table 2 Countries and regions investigated in this work. Old copper scrap
Old copper alloy scrap Industrial scrap Recovering flow of Ore
Mining
Smelting
Blister copper
Electro winning
Semi-finished goods (Copper)
End-use products (Copper) Manufacturing
Copper scrap Use Primary refining copper
Fabrication
Semi-finished goods (Copper alloy)
End-use products (Copper alloy) Manufacturing
Copper alloy scrap Use Copper alloy
Fabrication Alloying
[image:2.595.75.264.66.328.2] [image:2.595.305.547.298.548.2]the semi-finished product by the usage ratio of end-use and yield, the input to the end-use was estimated. This usage ratio was obtained from the statistical data of Japan,2326)
China,27,28)and other areas.29)Data on the usage ratio of
end-use were not available for the years before 1984 for Japan, before 1994 and after 2011 for China, and before 2005 and after 2011 for the other areas. Therefore, the statistics for the first and last years for which data was obtained were extended in either direction, and the estimation was made. Furthermore, according to the data provided by the Japan Copper and Brass Association,29) except for Japan, China, South Korea, and India, statistics for countries other than the aforementioned ones were region-based, and listed as ASEAN, North America, Europe, and Africa as presented in Table 2; further, they were estimated as integrated regional units.
It was mentioned in Ref. 27) that there was a large difference between the yield ratios in each end-use product of copper and copper alloy. Therefore, in this work, after estimating the yield for each application and region based on the data,29)while referring to the corresponding values of copper and copper alloy in Ref. 27), the yield was set as listed in Table 3, and the amount of scrap (processing scrap) generated during processing was estimated. The yield was set to 100% for the applications of electric wires, i.e., both electric wires and copper foils, which are semi-finished products. For civil engineering and building, the percentage of electric wires occupied a larger sum when compared to other uses; therefore, the yield was higher.
We estimated theflow associated with the indirect import/ export amounts as follows. Estimations were obtained for the semi-finished products presented in Table 4 from the classification of UN Comtrade30) and the import/export
amounts. Some of these semi-finished products, such as bars and wire rods, were classified using the statistics of copper and copper alloy since 1988. Therefore, until 1987, the content rate of copper for all semi-finished products was regarded as 100%, whereas the copper content rate for
[image:3.595.306.548.210.461.2]semi-finished products made from copper alloy after 198827)was multiplied to estimate the indirect import/export amount. As for the final products, the estimations of the electrical and vehicle products presented in Table 4 were obtained
[image:3.595.130.468.500.743.2]Table 3 Yield ratio of copper and copper alloy in each end-use.
Table 4 Semi-finished goods and end-use products investigated in this work.
*: code in UN comtrade30)
using the import/export amount data of UN Comtrade,30)
similar to the semi-finished products. For electrical appliances, the copper amount per unit was obtained based on the production numbers of each product given in Ref. 27) and the input amount of copper and copper alloy to each product; further, the indirect import/export amount was estimated by multiplying weight per unit with the import/ export amount. We applied the same method to automobiles. The copper amount per unit was obtained based on the number of cars produced in each country31) and the input
amount for each end-use was provided by the Japan Copper and Brass Association.29) After the basic unit was
determined, the indirect import/export amount was estimated by multiplying weight per unit with the import/export amount. As the period of data ranged from 2005 to 2010, we used the percentage of 2005 for 2004 and earlier, and that of 2010 for 2011 and later.
2.1.2 Estimation of discard from in-use stocks and used products using the products in use
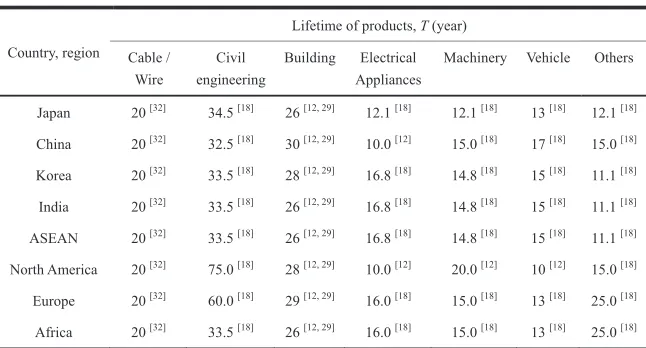
For each end-use product discarded by the society as an end-of-life product and the remaining products are regarded as the copper in-use stock. We carried out the dynamic MFA to estimate the discard and in-use stock of copper and copper alloy. The average lifetime of each end-use product required for the estimation was set using the average lifetime of copper foil and wires based on the previous studies.12,18,29,32)
Among them, for building, the average lifetime has been set longer in North America compared to the actual value; therefore, we set the average lifetime based on the existing research.12,29) Table 5 presents the average lifetime used in
the present work.
2.2 Estimation of the amount of in-use stock, discard, and input of copper and copper alloy by the year 2050
In order to estimate the future demand and recycling potential of scrap of copper and copper alloy, future forecasts of the in-use stock amount, discard to society, and estimated inputs are necessary. In this work, we estimated the amount of input, in-use stock, and discard of copper and copper alloy until 2050 using the Gompertz curve method proposed by Dargay et al.33) for the vehicle industry, and by using
the estimation method proposed by Hatayama et al.18) for
other usages. The population density34,35) and degree of urbanization35)required by the method proposed by Dargay
et al. and the population of each country34) and GDP36,37) required by the method proposed by Hatayama et al. were obtained from multiple references.
The saturation value for vehicle applications was determined using the method proposed by Dargay et al.,33) but the other five applications required their respective settings. Therefore, from the estimation results of in-use stock of each region obtained in 2.1.2, the area for which saturation was achieved was referred its value in 2015, and the area for which saturation was not achieved used the following scenarios.
Scenario I: Equivalent to the minimum saturation value Scenario II: Average of minimum and maximum saturation value
Scenario III: Equivalent to the maximum saturation value
2.3 Recycling potential estimation using the change of recycling rate of scrap
Copper consumes much energy at each stage from ore mining and smelting,38) to the use of products, resulting in
environmental burden. However, owing to the recycling of scrap as secondary ingots, parts of some processes such as smelting can be avoided, thus reducing the environmental burden. In this work, both the change in the recycling potential using the setting of recovery rate based on the copper and copper alloy discard estimated in 2.2 and the consumption of new metal smelted from ore reduction were estimated.
[image:4.595.137.460.87.261.2]The input amount of scrap in the smelting process was estimated based on the estimation results of copper and copper alloy discard up to the year 2050 obtained in 2.2, with the following assumption: the case of a low recycling rate, where the recycling rate is the same worldwide,39) and the case of a high recovery rate where the recycling rate varies depending on the area. In the case of a high recovery rate, it was set higher in developing countries with low labor costs. The recovery rates set are listed in Table 6. By applying the recycling rates listed in the table to scenarios I to III, the amount of scrap recovery until 2050 was estimated.
3. Results and Discussions
3.1 Dynamic material flow analysis of copper and copper alloy in the world
3.1.1 Amount of input, in-use stock, and discard of copper
Figure 3 shows the estimation results of inputs of copper and copper alloy by region and application from 1950 to 2015. In this study, the estimated value of the copper alloy indicates the weight of copper contained. By region, North America and Europe accounted for a large proportion until the early 1980s, but subsequently, the input amount of China increased. The copper input of China was 7,190 kt out of the global total of 12,600, whereas the copper alloy input was 1,550 kt out of the global total of 2,680 kt, both accounting for approximately 60% of the global total in 2015. This was attributed to China’s economic growth and infrastructure development. By type of application, both copper and copper alloy were mainly used for building.
Figure 4 shows the estimation results of discard of copper and copper alloy by region and application from 1950 to 2015. For the three regions i.e., Japan, North America, and Europe where the input amount of copper was high from a relatively early stage and continued to be stable to date, the discard of both copper and copper alloy gradually increased
from 2000, and a saturation tendency was observed. However, the proportion of China’s discard out of the global total was smaller than their inputs. This was because the amount of input in China has increased sharply in recent years and the input product stays in society for certain duration. However, there has been a significant increase in the copper discard in China in recent years. For example, considering the worldwide copper discard from 2014 to 2015, it was estimated that the increase in copper was 168 kt and the increase in copper alloy was 26.2 kt, whereas the corresponding increase in China was estimated to be 133 kt and 24.4 kt, respectively, accounting for 79.5% and 93.3%, respectively, of the global total. As China’s input of copper and copper alloy increased significantly, the proportion of discard in China with reference to the global total was forecasted to continue to increase in the future.
According to application, building accounted for a large proportion of the total input amount, and the proportion of electric wires, which has been steadily increasing, further increased. In terms of the input amount, the usage in building exceeded that in the electrical wires, but the lifetime of wire applications was 20 years,32) whereas that of
building was 26 to 30 years;12,29) hence, the proportion in
[image:5.595.48.301.81.443.2]the discard was small for building. Similarly, the proportion of discard was small for civil engineering applications,
Table 6 Recovery rates of copper and copper alloys sorted by the end-use and regions, used for the forecast in this work.
0 500 1,000 1,500 2,000 2,500 3,000 Annual input of Cu alloy , wCu alloy /kt ye a r -1 Year 0 500 1,000 1,500 2,000 2,500 3,000 Annual input of Cu all o y, wCu alloy /k t ye ar -1 Year 0 2,000 4,000 6,000 8,000 10,000 12,000 14,000 Annual input of Cu, wCu / kt ye ar -1 Year (a) (b) 0 2,000 4,000 6,000 8,000 10,000 12,000 14,000 Annual input of Cu, wCu /k t ye ar -1 Year (c) (d) Cable Civil Building Electrical appliance Machinery Vehicle Others India Japan China ASEAN Korea Europe Africa North America India Japan China ASEAN Korea Europe Africa North America Civil Building Electrical appliance Machinery Vehicle Others
Fig. 3 Annual input of copper, 19502015: (a) by region and (b) by end-use, and copper alloy, 19502015: (c) by region and (d) by end-use.
0 200 400 600 800 1,000 1,200 1,400 1,600 Discard o f Cu all oy , wCu alloy /k t ye a r -1 Year 0 200 400 600 800 1,000 1,200 1,400 1,600 Discard o f Cu all oy , wCu alloy /kt year -1 Year 0 1,000 2,000 3,000 4,000 5,000 6,000 7,000 Discard of Cu , wCu /k t ye ar -1 Year 0 1,000 2,000 3,000 4,000 5,000 6,000 7,000 Discard of Cu , wCu /k t ye ar -1 Year (a) (b) (c) (d) India Japan China ASEAN Korea Europe Africa North America India Japan China ASEAN Korea Europe Africa North America Cable Civil Building Electrical appliance Machinery Vehicle Others Civil Building Electrical appliance Machinery Vehicle Others
[image:5.595.308.548.252.439.2] [image:5.595.49.289.253.440.2]which have extremely long lifetime of 32.5 years to 75 years.18)
Figure 5 shows the estimation results of the in-use stock of copper and copper alloy by region and application for each year from 1950 to 2015. As with the input amount, China’s share of the global total has increased in recent years. However, Japan, South Korea, North America, and Europe observed a slight declining trend, and in these areas, copper and copper alloy in the society were considered to be saturated. When viewed by application, it was shown that the shares of civil engineering and building applications accounted for a large proportion, and this was attributed to the aforementioned lifetime and input amount.
We compared the in-use stock amount with the existing research by Glöseret al.,17)which estimated the total global
stock in 2010 to be approximately 350,000 kt. The present study estimated it to be 191,000 kt, which is much lower compared to the aforementioned value. This difference is believed to be due to the differences in the numbers of countries studied. In the research by Glöseret al., estimations were made based on the statistical data on the inputs to the worldwide mining, smelting, and product manufacturing, whereas the present study covers 19 countries as shown in 2.1.1. These countries accounted for 85.5% of the total refined copper consumption in 2015, but the coverage rate in Europe was especially low at approximately 4050% from 1950 to the 1990s. As discussed above, as the share of Europe in the total in-use stock amount was large, it was considered that the in-use stock amount was underestimated in this work. Furthermore, copper is heavily influenced by the cumulative period owing to its input to products with long lifetime such as building and civil engineering. According to the research by Glöser et al., the commencement period of MFA was as early as 1910, and by 1960, the stock amount was already approximately 70,000 kt; however, in the present work, it was approximately 26,000 kt, resulting in the underestimation. The research by Glöser et al. did not distinguish between the yields of copper and copper alloy, and set the yield for the end-use as 7595%, whereas the present study set it to 61100%for copper and 47100%for copper alloy. When the yield was high, the content in the
product estimated from the input amount and the in-use stock amount were overestimated in the existing study. Therefore, it was considered that the existing research by Glöseret al.was an overestimation in comparison to the present study. Based on the above factors, the estimation result of the present study was believed to be smaller than that of Glöseret al.
Additionally, in the research by Graedel et al.,16) it was estimated that the inflow to in-use stock, the difference of input and discard, in 1994 was 7,800 kt, whereas in the present work, it was estimated to be 3,160 kt. This was attributed to the scope of the research by Graedel et al., which included 56 countries, resulting in higher coverage rate compared to the present study, which included 19 countries. When the target was limited to Europe, in the research by Ciacci et al.,15) the total stock in 2014 was estimated to be
91,000«11,000 kt, whereas in the present work, it was estimated to be 55,500 kt. Although the estimation by Ciacci
et al. started from 1960 and the influence owing to the difference in the estimation period was small, in their study, the estimation was made for 28 member countries of the EU, whereas the estimated value of the in-use stock amount in the current work was smaller, which may be because only 9 countries were studied in the present work. Moreover, as mentioned above, the lower coverage rate in the present work from the 1950s to the 1990s also affected the consumption estimation of copper in Europe.
A single-year study limited to China by Zhang et al.,9)
estimated the inflow to stock in 2010 as 6,010 kt, and the dynamic MFA was performed from 1949 to 2012,19)the stock
amount was estimated to be 68,000 kt.19)In the present work,
the inflow amount in 2010 was estimated to be 4,730 kt and the total in-use stock amount in 2012 was 54,900 kt. The results were close to those of Europe and the world as a whole. However, data on the consumption of refined copper in the present work were obtained from 1979, and compared with the study by Zhang et al., which considered the estimation starting from 1949, the results of inflow to in-use stock and the total in-use stock amount were underestimated in the present study.
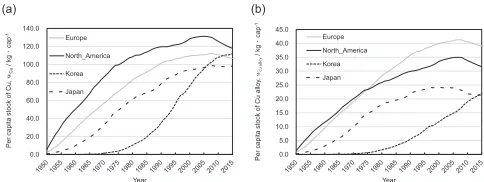
3.1.2 Estimation of in-use stock amount of copper per capita
The worldwide per capita stock was estimated to be 43.6 kg for copper and 10.8 kg for copper alloy in 2015.
Figure 6 shows the trends of per capita stock for Japan, South Korea, North America, and Europe, where saturation trends were observed in the countries and regions analyzed in this work. These countries and regions are the so-called developed countries, and the per capita stock of copper converged to approximately 100120 kg, whereas the copper content in the per capita stock of copper alloy converged to approximately 2040 kg in every country or region; hence, these values significantly surpassed those of other regions.
A saturation trend was not confirmed in other regions such as China, ASEAN, India, and Africa. Therefore, we used the saturation values of other countries and regions for estimating the stock amount (up to 2050) and discard based on the three scenarios described in 2.2. Table 7 presents the saturation value of the per capita stock used in each scenario.
The per capita stock predicted based on the above considerations was compared with the results of the
0 5,000 10,000 15,000 20,000 25,000 30,000 35,000 40,000 45,000 50,000
In-use stock of
Cu
all
oy
,
wCu
/k
t
ye
a
r
-1
Year 0
20,000 40,000 60,000 80,000 100,000 120,000 140,000 160,000 180,000 200,000
In-use stock of
Cu,
wCu
/k
t
ye
a
r
-1
Year
0 5,000 10,000 15,000 20,000 25,000 30,000 35,000 40,000 45,000 50,000
In
-use stock of
Cu
alloy
,
wCu
/
kt
year
-1
Year 0
20,000 40,000 60,000 80,000 100,000 120,000 140,000 160,000 180,000 200,000
In-use stock of
Cu,
wCu
/k
t
ye
a
r
-1
Year
(a) (b)
(c) (d)
India
Japan China
ASEAN Korea Europe Africa
North America
India
Japan China
ASEAN Korea Europe Africa
North America
Cable Civil Building Electrical appliance
Machinery Vehicle Others
Civil Building Electrical appliance
Machinery Vehicle Others
[image:6.595.48.290.69.255.2]existing research. Glöser et al.17) estimated the global per capita stock to be 50 kg per person in 2010. However, the present study estimated it to be 48.5 kg as of 2010, and equivalent results were obtained for the per capita stock. In comparison with the European results, the study by Ciacci et al.15)estimated the per capita stock in 2014 to be
180«20 kg, and the present study obtained a relatively similar result of 145 kg. As mentioned in 3.1.1, when comparing with the existing research spanning the global scale or Europe, the coverage rate of the countries in the present work was low. Thus, the total stock amount in the present work was estimated to be lower than that of the existing research. However, as the population coverage rate was also low, it was considered that each effect was offset when estimating the stock amount per capita, and thus, a result close to that of the existing research was obtained.
In the existing research on China by Zhanget al.,19)the per capita stock in 2012 was approximately 50 kg whereas the result achieved by the present study was 40.5 kg. When covering only a single country i.e., China, the coverage rate of the area did not change significantly, and hence, the coverage rate of the population also did not change significantly. Further, the stock amount per capita was also slightly underestimated owing to the difference in the estimation period, resulting in the underestimation of the total stock amount in the present work, as mentioned in 3.1.1. Table 8 summarizes the results of 3.1 and those of the existing research.
3.2 Estimation of in-use stock, input, and discard amount until 2050
Figure 7 shows the estimation results of the total in-use stock of copper and copper alloy for each scenario, and Fig. 8 shows the estimation results by region and application based on scenario II. In scenario I, which yielded the lowest results of the three, the total in-use stock in 2050 was estimated to be 381,000 kt for copper and 77,500 kt for copper alloy; whereas
[image:7.595.48.290.70.161.2]for scenario III, which yielded the highest results, these values were 588,000 kt and 134,000 kt, respectively, and for the intermediate scenario II, they were 488,000 kt and 107,000 kt, respectively. The differences observed for these scenarios were attributed to the uncertainty of the saturation values of China, India, and ASEAN countries. These countries and regions have a large population and high economic growth rate, and they increase the breadth of the saturation values. In all the scenarios, the total in-use stock of China was estimated to become saturated around 2030, and it was estimated that the impact of the increase in total in-use stock in India and ASEAN countries, especially in India, will be large. This was due to the forecasted decline in the population of China
Table 7 In-use per capita stock of copper and copper alloy in 2015 used for the forecast in scenarios IIII.
Table 8 Comparison of the results of in-use stock of copper in this work and the previous works.
*: Total copper content in copper and copper alloy. ³: Annual input for in-use stock.
‡: Calculated as (total in-use stock/population).
(a) (b)
0 100,000 200,000 300,000 400,000 500,000 600,000
In-use stock of
Cu,
wCu
/
kt
year
-1
Year Scenario_III Scenario_II Scenario_I
0 20,000 40,000 60,000 80,000 100,000 120,000 140,000 160,000
In-use stock of
Cu
alloy
,
wCu
alloy
/k
t
year
-1
Year Scenario_III Scenario_II Scenario_I
Fig. 7 Forecast of the in-use stock of copper and copper alloy by 2050 in scenarios IIII: (a) copper and (b) copper alloy.
0 100,000 200,000 300,000 400,000 500,000 600,000
In-use stock of
Cu,
wCu
/
kt
ye
ar
-1
Year
0 20,000 40,000 60,000 80,000 100,000 120,000
In
-use stock of
Cu
alloy
,
wCu
al
lo
y
/k
t
ye
ar
-1
Year
0 100,000 200,000 300,000 400,000 500,000 600,000
In-use stock of
Cu,
wCu
/k
t
ye
ar
-1
Year
0 20,000 40,000 60,000 80,000 100,000 120,000
In-use stock of
Cu
all
oy
,
wCu
alloy
/k
t
ye
a
r
-1
Year
(a) (b)
(c) (d)
India
Japan China
ASEAN Korea Europe Africa
North America Cable Civil Building
Electrical appliance Machinery Vehicle
Civil Building Electrical appliance
Machinery Vehicle India
Japan China ASEAN Korea
Europe Africa North America
Fig. 8 Forecast of the in-use stock of copper in scenario II by 2050: (a) by region and (b) by use, and copper alloy: (c) by region and (d) by end-use.
0.0 20.0 40.0 60.0 80.0 100.0 120.0 140.0
Per capita stock of
Cu,
wCu
/ kg
cap
-1
Year Europe North_America Korea Japan
(a) (b)
0.0 5.0 10.0 15.0 20.0 25.0 30.0 35.0 40.0 45.0
Per capita stock of
Cu
alloy
,
wcual
lo
y
/ kg
cap
-1
Year Europe North_America Korea Japan
[image:7.595.306.548.99.198.2] [image:7.595.48.290.224.319.2] [image:7.595.306.548.250.341.2] [image:7.595.306.548.387.576.2]starting from 2028, whereas the population of India and ASEAN countries was forecasted to increase until 2050,34)
which is thefinal year of this estimation.
In terms of application, as with the estimation until 2015, copper was used for construction applications, whereas copper alloy was used for civil engineering and construction applications.
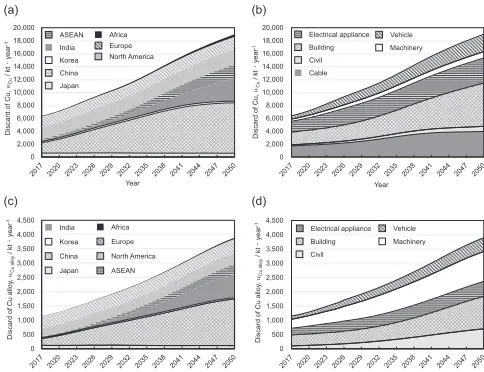
Figure 9 shows the estimations of the total discard of copper and copper alloy for each scenario, and Fig. 10 shows the results of regional and application-specific estimations for scenario II. As with the in-use stock amount, there was a large difference in copper discard depending on the scenario. By region, there was a saturation tendency forecasted in the discard amount of China from 2045 to 2050. However, the discard amounts of India and ASEAN were forecasted to increase, with other areas showing no change from the initial stage.
Figure 11 shows the estimation results of the total input amount of copper and copper alloy for each scenario until 2050, and Fig. 12 shows the estimation results by region and by application in scenario II. In terms of region, it was predicted that China will exhibit a declining trend in the input amount for both copper and copper alloy from 2020, whereas India was predicted to be the main consuming country instead, and the consumption will continue to increase until 2050. Moreover, the trend for ASEAN countries will continue to increase, but it was expected that the input will decrease after a peak at around 2030.
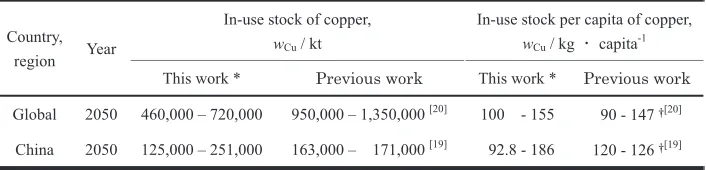
Table 9 presents the comparison of the in-use stock amount in 2050 estimated in the present study with those of the existing studies. The estimation results of the research by Gerst et al.20)were approximately 950,0001,350,000 kt for the total stock, and the results for the per capita stock amount were approximately 90147 kg. The results of estimation in the present study were approximately 460,000720,000 kt and 100155 kg, respectively. Furthermore, according to the existing research by Zhanget al.on China,19)it was estimated that the total stock amount will reach a peak at approximately 163,000171,000 kt around 2050, and using the population forecast, the per capita stock amount was estimated to be approximately 120126 kg. The results of estimation in the present work were 125,000251,000 kt and 92.8186 kg, respectively. In both the analyses, i.e., spanning the global scale and China, the total in-use stock amount was comparatively small in the present work when compared to the results of the existing research, showing a tendency of relatively close results of the stock amount per person capita, which was considered to be due to the same reason as in 3.1.2. As mentioned in 3.1.2, as the stocks in China, ASEAN, India, and Africa did not reach the saturation value in 2015, the three scenarios with the maximum value, minimum value, and average value of the stock amount were used for the estimation. In recent years, the economic development of these regions has rapidly progressed, and the GDP per capita per 2050 was forecasted to be approximately four times as large as that in 2015, which is more than twice that of
0 5,000 10,000 15,000 20,000 25,000 Discard o f Cu , wCu /k t ye a r -1 Year Scenario_III Scenario_II Scenario_I 0 500 1,000 1,500 2,000 2,500 3,000 3,500 4,000 4,500 5,000 Discard o f Cu all o y, wCu alloy /k t year -1 Year Scenario_III Scenario_II Scenario_I (a) (b)
Fig. 9 Forecast of the discard of copper and copper alloy by 2050 in scenarios IIII: (a) copper and (b) copper alloy.
[image:8.595.50.293.70.162.2]0 500 1,000 1,500 2,000 2,500 3,000 3,500 4,000 4,500 Discard of Cu alloy , wCu alloy /k t ye a r -1 Year 0 500 1,000 1,500 2,000 2,500 3,000 3,500 4,000 4,500 Discard o f Cu all oy , wCu alloy /kt year -1 Year 0 2,000 4,000 6,000 8,000 10,000 12,000 14,000 16,000 18,000 20,000 Discard of Cu , wCu /k t ye ar -1 Year 0 2,000 4,000 6,000 8,000 10,000 12,000 14,000 16,000 18,000 20,000 Discard of Cu , wCu / kt ye ar -1 Year (a) (b) (c) (d) Cable Civil Building Electrical appliance Machinery Vehicle Civil Building Electrical appliance Machinery Vehicle India Japan China ASEAN Korea Europe Africa North America India Japan China ASEAN Korea Europe Africa North America
[image:8.595.303.550.70.161.2]Fig. 10 Forecast of the discard of copper in scenario II by 2050: (a) by region and (b) by use, and copper alloy: (c) by region and (d) by end-use. 0 1,000 2,000 3,000 4,000 5,000 6,000 7,000 8,000 Annual input of Cu all oy , wCu alloy /kt year -1 Year Scenario_III Scenario_II Scenario_I 0 5,000 10,000 15,000 20,000 25,000 30,000 35,000 Annual input of Cu, wCu / kt year -1 Year Scenario_III Scenario_II Scenario_I (a) (b)
Fig. 11 Forecast of the annual input of copper and copper alloy by 2050 in scenarios IIII: (a) copper and (b) copper alloy.
0 1,000 2,000 3,000 4,000 5,000 6,000 Annual input of Cu all oy , wCu alloy /k t ye ar -1 Year 0 1,000 2,000 3,000 4,000 5,000 6,000 Annual input of Cu all oy , wCu alloy /k t year -1 Year 0 5,000 10,000 15,000 20,000 25,000 30,000 Annual input of Cu, wCu / kt ye ar -1 Year 0 5,000 10,000 15,000 20,000 25,000 30,000 Annual input of Cu, wCu /k t ye ar -1 Year (a) (b) (c) (d) Cable Civil Building Electrical appliance Machinery Vehicle Civil Building Electrical appliance Machinery Vehicle India Japan China ASEAN Korea Europe Africa North America India Japan China ASEAN Korea Europe Africa North America
[image:8.595.47.289.209.395.2] [image:8.595.306.548.210.395.2]developed countries.34,36,37) In the present work, we made
predictions using GDP per capita, and it was considered that the increasing trend of future prediction was due to the existence of a certain range of saturation values.
3.3 Evaluation and estimation of copper recycling potential using the scrap recycling rate change
Figure 13 shows the comparison between the scenarios regarding the predicted amount of recycling potential obtained based on the copper discard amount determined in 3.2 and the settings in 2.3, and the change in the input of copper amount in copper and copper alloy.
The input amounts in 2050 were predicted to be 22,700 kt, 31,700 kt, and 40,200 kt for scenarios I, II, and III, respectively. In contrast, the proportion of secondary ingots derived from scrap was estimated to be 66.479.0% for scenario I, 59.872.8% for scenario II, and 55.168.0% for scenario III. Further, in all the scenarios, it was estimated that the required new ingots derived from the ore can be reduced to 4,70018,100 kt. As mentioned in the introduction, copper resources are not abundant, and as consumption is expected to increase with the economic development of developing countries in the future, it is necessary to promote more aggressive recycling.
The amounts of copper input and discard of China in 2050 estimated in the present work were compared with the results obtained from the existing research by Zhanget al.19)In the
present work, the estimated values of China in 2050 were 5,1609,260 kt of copper input, 5,51010,000 kt of copper
discard, 5402000 kt of copper alloy input, and 1,010 2,180 kt of discard amount, resulting in a total of 6,100 11,300 kt of input amount and 6,51012,200 kt of discard amount. In the existing research by Zhang et al., the difference between copper and copper alloy was not considered, and the estimation of the total input amount was 7,6008,200 kt whereas that of the discard amount was 7,5008,100 kt. Both estimations resulted in a similar result of input and discard amounts in 2050.
In the existing research by Zhang et al., the difference between copper and copper alloy was not considered, and the future copper recycling rate was assumed to be 100%, by considering the discard as having recycling potential for input to society; it was concluded that, by 2060, 80% of the total demand including exports will be supplied with obsolete scrap. However, as mentioned above,3)there are differences
in the usage method owing to the quality of scrap in recycling, and it is impossible to recover scraps completely. Therefore, it was considered that the study by Zhang et al.
overestimated the recycling potential and hence, the conclusion of making the amount of discard to be the same as recyclable amount. However, it can be concluded that the predictions made in this work are more practical owing to the fact that the recycling rate including applications was considered after estimating the amount of discard separately for copper and copper alloy.
4. Conclusions
In this work, we estimated the input amount of copper, discard, and stock quantity in the society, considering the difference between pure copper and its alloy. Furthermore, we forecasted their future estimations until 2050 using the GDP per capita etc., and estimated the reduction effect of new ingots owing to the change in the recycling rate. From the above results, we obtained the following conclusions.
[image:9.595.123.476.91.176.2](1) China’s share of the global input amount increased rapidly in recent years, whereas those of the global discard and in-use stocks were relatively low. Most of the increase in discard and in-use stocks was due to the growth of China in recent years, and it is expected that China will dominate the proportion in the future as well. By type of application, owing to long lifetime and a large input amount, it was estimated that construction applications accounted for approximately 40% of the total amount. For copper alloy, it was estimated that civil engineering and construction applications accounted for approximately 30%each for the same reason.
Table 9 Comparison of the forecast results of in-use stock of copper in this work and the previous works.
*: Total copper content in copper and copper alloy. ³: Calculated as (total in-use stock/population).
0 5,000 10,000 15,000 20,000 25,000 30,000 35,000 40,000 45,000 50,000
Input and
re
cov
e
red
amount of
Cu,
wCu
/k
t
year
-1
Year
0 5,000 10,000 15,000 20,000 25,000 30,000 35,000 40,000 45,000 50,000
Input and
recov
ered
amount of
Cu,
wCu
/k
t
year
-1
Year 0
5,000 10,000 15,000 20,000 25,000 30,000 35,000 40,000 45,000 50,000
Input
and r
e
cov
e
red amount
of
Cu,
wCu
/k
t
year
-1
Year
(a) (b)
(c)
Input in scenario II
Recovered amount in scenario II, High rate Low rate Input in scenario I
Recovered amount in scenario I, High rate Low rate
Input in scenario III
[image:9.595.48.291.215.399.2]Recovered amount in scenario III, High rate Low rate
Although the estimation results obtained in this study for the total in-use stock worldwide tended to be underestimated compared to the existing studies, a significant difference was not observed in the stock amount per capita. Furthermore, the results of regional and country-specific estimations were smaller than the results for global scale. It was considered that, owing to factors such as coverage ratio, difference in the commencement period of estimation, yield setting in product manufacturing, etc., the estimation result of this research was lower.
(2) According to the estimation until 2050, although there was a difference between the different scenarios of saturation values, China, followed by India, will continue to show increasing trends until 2030, and this will have a large impact on the global in-use stock amount in the future. Similar results were also obtained for the estimation of ASEAN countries considering their growth. When comparing the results of the future estimation obtained in the present study with those of the existing research for both the global scale and China, the total in-use stock amount was observed to be underestimated, but the per capita stock amount was comparatively similar. This was attributed to the same factors as in (1).
(3) When estimating the reduction effect of the amount of new ingots using the forecasts of copper discard and demand and the recycling rate of scraps, it was observed that the annual input amount of copper in the form of both pure copper and copper alloy in 2050 was 22,700 40,200 kt, whereas the copper content in recyclable scrap was estimated to be 15,10027,300 kt. Depending on the scenario and recovery rate, the required amount of new ingots was estimated to be approximately 4,700 18,100 kt, and the reduction of 5579%was expected.
Acknowledgments
We are grateful to the Japan Copper and Brass Association for providing us the data required to carry out this study. We also received immense support from Kurimoto Naoyuki (during the master program enrollment period at the Univer-sity of Tokyo) in performing the analysis and estimation.
REFERENCES
1) Homepage of Copper Development Association Inc.: Copper is +, https://www.copper.org/education/copper-is/, 2017/5/30.
2) Homepage of USGS 2017: Minerals Information, Copper statistics and Information https://minerals.usgs.gov/minerals/pubs/commodity/ copper/mcs-2017-coppe.pdf, 2017/5/30.
3) Homepage of Japan Copper and Brass Association: Copper and recycling, http://www.copper-brass.gr.jp/english/shindouhin-e/recycle. html, 2017/5/30.
4) I. Daigo, S. Hashimoto, Y. Matsuno and Y. Adachi:Resour. Conserv. Recycling53(2009) 208217.
5) W. Chen, M. Wang and X. Li:Resour. Conserv. Recycling111(2016) 6776.
6) M. Bonnin, C. Azzaro-Pantel, L. Pibouleau, S. Domenech and J. Villeneuve:Chem. Eng. Res. Des.91(2013) 13901402.
7) A.H. Tanimoto, X.G. Durany, G. Villalba and A.C. Pires: Resour. Conserv. Recycling55(2010) 2028.
8) G. Xueyi and S. Yu:Resour. Conserv. Recycling52(2008) 874882.
9) L. Zhang, J. Yang, Z. Cai and Z. Yuan:Sci. Total Environ.478(2014) 8089.
10) R. Terakado, K.I. Takahashi, I. Daigo, Y. Matsuno and Y. Adachi: J. Jpn. Inst. Metal Mater.73(2009) 833838.
11) A. Kapur, M. Bertram, S. Spatari, K. Fuse and T.E. Graedel:J. Mater Cycles Waste5(2003) 143156.
12) S. Spatari, M. Bertram, R.B. Gordon, K. Henderson and T.E. Graedel: Ecol. Econ.54(2005) 3751.
13) D. Vexler, M. Bertram, A. Kapur, S. Spatari and T.E. Graedel:Resour. Conserv. Recycling41(2004) 2346.
14) M. Bertram, T.E. Graedel, H. Rechberger and S. Spatari:Ecol. Econ.42
(2002) 4357.
15) L. Ciacci, I. Vassura and F. Passarini:Resources6(2017) 6. 16) T.E. Graedel, D.V. Beers, M. Bertram, K. Fuse, R.B. Gordon, A.
Gristsinin, A. Kapur, R.J. Kless, R.J. Lifset, L. Menon, H. Recherger, S. Spatari and D. Vexler:Environ. Sci. Technol.38(2004) 12421252. 17) S. Glöser, M. Soulier and L.A.T. Espinoza:Environ. Sci. Technol.47
(2013) 65646572.
18) H. Hatayama, I. Daigo, Y. Matsuno and Y. Adachi: Environ. Sci. Technol.44(2010) 64576463.
19) L. Zhang, Z. Cai, J. Yang, Z. Yuan and Y. Chen:Sci. Total Environ.536
(2015) 142149.
20) M.D. Gerst:Environ. Sci. Technol.43(2009) 63206325.
21) World Bureau of Metal Statistics: World copper statistics since 1950: 1983 supplement (World Bureau of Metal Statistics, London, 1983). 22) World Bureau of Metal Statistics: World Metal Statistics Yearbook
(World Bureau of Metal Statistics, London, 2016).
23) Japan Electric Wire and Cable Makers’ Association: Densen toukei nempo, 19522015.
24) Research and Statistics Department, Economic and Industrial Policy Bureau, Ministry of Economy, Trade and Industry: YEARBOOK OF MINERALS AND NON-FERROUS METALS STATISTICS, 1975 2001.
25) Research and Statistics Department, Minister’s Secretariat, Ministry of Economy, Trade and Industry: YEARBOOK OF IRON AND STEEL, NON-FERROUS METALS AND FABRICATED METALS STATISTICS, 20022015.
26) Homepage of Japan Copper and Brass Association: Database of copper and copper alloy, http://copper-brass.gr.jp/databases/statistics, 2017/5/ 30.
27) BGRIMM:China Copper Usage Database, (Beijing General Research Institute of mining and metallurgy, Beijing, 2010).
28) Metal Economics Research Institute: Sekai no Doushouhi ni okeru Chugoku Youin to Sono Eikyo, (Metal Economics Research Institute, Tokyo, 2007).
29) Data provided by the Japan Copper and Brass Association.
30) United Nations: United Nations Commodity Trade Statistics Database, http://comtrade.un.org/, 2017/5/30.
31) International Organization of Motor Vehicle Manufacturers: PRO-DUCTION STATISTICS, http://www.oica.net/category/production-statistics/, 2017/5/30.
32) Homepage of The Japanese Electric Wire & Cable Makers’ Association: Densen, Cable no taiyou nensu ni tsuite, http://www. jcma2.jp/data/jcs_pdf/107.pdf, 2017/5/30.
33) J. Dargey, D. Gateway and M. Sommer: Energy J.28(2007) 143170. 34) United Nations: World Population Prospects, the 2015 revision, https://
esa.un.org/unpd/wpp/, 2017/5/30.
35) World Bank Group: World Development Indicators 2016, https://openknowledge.worldbank.org/bitstream/handle/10986/23969/ 9781464806834.pdf ?sequence=2&isAllowed=y, 2017/5/30. 36) International Monetary Fund: World Economic Outlook Database,
April 2017 Edition, https://www.imf.org/external/pubs/ft/weo/2017/01/ weodata/download.aspx, 2017/5/30.
37) U.S. Energy Information Administration: International Energy Outlook 2016, https://www.eia.gov/outlooks/ieo/, 2017/5/30.
38) U.S. Congress, Office of Technology Assessment:Copper: Technology and Competitiveness(U.S. Government Printing Office, Washington, 1988).