warwick.ac.uk/lib-publications
Original citation:
Dickson, James, Wright, Steven A., Maheswaran, Satheesh, Herdman, J. A., Miller, Mark C.
and Jarvis, Stephen A. (2016) Replicating HPC I/O workloads
w
ith proxy applications. In: 1st
Joint International Workshop on Parallel Data Storage & Data Intensive Scalable Computing
Systems (PDSW-DISCS'16), Salt Lake City, Utah, USA, 14 Nov 2016
Permanent WRAP URL:
http://wrap.warwick.ac.uk/82043
Copyright and reuse:
The Warwick Research Archive Portal (WRAP) makes this work by researchers of the
University of Warwick available open access under the following conditions. Copyright ©
and all moral rights to the version of the paper presented here belong to the individual
author(s) and/or other copyright owners. To the extent reasonable and practicable the
material made available in WRAP has been checked for eligibility before being made
available.
Copies of full items can be used for personal research or study, educational, or not-for profit
purposes without prior permission or charge. Provided that the authors, title and full
bibliographic details are credited, a hyperlink and/or URL is given for the original metadata
page and the content is not changed in any way.
Publisher’s statement:
© 2016 IEEE. Personal use of this material is permitted. Permission from IEEE must be
obtained for all other uses, in any current or future media, including reprinting
/republishing this material for advertising or promotional purposes, creating new collective
works, for resale or redistribution to servers or lists, or reuse of any copyrighted component
of this work in other works.
A note on versions:
The version presented here may differ from the published version or, version of record, if
you wish to cite this item you are advised to consult the publisher’s version. Please see the
‘permanent WRAP url’ above for details on accessing the published version and note that
access may require a subscription.
Replicating HPC I/O Workloads
With Proxy Applications
James Dickson
∗, Steven Wright
∗, Satheesh Maheswaran
†, Andy Herdman
†, Mark C. Miller
‡and Stephen Jarvis
∗∗Department of Computer Science, University of Warwick, UK
†UK Atomic Weapons Establishment, Aldermaston, UK ‡Lawrence Livermore National Laboratory, Livermore, CA
Corresponding Email: [email protected]
Abstract—Large scale simulation performance is dependent on a number of components, however the task of investigation and optimization has long favored computational and communication elements above I/O. Manually extracting the pattern of I/O behavior from a parent application is a useful way of working to address performance issues on a per-application basis, but developing workflows with some degree of automation and flexibility provides a more powerful approach to tackling current and future I/O challenges. In this paper we describe a workload replication workflow that extracts the I/O pattern of an applica-tion and recreates its behavior with a flexible proxy applicaapplica-tion. We demonstrate how simple lightweight characterization can be translated to provide an effective representation of a physics application, and show how a proxy replication can be used as a tool for investigating I/O library paradigms.
I. INTRODUCTION
The challenge of understanding and capitalizing on data in-put/output (I/O) performance is complex, yet increasing in importance as HPC systems continue to grow in scale. A persisting trend in this growth is computational power over-shadowing I/O and data storage. Departure from traditional programming models and architectures has the potential to further this disparity should I/O techniques fail to adapt to match the way in which future applications will operate.
Following an I/O operation becomes burdensome as calls are translated down through high level libraries, middleware and parallel file systems. As a result, it becomes less obvious where to focus efforts for optimization and how to tune each layer in the software stack to reduce any apparent performance bottlenecks. Moreover, with many institutions deploying their own libraries to support in-house data models and ensure consistency, I/O practices can be dictated by design decisions and not by current best practices.
In efforts to gain some insight into I/O performance, applications can be instrumented to monitor the operations that occur during a simulation with their corresponding pa-rameters. Doing so on a per-application basis however is a time consuming task, hence lightweight profiling and tracing libraries have been invaluable for capturing the data required to demonstrate what is happening during execution. Performing multiple repetative runs of full scale applications to experiment with potential performance improvements is largely inefficient and cumbersome and highlights the requirement of a more streamlined approach for replicating application workloads.
Proxy applications are invaluable tools for uncovering op-timizations in production applications, notably showcased by the highly successful Mantevo project [1]. The clear benefit being a smaller representative code base with which to apply changes and assess new software libraries. Performance im-provements uncovered while working with these proxies can then be integrated back into the original parent application.
While benchmarks exist representing I/O workloads of a small number of applications, they can become outdated with regards to their parent application, or are not updated to keep pace with changes to high level libraries. For example, prominent I/O benchmarks such as MADbench2 and Chombo I/O were last updated in 2006 and 2007 respectively. It is this situation that motivates the use of proxy applications to represent the behavior and performance of a wide range of production applications.
In this paper, we demonstrate a process for replicating the I/O workload of an application through the use of the Multi-purpose, Application Centric, Scalable I/O proxy application (MACSio). We have developed tools to translate Darshan characterization logs to a set of MACSio input parameters, which represent a target application. To enable replication of applications using the TyphonIO high level library, we have developed a plugin that allows MACSio to use the library to perform file I/O. Finally, we present a case study of our replication workflow mimicking the behavior of a physics application, which is used to investigate a parallel performance feature of the underlying high level I/O library.
The remainder of this paper is organized as follows: Section II describes related work; Section III provides background information of the MACSio proxy application and the Ty-phonIO library; Section IV outlines our replication workflow, from execution of a target application to replication with the MACSio proxy; Section V provides a case study of our work-flow replicating the Bookleaf application and a performance observation made from this replication; finally, the conclusion of the paper is given in Section VI along with an outline of plans for future work.
II. RELATEDWORK
has been established that mixed Workloads often struggle to reach peak performance and vary drastically with the use of different I/O libraries and specific tuning parameters [2].
Snyder et al. propose interesting workload generation tech-niques and identify three classes of I/O workload repre-sentations: traces, synthetic and characterization [3]. Trace workloads refer to those generated using snapshots of in-dividual I/O operations along with associated timing data. Tools such as Recorder [4], RIOT [5] and ScalaIOTrace [6] capture the required granularity of information at multiple levels in the software stack. With such high fidelity data collection, it is possible to translate application traces into a representative proxy using auto-generation tools, such as the Replayer tool [7]; however these require refinement and there are questions as to how much of an effect intensive data collection has on the application behavior we are monitoring. Synthetic workloads are manually defined using a domain specific language to exercise a desired pattern on a storage sys-tem. An example being the CODES I/O language [8], which has been used to demonstrate performance improvements of burst buffer systems for some user interpreted workloads [9]. Characterizing I/O activity uses a technique similar to that of tracing, however compact high level statistics are produced rather than comprehensive trace logs. Darshan [10] has been used to produce characterization data of this form, and is effective due to its lightweight instrumentation and suitability for continuous machine wide deployment. Vitally, the data produced is still rich enough to study I/O behavior at the demands of petascale machines [11].
A common technique among I/O benchmarks, such as FLASH-IO, MADBench2 [12], Chombo I/O and S3D-IO, is to manually extract important kernels from an application. FLASH-IO focuses on write performance of the Flash su-pernova code, while MADBench2 attempts to gain a more complete picture through the inclusion of both read and write operations for the same simulation. This approach attempts to bridge the gap between a stand-alone benchmark and the applications it attempts to model. While highly effective at providing insight for a single application, there is a lack of flexibility for handling a wider range of I/O paradigms.
IOR [13] is a synthetic parametrized benchmark derived from workload analysis of applications used at the US National Energy Research Scientific Computing Center (NERSC). This work attempts to cover two of the common shortfalls of I/O benchmarks: a lack of representative access patterns and the inconsistent use of parallel libraries. With diverse configu-ration options, the authors claim to be able to reconstruct the behavior of an application to within 10%. Whilst this behavioral prediction is only achievable with a very specific selection of parameters, with careful use, IOR can be an effective benchmarking tool. We adopt a similar parametrized approach, attempting to focus on the performance of high level libraries.
A different approach taken to application benchmarking, demonstrated by the Skel [14], [15] and APPrime [16] tools, automatically generates I/O kernels based on application
traces. Skel uses two mark-up based configuration files, a parameter file and descriptor file, to dictate the structure and behavior of its kernels. The simplicity of the Skel approach comes from leveraging the existing parametrization of the ADIOS high level library. The transport method used by ADIOS can be varied in a configuration file, requiring no source recompilation, and hence is valuable for comparing the performance of different I/O paradigms. Currently the focus of Skel is the deployment of ADIOS for experimentation purposes and extension to use alternative high level libraries is not possible. Similarly, APPrime auto-generates benchmark code to represent applications, but does so based on statistical ‘trace’ data taken from execution of the original target appli-cation. Initial evaluation of this technique suggests recreation of applications with a degree of accuracy; however, the ability to configure these applications forin depth analysis has yet to be demonstrated.
III. BACKGROUND
The work makes use of MACSio and TyphonIO. MACSio was developed by Lawrence Livermore National Laboratory. TyphonIO is an I/O library developed by AWE.
A. MACSio Proxy Application
MACSio [17] was developed to fill a long existing void in co-design proxy applications that allow for I/O performance testing as well as evaluation of tradeoffs in data model interfaces and parallel I/O paradigms for multi-physics, HPC applications. Two key design features of MACSio set it apart from existing I/O proxy applications and benchmarking tools. The first is the level of abstraction at which MACSio is designed to operate and the second is the degree of flexibility MACSio is designed to provide in driving an HPC I/O work-load through parameterized, user-defined data objects and a va-riety of parallel I/O paradigms and I/O interfaces. Combined, these features allow MACSio to closely mimic I/O workloads for a wide variety of real HPC applications, in particular, multi-physics applications where data object distribution and composition vary dramatically both within and across parallel tasks. These data objects are then marshaled between primary and secondary storage according to a variety of application use cases (e.g. restart dump or trickle dump). Using one or more I/O interfaces (plugins) and parallel I/O paradigms, allows for direct comparisons of software interfaces, parallel I/O paradigms, and file system technologies with the same set of customizable data objects.
B. TyphonIO Parallel I/O Library
with an alternative library implementation without having to make any code changes to applications using TyphonIO.
The TyphonIO file format is a hierarchical structure of dif-ferent objects, with each object corresponding to a simulation or model feature, like those found in scientific or engineering applications. Each object is designed to hold the data and associated metadata for each feature and some of these objects are chunked. Due to the way TyphonIO is designed, it is straightforward to add more objects in future and expand the format to cover more models.
IV. WORKFLOWCOMPONENTS
In general there are four steps to the replication process: data collection on representative runs of an application to serve as an input to the generation tools; processing and translation of I/O characterization logs to a set of parameters; development of a plugin for MACSio to replicate the I/O pattern of the target application with a parallel I/O library; adaptation of the MACSio replication to investigate I/O behavior by exploration of library tuning and variation of I/O paradigms.
A. Profiling
As discussed in Section 2, there are three methods of obtaining representations of application I/O activity. For the purpose of this work, we choose to adopt the workload characterization approach using Darshan. We believe the lightweight data collection performed by Darshan is best suited for recording I/O activity without introducing the overheads seen with the more comprehensive tracing techniques. A simple evaluation of the total runtime for an example application with Darshan enabled shows that there is no observable overhead introduced. At single node scale, the average instrumented runtime is 307.43 seconds compared to 309.25 seconds uninstrumented, demonstrating profiling overhead is effectively indistinguish-able from the impact of machine load. To verify this is the case at scale, we increase the node count to 64, observing an average runtime of 352.29 seconds (instrumented) compared to 352.33 seconds (uninstrumented).
Another benefit of this technique is the characterization of commercially sensitive applications, allowing transfer to a non-sensitive environment through recording individual func-tion call parameters. This portability of applicafunc-tion logs under sensitive conditions is seen as a necessary requirement for our future working goals.
A point of note is the level of the I/O software stack that Darshan monitors. At this time, it is possible to intercept POSIX and MPI-IO library calls, providing execution statistics from the middleware and serial I/O layers of the stack. As of version 3.0.0 the design of Darshan has become modular allowing for characterization data to be collected for additional interfaces, making it possible to produce information at the HDF5 level. Currently, this capability is not yet complete, but its future inclusion is predicted to extend the scope of our workflow’s abilities without warranty or representation.
B. Parameter Generation
Extraction of execution data from the compressed Darshan logs is handled firstly by the darshan-parser utility, and then through a series of Python utility scripts. As an intermediate step, the text generated by the parser is translated to a YAML file, from which an I/O access diagram can be generated to demonstrate the pattern of activity for the target application.
Following the creation of the log characterization YAML file, we can map the recorded application data to a set of usable input parameters for MACSio. To complete this mapping, a supervised generation tool is used to incorporate the collected I/O behavior statistics with any available user input. This provides a more accurate set of parameters than would be possible through a purely automatic translation process.
C. MACSio Library Plugin
An important requirement for any application we wish to replicate is the ability to demonstrate comparable behavior using the same elements of the I/O software stack. Develop-ing plugins for the same high level libraries used in target applications makes the process of verifying the replication process possible, in addition to forming the basis of tuning and optimization that can be applied to the original appli-cation implementation. Furthermore, the development of a range of plugins capable of replicating similar underlying I/O patterns is what gives MACSio flexibility to investigate different paradigms and implementation features.
To demonstrate a unique process of workload replication, we have implemented a plugin for MACSio that operates with the TyphonIO library interface, introduced in Section III-B. This implementation ensures that the parallel performance elements of TyphonIO are included in the MACSio replication, specifically the chunking and parallel shared file capability of the library. Additionally, the plugin has been constructed to demonstrate a multiple independent file approach, an al-ternative approach to that generally observed in TyphonIO applications.
V. WORKLOADREPLICATION
To illustrate our workflow acting as a proxy for the I/O pattern of real applications, we have completed the process of char-acterization and replication for the Bookleaf mini application,
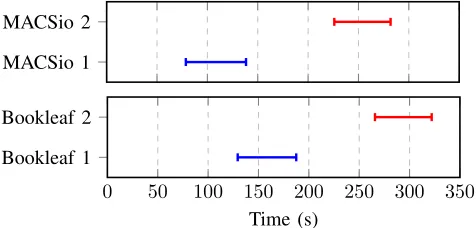
MACSio 1 MACSio 2
0 50 100 150 200 250 300 350
Bookleaf 1 Bookleaf 2
[image:4.612.314.552.579.693.2]Time (s)
1 2 4 8 16 32 64 4
8 16 32 64 128
# Nodes
T
ime
(s)
MACSio #1 MACSio #2 Bookleaf #1 Bookleaf #2
1 2 4 8 16 32 64
64 512 4,090 32,700 262,000
# Nodes
MACSio #1 MACSio #2 Bookleaf #1 Bookleaf #2
1 2 4 8 16 32 64
0.5 1 2 4 8 16 32 64
# Nodes
[image:5.612.88.259.590.686.2]MACSio #1 MACSio #2 Bookleaf #1 Bookleaf #2
Fig. 2. Overall file write time (left), cumulative time spent in writes across all ranks (centre) and duration of the slowest MPI-IO write operation (right)
which supports the TyphonIO library [19]. Bookleaf is a 2D unstructured Lagrangian hydrodynamics application, making use of a fixed check-pointing scheme that produces initial and final output files covering the complete dataset.
Bookleaf solves four physics problems: Sod, Sedov, Saltz-mann and Noh. The different inputs vary the computational aspect, but execution will remain the same with regards to I/O characteristics. For the purposes of our work, we use the Noh problem [20] input deck, in part due to its larger problem size providing a greater volume of data to handle.
For this study, the ARCHER supercomputing platform was used. ARCHER is a 4920 node Cray XC30 comprising two 12-core Ivy Bridge processors per node, giving a total of 118,080 processing cores. The system is backed by three Lustre filesystems, access to which is load balanced meaning users will be given access to one of the three filesystems based on project allocation. The file system used for our experimen-tation contains 12 OSSs, each with 4 OSTs. Each OST is spread across 10 4TB Seagate disks in RAID6 configuration, ensuring failure tolerance. One MDS is used per filesystem with a single MDT comprised of 14 600GB Seagate disks in RAID1+0. Finally, the filesystem is accessed via 10 LNet Router nodes in overlapping primary and secondary paths.
The general I/O pattern of Bookleaf outputs two distinct checkpoint files, at the beginning and end of the computation sequence, representing 125 MB datasets for the Noh large problem size. Each dataset is structured as an object hierarchy with the unstructured mesh object and nine associated mesh variables contained within a state object container. Notably,
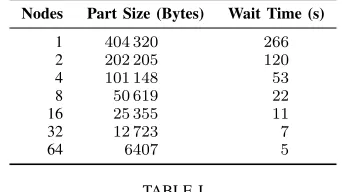
Nodes Part Size (Bytes) Wait Time (s)
1 404 320 266
2 202 205 120
4 101 148 53
8 50 619 22
16 25 355 11
32 12 723 7
64 6407 5
TABLE I
MACSIO INPUT PARAMETERS USED TO REPLICATEBOOKLEAF RUNS ON
ARCHER
TyphonIO operations in Bookleaf are issued from all processes and write to a single shared file independently, meaning there is no collective buffering or data aggregation enabled.
Due to the fixed problem size, scaling the application changes the distribution of the dataset across the available processors and hence reduces the size of the data chunk on each rank. As a result, the parameters controlling the dataset chunk size per rank and the length of the time between checkpointing vary in relation to the scale of execution.
From the characterization of Bookleaf, the parameters shown in Table I were extracted using our processing and generation tool. By modeling the relationship between the size of a data file and the composition of the dataset when using MACSio, it is possible to construct Equation 1. In this equation, F is the filesize, P r is processor count, P S
is the part size, V ars is the number of dataset variables and α, β, γ, δ, ψ and η are constants. The determination of these constants is calculated automatically from MACSio file generation trials. Taking this expression and substituting the known checkpoint file size for Bookleaf and the processor count as the application scales, we have generated the data chunk sizes given in the second column of the parameter table.
F=P r(P S(αV ars+β) +γV ars+δ) +ψV ars+η (1)
The third column in Table I is the wait time, which rep-resents the measured time buffer between I/O actions during execution. Determining this value is straightforward using the operation timestamps recorded by Darshan for the beginning and end of I/O operations on each file. The final configura-tion opconfigura-tion required to mimic Bookleaf accurately requires disabling the collective buffering behavior handled by HDF5. The absence of recorded collective reads and writes in the Bookleaf log files is used to indicate that a purely independent I/O strategy has been adopted and thus, this is something that our replication should adopt to verify correctness.
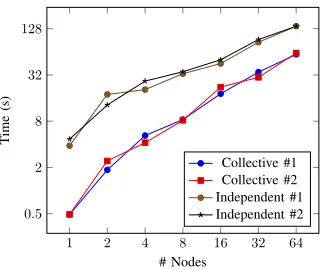
1 2 4 8 16 32 64 0.5
2 8 32 128
# Nodes
T
ime
(s)
[image:6.612.96.257.47.182.2]Collective #1 Collective #2 Independent #1 Independent #2
Fig. 3. Collective vs Independent Write Time comparison using MACSio
is smaller and the addition time is not currently factored in to MACSio’s time buffers. This initial latency period is not something that will change the overall I/O behavior and we did not feel it would be necessary to make changes to MACSio to reflect it. Accounting for the additional 50 second latency period at the beginning of the MACSio execution pattern, the remaining access patterns align between the two applications, indicating that they have similar execution patterns.
Analyzing write times for each file, there is a clear linear increase as the number of nodes scales. Importantly, the write times for Bookleaf and MACSio are similar for both of the output files produced. Figure 2 shows the similarity between the write times for the two applications, suggesting that each file write action performed has a similar I/O footprint. Furthermore, the cumulative write time across all ranks shown in Figure 2, and similarities between slowest MPI-IO write operation in Figure 3, adds confidence to the two applications demonstrating similar behavior during their I/O phases.
We can increase our confidence in the behavioural simi-larity by considering further parameters taken from Darshan log files. Firstly, comparing the number of independent I/O operations intercepted at the MPI-IO layer, the counters vary consistently by a value of 8 for all node counts representing a difference of 1.5% for the smallest run of a single node. Similarly, the number of sequencial writes differs by a value of 7 for the smallest run and then maintains a consistent difference of a single operation for all other node counts.
Knowing that the sizes of files being generated are consis-tent in our MACSio replication and coupling the uniformness in execution times we can verify that the applications exhibit the same pattern of behavior. We can now demonstrate the flexibility of the proxy application replication by adjusting the way in which the TyphonIO and HDF5 libraries are performing their I/O operations. From characterization of Bookleaf, we identified that the collective I/O mode is not used, and hence there is no aggregation of data before performing writes. Figure 3 shows how the write times change when our MACSio plugin is reconfigured to use collective I/O operations for the Bookleaf workload instead of the default independent approach. The performance of the workload can be seen to be consistently better when using the collective strategy over
independent, which is due to a reduction in the amount of data requests made through aggregation on a subset of the processors performing the simulation. Performing this change requires a simple configuration change to the MACSio input parameters, something that would require code changes and recompilation in the original application. With a simple library tweak, we have identified a possible performance improvement when running Bookleaf with the file system configuration deployed on ARCHER. It may however be the case that a different file system configuration does not offer the same speedup, making our proxy useful for justifying a collective I/O strategy without needing to port the original application.
VI. CONCLUSION ANDFUTUREWORK
We have presented a workflow demonstration to replicate the I/O activity of HPC applications using characterization and a configurable proxy application. Using an open source mini-application, we have conducted preliminary tests to show that our approach can identify and mimic the pattern of execution with a reasonable degree of accuracy.
We have suggested a number of advantages to using auto-characterization as a way of representing I/O workflows. First, capturing execution statistics with a lightweight method is a worthwhile trade-off between manual descriptors and in depth tracing. The application logs recorded can be mined to extract pertinent data elements and form a representation of the I/O behavior, which is bolstered by user knowledge of the target application. Finally, a recreation can be achieved using the generated parameter set to exercise one of a number of library plugins, such as the TyphonIO plugin we have produced to enable optimization work to be carried out using MACSio.
As part of our future work, we plan to adapt the replication capability used here to handle more complex output file combinations and validate this across a breadth of applications. For example, it is often the case that checkpoint dump files are accompanied by visualization data files, usually containing a subset of the simulation data and following a slightly different I/O strategy. Factoring in differently structured data files into our I/O workload would add an extra degree of complexity to the log extraction and representation process, but would increase the variety of potential workload replications.
Benchmarking is often used to give a projection of the performance achievable from new platforms and tools, some-thing that can be invaluable when procuring new systems or experimenting with different software components. With this in mind, we hope to apply our workload replication to a real world procurement exercise to understand how new systems will perform under actual application workloads.
ACKNOWLEDGMENTS
This work was supported in part by AWE under grant CDK0724 (AWE Technical Outreach Programme).
The authors express thanks to the UK EPSRC for access to the ARCHER supercomputing platform.
REFERENCES
[1] M. A. Heroux, D. W. Doerfler, P. S. Crozier, J. M. Willenbring, H. C. Edwards, A. Williams, M. Rajan, E. R. Keiter, H. K. Thornquist, and R. W. Numrich, “Improving Performance via Mini-applications,”Sandia
National Laboratories, Tech. Rep. SAND2009-5574, vol. 3, 2009.
[2] S. Lang, P. Carns, R. Latham, R. Ross, K. Harms, and W. Allcock, “I/O Performance Challenges at Leadership Scale,” inProceedings of the Conference on High Performance Computing Networking, Storage
and Analysis. ACM, 2009, p. 40.
[3] S. Snyder, P. Carns, R. Latham, M. Mubarak, R. Ross, C. Carothers, B. Behzad, H. V. T. Luu, S. Byna et al., “Techniques for Mod-eling Large-scale HPC I/O Workloads,” in Proceedings of the 6th International Workshop on Performance Modeling, Benchmarking, and
Simulation of High Performance Computing Systems. ACM, 2015, p. 5.
[4] H. Luu, B. Behzad, R. Aydt, and M. Winslett, “A Multi-level Approach for Understanding I/O Activity in HPC Applications,” in 2013 IEEE
International Conference on Cluster Computing (CLUSTER). IEEE,
2013, pp. 1–5.
[5] S. A. Wright, S. D. Hammond, S. J. Pennycook, R. F. Bird, J. Herdman, I. Miller, A. Vadgama, A. Bhalerao, and S. A. Jarvis, “Parallel File System Analysis Through Application I/O Tracing,” The Computer
Journal, p. bxs044, 2012.
[6] K. Vijayakumar, F. Mueller, X. Ma, and P. C. Roth, “Scalable I/O Tracing and Analysis,” inProceedings of the 4th Annual Workshop on
Petascale Data Storage. ACM, 2009, pp. 26–31.
[7] B. Behzad, H.-V. Dang, F. Hariri, W. Zhang, and M. Snir, “Automatic Generation of I/O Kernels for HPC Applications,” inProceedings of the
9th Parallel Data Storage Workshop. IEEE Press, 2014, pp. 31–36.
[8] N. Liu, C. Carothers, J. Cope, P. Carns, R. Ross, A. Crume, and C. Maltzahn, “Modeling a Leadership-scale Storage System,” in
Inter-national Conference on Parallel Processing and Applied Mathematics.
Springer, 2011, pp. 10–19.
[9] N. Liu, J. Cope, P. Carns, C. Carothers, R. Ross, G. Grider, A. Crume, and C. Maltzahn, “On the Role of Burst Buffers in Leadership-class Storage Systems,” in 012 IEEE 28th Symposium on Mass Storage
Systems and Technologies (MSST). IEEE, 2012, pp. 1–11.
[10] P. Carns, R. Latham, R. Ross, K. Iskra, S. Lang, and K. Riley, “24/7 Characterization of Petascale I/O Workloads,” in 2009 IEEE
International Conference on Cluster Computing and Workshops. IEEE,
2009, pp. 1–10.
[11] H. Luu, M. Winslett, W. Gropp, R. Ross, P. Carns, K. Harms, M. Prabhat, S. Byna, and Y. Yao, “A Multiplatform Study of I/O Behavior on Petascale Supercomputers,” in Proceedings of the 24th International
Symposium on High-Performance Parallel and Distributed Computing.
ACM, 2015, pp. 33–44.
[12] J. Borrill, L. Oliker, J. Shalf, and H. Shan, “Investigation of Leading HPC I/O Performance using a Scientific-application Derived Bench-mark,” in Proceedings of the 2007 ACM/IEEE conference on
Super-computing. ACM, 2007, p. 10.
[13] H. Shan, K. Antypas, and J. Shalf, “Characterizing and Predicting the I/O Performance of HPC Applications using a Parameterized Synthetic Benchmark,” in Proceedings of the 2008 ACM/IEEE conference on
Supercomputing. IEEE Press, 2008, p. 42.
[14] J. Logan, S. Klasky, H. Abbasi, Q. Liu, G. Ostrouchov, M. Parashar, N. Podhorszki, Y. Tian, and M. Wolf, “Understanding I/O Performance Using I/O Skeletal Applications,” inEuropean Conference on Parallel
Processing. Springer, 2012, pp. 77–88.
[15] J. Logan, S. Klasky, J. Lofstead, H. Abbasi, S. Ethier, R. Grout, S.-H. Ku, Q. Liu, X. Ma, M. Parasharet al., “Skel: Generative Software for Pro-ducing Skeletal I/O Applications,” ine-Science Workshops (eScienceW),
2011 IEEE Seventh International Conference on. IEEE, 2011, pp. 191–
198.
[16] Y. Jin, X. Ma, M. Liu, Q. Liu, J. Logan, N. Podhorszki, J. Y. Choi, and S. Klasky, “Combining Phase Identification and Statistic Modeling for Automated Parallel Benchmark Generation,” ACM SIGMETRICS
Performance Evaluation Review, vol. 43, no. 1, pp. 309–320, 2015.
[17] M. Miller, “Design & Implementation of MACSio,” Lawrence Liv-ermore National Laboratory (LLNL), LivLiv-ermore, CA (United States), Tech. Rep., 2015.
[18] M. Folk, G. Heber, Q. Koziol, E. Pourmal, and D. Robinson, “An Overview of the HDF5 Technology Suite and its Applications,” in
Proceedings of the EDBT/ICDT 2011 Workshop on Array Databases.
ACM, 2011, pp. 36–47.
[19] UK Miniapp Consurtium, “Bookleaf Unstructured Lagrangian Hydro Mini-app,” https://github.com/UK-MAC, Last Accessed 2016-08-16. [20] W. F. Noh, “Errors for Calculations of Strong Shocks Using an
Arti-ficial Viscosity and an ArtiArti-ficial Heat Flux,”Journal of Computational