University of Warwick institutional repository: http://go.warwick.ac.uk/wrap
A Thesis Submitted for the Degree of PhD at the University of Warwick
http://go.warwick.ac.uk/wrap/71314
This thesis is made available online and is protected by original copyright. Please scroll down to view the document itself.
The demarcation of transcription factor binding sites
through the analysis of DNase-seq data
Jason Piper
Systems Biology Doctoral Training Centre
University of Warwick
A thesis submitted for the degree of Doctor of Philosophy
in Systems Biology
Supervisors: Sascha Ott and Constanze Bonifer
Contents
Acknowledgments i
Declaration iii
Abstract v
Abbreviations and Acronyms vii
1 Introduction 1
1.1 Motivation . . . 1
1.2 Overview . . . 2
1.3 Background . . . 3
1.3.1 Transcriptional regulation . . . 3
1.3.2 The chromatin landscape . . . 3
1.3.3 Regulation from a distance . . . 4
1.3.4 Characterising regulatory elements . . . 5
1.4 Identifying transcription factor binding sites . . . 9
1.4.1 Chromatin immunoprecipitation . . . 9
1.4.2 DNase I footprinting . . . 12
1.4.3 DNase-seq for identifying transcription factor binding sites . 14 1.5 Analysing transcription factor binding data . . . 18
1.5.1 Peak calling . . . 18
1.5.2 Digital genomic footprinting . . . 19
1.5.3 Identifying DNA binding motifs . . . 20
1.6 Introduction to the thesis . . . 22
2 Footprinting analysis of DNase-seq data 25 2.1 Motivation . . . 25
genomic footprints from DNase-seq data . . . 26
2.4 Supplemental material . . . 39
2.5 pyDNase documentation . . . 76
2.6 Corrigendum . . . 89
3 Differential DNase-seq footprinting 91 3.1 Motivation . . . 91
3.2 Contributions . . . 92
3.3 Differential DNase-seq footprinting identifies cell-type determining transcription factors . . . 92
3.4 Supplemental material . . . 101
3.5 pyDNase 0.2.0 footprinting tutorial . . . 108
4 Discussion 119 4.1 Footprinting analysis of DNase-seq data . . . 119
4.2 Application of Wellington to clinical samples . . . 122
4.3 Differential DNase-seq footprinting . . . 123
4.4 Outlook . . . 126
4.5 Conclusions . . . 129
Bibliography 131
Appendix A Identification of a dynamic core transcriptional net-work in t(8;21) AML regulating differentiation block and
Acknowledgments
I would like to thank my supervisors Sascha and Conny, for their support and unfaltering tolerance of my energetic tendencies over the last four years. I would
also like to thank (in no specific order) Hugo van den Berg, Peter Cockerill, Pierre
Cauchy, Nigel Dyer, Peter Krusche, Markus Elze and Salam Assi, who were also
critical to my academic development and the overall success of the project. And
to Anne Maynard, Sarah Shute, and Brent Kiernan, who kept the cogs turning
and the funding flowing.
Words cannot explain how much love I have for my fellow PhD students and
housemates Jess, Markus, Sam, and Jess, (and Tom, for a bit, at least) who en-dured late night discussions about ChIP-seq, motifs, DNase-seq, and other things
completely irrelevant to their own work. Along with my other new friends - Shona,
Claudia, Kat C, Cat S, Kate R, Paul H and everyone in the Systems Biology and
MOAC DTCs, they are without a doubt some of the best people I have the
plea-sure of being friends with. This chapter of my life was far harder to finish than
any of the chapters presented here.
To old friends (you know who you are) that have stuck around even when I
disap-peared for 4 years to do ‘something to do with DNA.’ I’m very sorry for missing the Avondale Road mince pie party.
And to my family, who never seem to be too far away (for better or for worse), and
to whom this thesis is dedicated. Everything here has only been possible because
Declaration
This thesis is submitted to the University of Warwick in support of my application for the degree of Doctor of Philosophy. It has been composed by myself and has
not been submitted in any previous application for any degree. A ‘Contributions’
section prefaces each results chapter, outlining the work performed by myself, and
Abstract
Abbreviations and Acronyms
-seq sequencing
AML Acule Myeloid Leukaemia
ATAC Assay for transposase-accessible chromatin
AUROC Area Under the Receiving Operating Characteristic
ChIP Chromatin Immunoprecipitation
DHS DNase Hypersensitive Site
DNA Deoxyribonucleic Acid
dsDNA double stranded DNA
DNase Deoxyribonuclease
ENCODE Encyclopedia of DNA Elements
FACS Fluorescence Activated Cell Sorting
FAIRE Formaldehyde Assisted Isolation of Regulatory Elements
HAT Histone Acetyltransferase
HDAC Histone Deacetylase
PCR Polymerase Chain Reaction
PIC (Transcription) Preinitiation Complex
PWM Position Weight Matrix
PSSM Position Specific Scoring Matrix
ROC Receiving Operating Characteristic
Introduction
1.1
Motivation
Understanding the information encoded in the genome requires the study of how
transcription factors can recognise DNA sequences in order to coordinate gene
ex-pression. The motivation behind the work presented in this thesis stems from the
need for a high-throughput assay to identify occupied transcription factor
bind-ing sites without the use of antibodies, as used in chromatin immunoprecipitation (ChIP) experiments, which are currently considered the ‘gold standard’ for
iden-tifying protein-DNA interactions. In this thesis, I will introduce digital DNase
I footprinting, and illustrate how it can be used as a complementary method to
genome-wide ChIP experiments (ChIP-seq) for the global identification of
occu-pied transcription factor binding sites. At the onset of this PhD project, digital
footprinting after DNase-seq1 was a novel technique, having only been described
two years earlier [1]. Due to the unique challenges presented by the data, there
were only a handful of laboratories performing DNase-seq and even fewer with the
necessary experience to analyse the data. Here I sought to develop software to facilitate the analysis of high-read depth DNase-seq data with the aim to
iden-tify DNA-sequences occupied by transcription factors, and evaluate the extent to
which DNase-seq is an accurate assay for determining transcription factor binding
sites by benchmarking current analysis methods and other transcription factor
binding assays alongside these novel analyses.
1.2
Overview
This thesis is presented in the format of a thesis based on publications, with a brief
introduction and discussion. Each results chapter is composed of novel research that has either been submitted or accepted for publication in a peer-reviewed
jour-nal. Each of these chapters are prefaced with a statement outlining the motivation
for, and overview of, the research, and personal contributions towards the work
performed.
TheIntroduction provides the motivation for the work conducted and concisely
introduces methodological aspects of the thesis that are used extensively but not
described in subsequent chapters: classical methods for identifying transcription
factor binding sites, chromatin immunoprecipitation, DNase footprinting, and
mo-tif finding.
The first paper [2], referred to as theWellington paper, extends the introduction by providing a comprehensive overview and critical analysis of current methods of
analysing DNase-seq data. Here, a novel method to identify transcription factor
binding sites from DNase-seq data, called Wellington, is described. Wellington
is objectively benchmarked against both ChIP-seq and previous algorithms
de-signed for the analysis of DNase-seq data, showing that Wellington outperforms
previously described methods across almost all performance metrics. Alongside
Wellington, pyDNase, a software package to facilitate the analysis of DNase-seq
data, is also described.
The second paper, referred to as the differential footprinting paper, advances
the Wellington method developed in theWellington paper to allow the comparison
of two datasets in order to identify differentially occupied protein binding sites
be-tween two DNase-seq datasets. A comparative analysis of DNase-seq experiments
with cells from healthy donors over a range of cell types illustrates the possibility
of using differential footprinting to inform gene expression prediction models. This
paper also describes several improvements to the underlying pyDNase software
li-brary, including increases in speed, new analysis scripts, the ability to correct for
DNase I cutting bias when visualising data, and a DNase-seq analysis tutorial for
those new to DNase-seq analysis and footprinting.
A summary of the work alongside an outlook on DNase-seq footprinting and
1.3.1
Transcriptional regulation
Transcriptional regulation is one of the many underlying mechanisms by which the cellular state can be modulated. In single-celled organisms, genes are switched on
and off in response to changing levels of nutrients and other intra- and extracellular
cues. While the same is true for multicellular organisms, transcriptional regulation
is also pivotal to the ability to utilise a single genome in order to generate a
multi-tude of cell types. This cellular differentiation is driven by tissue-specific patterns
of gene expression that are guided by spatial, temporal, and environmental cues
throughout development during the lifetime of an organism [3].Although it may
be biologically feasible for protein levels to be completely regulated at the
post-translational level, this is not the case, and transcriptional regulation underpins genetics and is fundamental to all life.
The correct tissue-specific and temporal function of the genome is tightly
con-trolled by transcription factors, proteins that bind specific DNA sequences in order
to regulate gene expression. Upon binding, transcription factors can recruit other
proteins to modulate gene expression or alter chromatin architecture. In the most basic example, a transcription factor binds directly adjacent to the transcriptional
start site (TSS) of a gene (the promoter), recruiting the transcription pre-initiation
complex (PIC), which is responsible for the positioning of RNA polymerase II
at the TSS, leading to the transcription of the gene into RNA, thus promoting
gene expression [4, 5]. Conversely, transcriptional repressors can down-regulate
transcription by various mechanisms such as inhibiting the assembly of PIC, or
preventing other promoting transcription factors from binding [6].
1.3.2
The chromatin landscape
The ability for a transcription factor to promote gene expression is conditional on
the ability of the transcription factor to physically contact (bind) the DNA. In eukaryotes, the majority of nuclear DNA is bound to histone proteins and as a
consequence is transcriptionally silent [7, 8]. Heterooctameric histone complexes
are encircled by 147bp of DNA, resembling a thread around a spool — a complex
known as a ‘nucleosome.’ Nucleosomes form interactions with scaffolding proteins
(the most abundant of which is histone H1) in order to form compact chromatin
fibres [9] (Figure 1.1).
Figure 1.1: The role of nucleosomes in chromatin packing. A diagram-matic representation of naked genomic DNA, a single nucleosome, loosely packed euchromatin, and a densely packed 30nm heterochromatin fibre. Adapted from [10].
the nucleus of each cell to fit within the confines of the nucleus, and provides an
ad-ditional layer of genetic regulation. Chromatin is often described of as being in two
states — ‘open‘ and ‘closed‘ (or ‘accessible’ and ‘inaccessible’ to transcription
fac-tors). Consistency or alteration of covalent modifications of the N-terminal histone
protein tails leads to the maintenance of the current chromatin state, or a
remod-elling cascade that can lead to nucleosome repositioning or removal (depletion)
by chromatin remodelling complexes [11]. These histone modifications themselves
can be driven by transcription factors that indirectly promote the opening of
chro-matin (pioneering factors) [12], close the chrochro-matin (repressors), or maintain the current chromatin state. The ability of a transcription factor to bind a consensus
sequence and promote gene expression is therefore often limited by the
accessi-bility of the DNA to the transcription factor due to chromatin packing — in any
given sample of human cells, roughly 90% of the genome is ‘closed chromatin.’ A
good review of chromatin architecture in the context of DNase Hypersensitivity is
provided in [13].
1.3.3
Regulation from a distance
In eukaryotes, the transcription of genes is not only regulated via their promoter, but by distal enhancers as well. Enhancers are regulatory regions of DNA that
Conservative estimates place the number of enhancers in the human genome at
> 100,000 [16]. Liberal estimates place this as high as 2,900,000, which vastly
outnumbers the ca. 25,000 protein coding genes in the human genome. Enhancer
activity is highly cell type specific [17], with only around 200,000 enhancers being
active at any one time [18]. Enhancers, like promoters, are also bound by
transcrip-tion factors. They functranscrip-tion via the inductranscrip-tion of chromatin looping, making contact
with and activating one or several distal promoters [19]. Conversely, enhancers can
also be bound by silencing factors that can inhibit the transcription of genes by
various mechanisms. Neuron-Restrictive Silencer Factor (NRSF), for example, in-hibits the expression of neuronal specific genes in non-neuronal tissues by binding
to enhancers with the Neuron-Restrictive Silencer Element (NRSE) sequence,
re-cruiting histone deacetylases (HDACs) that lead to histone hypomethylation and
inducing chromatin packing, silencing the enhancer [20]. The most abundant
tran-scriptional repressor, CTC-binding factor (CTCF), however, inhibits the action
of transcription factors via a different mechanism, inhibiting chromatin looping
preventing the contact of nearby enhancers to their target promoters [21]. This
illustrates the complex many-to-one relationship of enhancer effects on gene
ex-pression, whereby gene promoters integrate the signals from many gene-promoting and gene-repressing enhancers, themselves only active in specific contexts, in order
to regulate gene expression.
1.3.4
Characterising regulatory elements
The publication of the finished sequence by the human Genome Project in 2004
[22] was a milestone in genomics, however, much work was still required to identify
all the functional elements of the genome such as protein coding and non-protein code genes, alongside regulatory elements (also known as functional non-coding
regions) such as promoters and enhancers. The US National Human Genome
Research Institute (NHGRI) launched the Encyclopedia of DNA Elements
(EN-CODE) project consortium with the aim of annotating functional elements in the
human genome over multiple cell lines 2. The results from the pilot study on
just 30Mb (1%) yielded a wealth of results, which not only recapitulated known
methods of genetic regulation that had not previously been characterised on a
systems level, but also revealed novel information [23]. One example is the finding
2The biggest criticism of the ENCODE project is its decision to use cell lines and not healthy
that specific transcription factors previously thought to only bind gene promoters
were found to bind to enhancers, and regulatory elements previously annotated as
enhancers were discovered to be novel promoters for unannotated transcripts.
Discovering promoters is a relatively simple task achieved by identifying the
region directly adjacent to a transcriptional start site. Unlike protein coding genes,
there are no sequence-specific elements that accurately predict the presence of an
enhancer although some sequence features, like increased CG content and sequence conservation are highly correlative. As part of the full ENCODE project, the
EN-CODE project consortium employed several high-throughput genomic techniques
in an attempt to identify and characterise regulatory elements, including the
iden-tification of transcripts through CAGE-seq [24] and RNA-seq [25], transcription
factor binding sites via ChIP-seq and DNase-seq, and the determination of
chro-matin structure via ChIP-seq, MNase-seq [26], FAIRE-seq [27], and DNase-seq.
Whilst these assays have helped identify putative enhancers and distal
regula-tory elements, the knowledge of their existence by themselves does not provide
characterise the action of these regulatory elements.
The data and analyses from the ENCODE project has been pivotal in
fa-cilitating our understanding of the genome, in particular, provided a wealth of
information characterising the location of the non-coding regulatory elements in
the human genome. However, the characterisation of these regulatory elements in
the human genome has proven to be challenging. Given the approximately 1500
transcription factors, and the large number of enhancers that are estimated to be active in any one cell type at any given time [28], the functional characterisation of
all of these elements is a monumental task that will require many different assays
and analyses, and ENCODE has only scratched the surface.
Even with the knowledge of the location and the known transcription factor
binding sites in an enhancer, it remains difficult to predict the genes are under the
control of a specific transcription factor. There are, however, certain histone
mod-ifications (H3K27ac and H3K4me1) that are associated with active and inactive enhancers, along with specific co-activators (p300) that have been found to bind
to active enhancers. It is thought that by understanding the specific combinations
of transcription factors that bind regulatory elements, an ‘enhancer grammar’ can
be inferred that enables the prediction of enhancers in silico.
The ENCODE project has provided a wealth of data about regulatory elements
that have illustrated the importance of enhancers in evolution. It has been known that GWAS SNPs are enriched in non-coding regions, and with the
librium with those elements [29, 30]. Moreover, evidence suggests that evolution
is accelerated at non-coding regulatory elements [31]. Regulatory elements offer
efficient ways to make phenotypic changes to an organism through only a small
number of nucleotide polymorphisms which change the regulatory phenotype of a
gene. In one such example of evolution through regulatory elements, Single
Nu-cleotide Polymorphisms (SNPs) were identified via quantitative trait loci (QTL)
analysis that were associated with the absence of pelvic fins in a specific
sub-population of sticklebacks lost through divergent selection; Transfecting embryos
with an edited enhancer led to the reestablishment of pelvic fins [32], reinstating phenotypes that had been lost through selection. Individual SNPs in enhancers
that are sufficient to disrupt a single transcription factor binding site have been
shown to alter chromatin structure, causing the chromatin to close and prevent
activation of the enhancer [33].
However, the types of assays performed by the ENCODE project that
charac-terise the location, and in some cases, the transcription factor binding sites, do not
identify where in the genome an enhancer is acting. Whilst expression
quantita-tive trait loci (eQTL) is able to correlate changes in gene expression to regulatory
elements these studies require very large samples in order to gain statistical power
and it is impossible to show correlation vs causation. In addition, eQTL studies
have been shown to be highly cell-type specific, which is probably due to the cell
type specificity of enhancers leading to variants in regulatory regions only affect-ing those cell-types in which the enhancer is active [34]. Beyond computational
and statistical methods, there are several high-throughput biological methods for
identifying long-range interactions in a genome such as contact between enhancers
and promoters. These methods rely on cross-linking cells with formaldehyde in
order to freeze the cell in time. The DNA is then digested with a restriction
en-zyme in order to generate globules of cross-linked protein with strands of DNA
intertwined. A variety of different techniques are then used to ligate DNA that
were spatially near to each other in the cell, which can then be sequenced in order
to determine the chromatin interaction landscape (Figure 1.2).
These ‘3C’ based techniques include chromosome conformation capture (3C)
[36], circularised chromosome conformation capture (4C) [37], chromosome
con-formation carbon copy capture (5C) [38], Hi-C [39], and chromatin interaction
analysis by paired-end tag sequencing (ChIA-PET) [40]. Whilst these tools give an idea of the long-range interactions of enhancers and promoters, they do not help
Digestion Ligation Purification
Immuno-precipitation
Ligation product library
Ligation product library
3C 4C 5C Hi-C
ChIA-PET Purification
Figure 1.2: Methods for identifying higher-order chromatin interactions.
Various methods exist for identifying long-range chromatin interactions. These ‘3C’ based techniques cross-link chromatin with formaldehyde in order to isolate regions of DNA that are co-located in physical space. These regions are then circularised and sequenced, where each half of the sequencing read originates from one genomics location in contact with the other half. Image adapted from [35].
behind the enhancer/promoter contact. In order to piece together a system-wide
view of gene regulation — the identification of active enhancers and
characteri-sation of how these enhancers function in order to regulate their target gene(s)
— a multitude of assays must be integrated. Information on transcription factor
binding sites, long-range chromatin interactions, gene expression, histone
modifi-cations, mutation, genetic variants, amongst others, need to be analysed in concert in order to construct a complete model of transcriptional regulation in the human
1.4.1
Chromatin immunoprecipitation
Currently, the gold-standard high-throughput method for identifying
transcrip-tion factor binding sites is ChIP-seq. Almost all methods that aim to predict
transcription factor binding sites have used ChIP-seq recapitulation as the
vali-dation metric. Both of the results chapters in this thesis will refer to ChIP-seq
data, so a brief overview of the protocol, along with comments on the benefits and
limitations, are outlined here.
The first stage in a ChIP-seq experiment is the cross-linking stage.
Formalde-hyde is added to live cells, reacting with the protein in the cell and resulting in
neighbouring proteins becoming cross-linked through the formation of methylene
bridges. DNA becomes trapped in this matrix of cross-linked proteins, providing
a snapshot of the protein-DNA interactions in a population of cells. Cells are
lysed, and the protein-DNA matrix is extracted and sonicated in order split the
mixture into protein-bound fragments of DNA between 100 and 300 base pairs in length. An antibody for a protein of interest is then used together with a solid
matrix to which it binds to enrich fragments of DNA bound by the target
pro-tein. The cross-linking process can be easily reversed by heating in water, yielding
fragments of DNA that were bound to the protein of interest, either directly or
indirectly. These fragments are then analysed by high-throughput sequencing,
and are mapped to reference genome of the organism being studied in order to
determine the genome-wide binding sites of the protein of interest [41] (Figure
1.3).
Analysing ChIP-seq data allows for the identification of putative binding sites
with a resolution in the range of 400—2000bp. Because of this, it can extremely
difficult to identify whether the protein of interest is directly or indirectly binding a
given region unless further experiments are carried out, and results from ChIP-seq
experiments can yield numerous false positives. Therefore, ChIP-seq experiments
are often required to be validated through other experimental means. One such method to address this issue is ChIP-exo [43] (Figure 1.4). An exonuclease is used
to trim the overhanging fragments surrounding a transcription factor complex.
This method has not yet gained widespread adoption, with only a handful of
publicly available datasets (43 as of 13th December 2014 contrasted with 11,443
ChIP-seq datasets) in the Gene Expression Omnibus [44, 45].
protein of interest
5 3 3
5
3
3 5 5
3 5
3 5 5 3 5
3
3 5 5
3
first adaptor primer
second adaptor
High throughput sequencing
lambda exonuclease
Chromatin immunoprecipitation
Ligate adaptors
Exonuclease digestion
LM-PCR with primers to first adaptor
Ligate second adaptor, amplify DNA with LM-PCR
Figure 1.4: Chip-exo. A standard ChIP protocol is followed, however, before
elution, the 5′ end of the bound DNA fragment is trimmed using lambda
exonu-clease, so the 5′ end of the DNA flanks the protein-DNA interaction. These 5′
requirement that a highly specific, high-affinity antibody must be raised against
the protein of interest. This limits experiments to one protein per sequencing run,
as well as to proteins that are already of interest and known. The inability to
distinguish between direct and indirect binding to the DNA is another major
lim-itation of ChIP-seq. The absence of the target transcription factors corresponding
to DNA binding motifs provides evidence of indirect binding, however the mere
presence of a motif is not a good indicator that the protein is directly bound. In
addition, epitope masking can occur, in which the antibody used in the
immuno-precipitation is unable to recognise the target protein. Solutions such as epitope
tagging with an accessory protein (e.g. GFP) can be utilised to mitigate this prob-lem. Epitope tagging can also allow the study of proteins for which no antibody is
available, but this could interfere with the cellular function of the epitope tagged
protein (a review highlighting the technical considerations for ChIP-seq can be
found [47]).
1.4.2
DNase I footprinting
The identification of protein-DNA interactions via DNase I began with the
obser-vation that upon ultraviolet irradiation, the breakage of DNA of the E. coli lac
operator was diminished at specific sites by the presence of the lac repressor [48],
and similarly, the ability of dimethylsulfate (DMS) to methylate purines
(preferen-tially guanines) was also inhibited by the presence of a bound protein interacting
with these bases [49]. The ability of a DNA binding protein to shield the DNA from damage was harnessed in a technique called deoxyribonculease I (DNase I
3) footprinting [50]. DNase is a eukaryotic endonuclease that cleaves the DNA
phosphodiester backbone adjacent to pyrimidic bases on one strand at a time i.e.
introduces ‘nicks’. It has an observable sequence specificity [51–54], where the
phosphodiester bonds adjacent to specific sequences are hydrolysed with
prefer-ence over several orders of magnitude. However, even though this bias exists, it is
unlike a bacterial restriction enzyme in that it does not have a recognition site.
In the original DNase footprinting protocol, by subjecting a protein-DNA
com-plex to DNase I cleavage, a southern blot was be used to visualise where the DNA
is bound by a protein. DNase is unable to cleave DNA where protein is bound,
but is able to cleave directly adjacent (as much as steric hindrance allows) to the
protein-DNA complex and anywhere else where the DNA is not bound to a
pro-3Interestingly, DNase was originally referred to as ‘DNAase’[50] and has at at some point lost
complex is subject to digestion by DNase I. The DNA fragments generated by this process are subject electrophoretic separation, where a ‘footprint’ is left by the protein contacting the DNA and preventing DNase I digestion. Image courtesy [55].
tein. This method was coupled with DNA sequencing (at the time of discovery,
Maxam-Gilbert sequencing) in order to identify the sequence of the protein-DNA binding site. DNase footprinting provided conclusive evidence that transcription
factors bind specific DNA sites based on their sequence (Figure 1.5).
DNase footprinting was quickly adapted for in vivo use via ligation-mediated
PCR (LM-PCR) [56]. Whether whole cells or isolated nuclei are subjected to
DNase digestion, and regions of interest are amplified via single-stranded PCR using primers flanking the region of interest. As nicks introduced by DNase will
prevent elongation by DNA polymerase, the PCR fragments will abruptly
ter-minate in regions where DNase is able to cleave the phosphodiester backbone.
In regions where a protein is bound, fewer nicks will be present and the PCR
reaction will rarely terminate in these regions. Linkers are then ligated to the
single-stranded DNA fragments and primers against these linkers utilised to
re-constitute the complementary strand of DNA. This ability to characterise the
activity of transcription factors in their native environment is critical to
under-standing genetic regulation. DNase footprinting methodology remained largely unchanged as a single locus assay for 30 years, and was restricted to the study of
the assay. During this time, in terms of the number of experiments submitted to
the main online data repositories, the Gene Expression Omnibus (GEO) and the
Sequence Read Archive (SRA), ChIP-seq remained the most popular assay for the
determination of transcription factor binding sites.
High-throughput DNase I assays
In 2004, two member groups [57, 58] of the ENCODE consortium developed
re-newed interest in DNase as a tool to identify regulatory regions by using the
cleavage activity of DNase to map thousands of so-called DNase Hypersensitive
Sites (DHSs). In order for regulatory regions to function, nucleosomes are
dis-placed, revealing regions of ‘open’ chromatin whereby the DNA becomes
accessi-ble to transcription factors. These regions, often 200-2000bp in length, are much
more sensitive to cleavage by DNase than ‘closed’ chromatin i.e. DNA that is bound to nucleosomes. The authors showed that short fragments of DNA isolated
from DNase cleavage reactions aligned to known regulatory regions in the human
genome, namely known enhancers and promoters .
Shortly afterward, the use of DNA microarrays was employed [60] in order
to provide the first high-throughput screen for DHSs, and with the increased
af-fordability of next-generation high-throughput sequencing technologies, DNase
di-gestion was coupled with high-throughput sequencing (DNase-seq), providing the
first unbiased assay for identifying active regulatory regions [1, 60]. The specific
method used for library preparation was introduced as the ‘single hit’ method, Figure 1.6, with the slight disadvantage that sequence fragments generated by
the single-hit method are limited to 20bp, which although theoretically mappable,
is at the lower limit of acceptable read length to be able to align to the human
genome.
1.4.3
DNase-seq for identifying transcription factor
bind-ing sites
Unlike the work undertaken by Galas and Schmitz [50], the sequencing depth of
these assays was insufficient to distinguish areas of protection from DNase cleavage
by bound proteins, but the method identified potential regulatory elements in the
human genome. It was not long, however, before this method was adapted as a
high-throughput method to identify DNase I footprints in vivo. High-throughput
sequencing platforms typically sequence 20-72bp of a ca. 300bp fragment in the 5′
Figure 1.7: The ‘double-hit’ DNase-seq method. Cells are subjected to
DNase I digestionin vivo, where DNase I is only able to digest DNA in regions of
open chromatin where the DNA is unbound by protein. Fragments generated by this process that pass a size-selection threshold are isolated and then sequenced. Adapted from [62].
the 5′ end of the aligned sequence corresponds to where the DNA has been cut
by the DNase, and the 3′ end corresponds to the sequence length limit of the
sequencer. By aligning reads to the genome and identifying the location of all the
5′ ends of the sequenced fragments, the genomic position where DNase has cut
DNA can be established.
Yeast was chosen as the first organism for this assay, which the authors named
‘digital genomic footprinting’ [61] for two main reasons. Yeast’s small genome
(12Mb) yields 400× the sequencing depth compared to the same number of
se-quencing reads on a human sample, and the transcription factor binding sites within the yeast genome are well classified, providing a simple method of
vali-dating the results from this novel technique. Although these experiments did not
provide much in the way of elucidating any novel biological results, they provided
proof of principle that DNase digestion followed by high-throughput sequencing
could identify transcription factor binding sites in vivo.
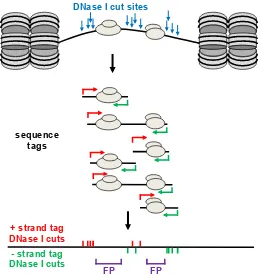
sequence tags
+ strand tag DNase I cuts
FP FP
[image:29.595.173.465.81.392.2]- strand tag DNase I cuts
Figure 1.8: DNase-seq Footprinting. Classical DNase I footprinting can be
adapted into a whole-genome study by using the 5′ end of aligned sequence tags
as a measure of DNase I cutting. By subjecting cells to digestion by DNase I and
isolating sub-nucleosomal fragments (<150bp), the 5′most end of aligned sequence
tags will occur in protein-DNA binding sites less often than of neighbouring regions due to protection of the DNA from DNase I cleavage.
‘double-hit’ protocol [63], the ligation of MmeI linkers and digestion was replaced
by a simple size selection step (Figure 1.7). Regions of open chromatin are digested
with DNase I at the correct concentration that provides two ‘cuts’ per DNase
hypersensitive site. The fragments that span the protein-DNA binding sites are
isolated using size selection on an agarose gel or via ultracentrifugation using a
sucrose column. These data can can be analysed in order to detect protein-DNA
binding events (footprints) (Figure 1.8).
The assay is extremely sensitive to the precise distribution of fragment sizes,
with fragments less than 50bp resulting in fragments that span the protein-DNA
binding site, which is best suited for footprinting [52]. Fragments larger than 150bp often span entire nucleosomes, and these larger fragments are not suitable
size-selection, orin silicosize selection following paired-end sequencing, DNase-seq
can be used not only to find transcription-factor binding sites, but also nucleosome
positions [64]. Over 90% of DNase-seq data in the public domain (almost all of
which is part of the ENCODE project) have been generated with this simpler
‘double-hit’ method, with only the very early experiments using the older
single-hit method.
1.5
Analysing transcription factor binding data
1.5.1
Peak calling
The basic analysis of both ChIP-seq and DNase-seq data is to identify where in
the genome the protein of interest is binding ,or in the case of DNase-seq, the
identification of DHSs. The aligned sequence tags are analysed to find regions of the genome where the number of reads that have been aligned is statistically
significantly higher compared to a background model, whereby the exact statistical
methods used vary between the tools used to identify the peaks. These binary
predictions partition the genome into regions where the protein is bound to the
DNA (peaks) and regions where it is not.4 When analysing ChIP-seq data, the
scores assigned to these regions are often used as evidence of the ‘strength’ of
binding. However, as there is no easy method of determining the heterogeneity
of transcription factor binding in the population of cells used in the assay, it is
not possible to differentiate between a protein binding weakly in all cells in the population, or binding strongly in a subpopulation. A wide variety of tools have
been developed to fulfil the purpose of peak calling, and the sophistication of these
methods ranges from using a simple sliding window to calculate the sum of reads
in an area, to methods that consider the signal on a single base-pair resolution,
Hidden Markov Model based approaches, and those that correct biases in the
underlying library preparation protocols and sequencing methods used to generate
the data. Much could be said about the approaches taken to analyse ChIP-seq
data, with different ChIP-seq peak callers yielding peaks that drastically alter
the biological interpretations of the downstream analyses (reviewed extensively in [65]).
4There is much to be said about such a binary view on the protein-DNA landscape, whereby
For ChIP-seq analyses, identifying regions of enrichment (peaks) followed by motif
searching (outlined in Section 1.5.3) is the preferred analysis in order to identify the
transcription factor binding sites. Similar analyses can be performed on
DNase-seq data through the identification of motifs in DHSs, but there can be between
2—100×the number of DHSs in a DNase-seq experiment compared to a ChIP-seq
experiment, with the number of DHSs per cell line ranging between 84,201 for
Th1, 142,986 for K562, and 266,618 H7-hESC [66], whereas the number of
ChIP-seq peaks ranging between 1,902 for NRF1 and for 45,732 CTCF in K562 cells
[2]. Because of the large numbers of DHSs detected, the number of transcription
factor binding DNA motifs present in these regions will far outnumber the number
of transcription factors that are actually bound, so this analysis can yield many
false positives. The power of DNase-seq is the ability to analyse the data in order
to demarcate transcription factor binding sites within DHSs (i.e. footprinting).
This can performed computationally by identifying short (<50bp) regions where
the number of 5′ sequence tags aligning to the genome is diminished due to a
protein-DNA interaction blocking digestion of the DNA by DNase. This process,
originally referred to as ‘digital genomic footprinting’ was first described using
data generated on the single-hit data in yeast, by searching for regions of depleted
5′ sequence tags in the data using a binomial test [61].
The first DNase-seq footprinting efforts on the human genome were performed using the early ‘single-hit’ data generated by the ENCODE project [67, 68]. These
methods used fundamentally different statistical analyses such as a Bayesian
Hi-erarchical Model and a Hidden Markov Model, respectively, to identify footprints.
DNase-seq data from 41 cell lines generated as part of the ENCODE project
pro-vided the first comprehensive overview of transcription factor footprints in the
human genome [66]. The authors also described their approach a novel algorithm
(namedAmbrose) for discovering footprints without motif information, along with
a set of footprints for 41 cell lines with ChIP-seq validation for a select few
tran-scription factors in K562 cancer cell line (discussed further in Chapter 2).
In contrast to ChIP-seq, DNase-seq footprinting provides a holistic approach
to identifying transcription factor binding sites. DNase-seq reveals that a specific
10-30bp fragment of DNA is bound, without identifying which protein is bound.
ChIP-seq determines which protein is binding a certain region, but not where it is bound, and whether it is binding directly or indirectly. Because of this, ChIP-seq
DNase-seq can be used to differentiate primary from secondary binding [66].
Sev-eral studies have shown that transcription factor footprints are able to recapitulate
the binding of almost all transcription factors, as well as the identification of novel
transcription factors. Several studies have commented on the false positive rate
of these analyses, commenting on both the lack of evolutionary conservation of
so-called ‘novel’ transcription factor binding sites [2, 69], and the possibility that
these false positives arise from unaccounted bias in DNase I cutting [52].
A thorough introduction to DNase-seq footprinting methodology is presented
in Chapter 2.
1.5.3
Identifying DNA binding motifs
After peak (or footprint) detection, the most fundamental downstream analysis of
transcription factor binding sites as determined by ChIP-seq is the identification
of the DNA sequence that a transcription factor binds to by analysing the set of
sequences identified by the peak calling process. Knowledge of the DNA sequences
that are preferentially bound by individual transcription factors (binding motifs)
allows the prediction of transcription factor binding sites within the genome, and supplements other genomic assays by being able to predict bound transcription
factors based on DNA sequence (e.g. the determination of binding partners or the
identification of common DNA motifs in gene promoters that may suggest
com-mon regulatory mechanisms). As most transcription factors exhibit degeneracy in
their ability to recognise DNA sequences, to represent the complete repertoire of
sequences that a transcription factor binds to, the position weight matrix (PWM),
also known as a position-specific scoring matrix (PSSM)[70] is frequently used.
For a set S of N sequences of length l that a transcription factor is known to
bind to, the elements of the PWM P are calculated as follows.
Pk,j = 1 N
N
∑
i=1
I(Si,j, k) (1.1)
where i∈(1, ...N), j ∈(1, ..., l),k ∈ {A, C, G, T}, and the identity function
I(a, k) =
1 if a=k
0 if a̸=k
PWMs are more intuitively visualised (Figure 1.9), where it is easily observed that families of transcription factors often have extremely similar PWMs (Figure
(a) NRF1 (b) CTCF (c) SP1
(d) Elk-1 (e) Ets-1 (f) Etv-1
Figure 1.9: Position Weight Matrices (PWM) can be represented
graph-ically to compare and contrast the binding characteristics of transcrip-tion factors. A graphical representation of the PWMs for three transcription factors containing different DNA binding domains highlights the difference DNA sequences bound (a,b,c), whereas three different transcription factors from the Ets family that that share similar binding domains have very similar PWMs (d,e,f) The height of the letters indicates the bits of information that the specific letter carries.
of the PWM to represent a protein’s DNA binding affinity makes the assumption that the effects of a nucleotide on the binding affinity of a protein are independent
of all other positions in the PWM, and is a simplistic method of representing a
complex biophysical interaction. Several more complex models for representing
DNA binding sites have been developed, most have not managed to significantly
improve on the PWM, which also had the added benefit that is simple to interpret
visually. There have been developments in the area of fitting the ‘best’ PWM for a
transcription factor, identifying the short 8-10bp sequences out of the 200—1000bp
ChIP-seq that the transcription factor recognises, and these various methods rely
on a number of statistical frameworks, comprehensively reviewed in [71].
The identification of the enriched set of motifs in a ChIP-seq dataset often
reveals more than the sequence that the immunoprecipitated transcription
fac-tor binds. As transcription facfac-tors do not bind on their own, but interact with other factors, secondary motifs found in ChIP-seq peaks provide insight into the
co-operative transcription factor binding partners of the protein of interest, and
therefore the protein-protein interactions of the target protein. The total number
of known human DNA binding motifs currently numbers in the thousands, and
sev-eral databases exist such as TRANSFAC [72], JASPAR [73] which have catalogued
them and which are constantly updated as a result of substantial high-throughput
screening studies. The amount of redundancy is large, as many transcription
fac-tors share common DNA binding domains, resulting in families of transcription
factors, with often diverse functions, that recognise similar DNA binding motifs (Figure 1.9). One extreme example is the ETS factor family of transcription
core motif of TTCC [74]. Coupled with the degeneracy of DNA binding proteins,
this many-to-many relationship where a single DNA binding site can be bound by
a myriad of transcription factors, and conversely a single transcription factor can
bind many different sequences with varying specificities illustrates the extremely
complex nature of the transcription factor landscape within the cell.
Because of the large number of DNA binding motifs, almost any given region
of the genome will contain scores of known DNA binding motifs.
1.6
Introduction to the thesis
DNase-seq is a high-throughput adaptation of a the classical DNase I Footprinting
assay [50] that can identify regions of open (active) chromatin. Through the use
of more sophisticated analyses, DNase-seq footprinting is able to demarcate
tran-scription factor binding sites with an accuracy of <30bp resolution [61].
DNase-seq data continues to be generated by public functional genomics consortia such
as the ENCODE and NIH Roadmap Epigenomics projects, and the application of
DNase-seq on mice [75], Drosophila [76], Arabidopsis [77], Rhesus monkeys, and
Chimpanzee [78] illustrate the versatility of the method. The DNase-seq method is
of great utility in organisms where little is known about transcriptional regulation.
In these cases, the power gained from DNase-seq footprinting is not recapitulating
results, but being able to study multiple transcription factors in one assay without
the requirement to either specify a protein of interest or obtain antibodies as used
in ChIP.
Despite this growing adoption of the method, prior to the work described in
this thesis, the options available for analysing DNase-seq data were sparse. Several tools designed for peak calling in ChIP-seq data have been coaxed into this role,
with tools such as MACS, FindPeaks, and HOMER being used to locate regions
of open chromatin, along with several DNase-seq specific peak callers specifically
for DNase-seq data, reviewed in [79]. For more fine-grained footprinting analyses,
even though a number of papers had been published either describing or utilising
footprinting analyses of DNase-seq data, there was no software available for
per-forming footprinting, the exception being CENTIPEDE which is not a de novo
footprinting method as it requires prior knowledge of genomic DNA binding motifs
for a transcription factor of interest (discussed further in Section 4.4).
The aim of this thesis is to build on the pioneering work performed on devel-oping the DNase-seq protocol, and the early attempts at footprinting DNase-seq
ods being used to validate these attempts. Here, Wellington, a novel algorithm
for identifying transcription factor binding sites is introduced, and benchmarked
against ChIP-seq data and the results of other algorithms. The strand imbalance
inherent in the DNase-seq library preparation protocol is shown to increase the
predictive power of transcription factor binding site predictions. pyDNase is also
introduced alongside Wellington, providing an easy to use and efficient
applica-tion programming interface (API) for interacting with DNase-seq data, along with
several convenient scripts for performing common analyses.
Chapter 3 builds on the methodological and analytical work performed in the previous chapter. An extension to the Wellington algorithm is presented that
allows for the ability to identify differential transcription factor binding in
com-mon DNase hypersensitive sites, along with significant computational performance
gains to the original method brought about by major refactoring of the code base.
The analysis of a number of samples from primary cell lines using this extension
identifies transcription factors that convey cell identity across the
haematopoi-etic lineage, and is able to illustrate how transcriptomic data can be linked to
Footprinting analysis of
DNase-seq data
2.1
Motivation
At the beginning of this project, several approaches to identifying footprints in
DNase-seq data had been described. One such method outlined the footprinting
analysis of yeast DNase-seq data generated using the single-hit method, with the authors providing a software implementation as a collection of scripts in MATLAB,
Python, and Bash [61]. Another approach developed on single-hit DNase-seq
data, but on human data, was CENTIPEDE [67] (which requires the locations of
DNA binding motifs in the genome a priori), implemented in R. Neither of these
tools were intuitive to use, requiring the DNase-seq data in non-standardised file
formats to produce footprint predictions. The authors of these studies provided
descriptions of these file formats and example files, but software to prepare these
files from the sequencing data was not provided. Two further methods existed for
which there was no software implementation available [66, 68], but the results of the analyses on several cell lines had been published.
Here, a comprehensive evaluation of the performance of these approaches to
identifying protein-DNA interactions in DNase-seq data on identical datasets was
performed, the first objective assessment of these different methods. As part of
this effort, a software library for interacting with the raw DNase-seq alignment
data called pyDNase was developed, in order to allow for the fast and efficient
generation of the non-standardised data formats required by CENTIPEDE [67]
and the Hesselberth Method [61].
intro-duced, that utilises a previously undescribed feature in the ‘double-hit’
DNase-seq protocol in order to increase the predictive power of DNase-DNase-seq footprinting.
Wellington was validated against ChIP-seq data, motif content, and phylogenetic
conservation scores across several cell types and between the two prevailing library
preparation protocols. Where data are available, Wellington was benchmarked
against other methods.
Here, a comprehensive suite of benchmarks over several criteria is presented
that illustrate the power of Wellington to accurately identify protein-DNA
interac-tions from DNase-seq data. In almost all circumstances, Wellington outperforms
previously described methods across almost all performance metrics. Wellington is provided as part of the pyDNase package, a free, open source, and easy-to-install
Python library. pyDNase was designed using modern software development
prac-tises such as unit tests, extensive documentation, and continuous integration in
order to maintain quality assurance throughout development of the tools.
2.2
Contributions
For this paper, I was responsible for the design of the study and the entirety of the design, development, and implementation of the underlying Wellington algorithm
and pyDNase software, the data analysis, figure generation, and the preparation
of the manuscript, with the following exceptions.
Markus Elze provided statistical consultation, aiding the refinement of an
ear-lier model for footprint detection. Markus Elze also significantly contributed to
the writing of Supplementary Sections 1.4, 1.6—10, and 1.13. Pierre Cauchy
pro-vided ongoing computational and analytical support and propro-vided the rightmost
panel of Figure S6 and the lower three panels of Figure S7. Peter N. Cockerill
contributed the figure and figure legend for Figure S3 and along with Constanze Bonifer and Sascha Ott, provided ongoing general guidance. All authors provided
comments and amendments to the manuscript during preparation and the peer
Wellington: a novel method for the accurate
identification of digital genomic footprints from
DNase-seq data
Jason Piper1,2, Markus C. Elze1,3, Pierre Cauchy2, Peter N. Cockerill4,*, Constanze Bonifer2,* and Sascha Ott1,*
1Warwick Systems Biology Centre, University of Warwick, Coventry, CV4 7AL, United Kingdom, 2School of
Cancer Sciences, Institute of Biomedical Research, College of Medical and Dental Sciences, University of Birmingham, Birmingham, B15 2TT, United Kingdom,3Department of Statistics, University of Warwick, Coventry, CV4 7AL, United Kingdom and4School of Immunity and Infection, Institute of Biomedical Research,
College of Medical and Dental Sciences, University of Birmingham, Birmingham, B15 2TT, United Kingdom
Received May 7, 2013; Revised August 29, 2013; Accepted September 1, 2013
ABSTRACT
The expression of eukaryotic genes is regulated by
cis-regulatory elements such as promoters and enhancers, which bind sequence-specific DNA-binding proteins. One of the great challenges in the gene regulation field is to characterise these elements. This involves the identification of tran-scription factor (TF) binding sites within regulatory elements that are occupied in a defined regulatory context. Digestion with DNase and the subsequent analysis of regions protected from cleavage (DNase footprinting) has for many years been used to identify specific binding sites occupied by TFs at individual cis-elements with high resolution. This methodology has recently been adapted for high-throughput sequencing (DNase-seq). In this study, we describe an imbalance in the DNA strand-specific alignment information of DNase-seq data surrounding protein–DNA interactions that allows accurate prediction of occupied TF binding sites. Our study introduces a novel algorithm, Wellington, which considers the imbalance in this strand-specific information to efficiently identify DNA footprints. This algorithm significantly enhances specificity by reducing the proportion of false positives and requires significantly fewer predictions than previously reported methods to recapitulate an equal amount of ChIP-seq data. We also provide an open-source software package,
pyDNase, which implements the Wellington algorithm to interface with DNase-seq data and expedite analyses.
INTRODUCTION
The correct tissue-specific and temporal function of the genome is tightly controlled by transcription factors (TFs) that recognise specific DNA sequences and regulate the expression of specific genes. However, they do not act as single molecules but interact with each other to form large multi-protein assemblies that act as platforms for the recruitment of members of the epigenetic regulatory machinery (1,2). One of the significant chal-lenges facing gene regulation studies is the identification of sites where TFs are bound to specific genes in a specific regulatory context. Although previous studies have shown a direct link between the sequence as well as tissue speci-ficity of a number of TFs and gene expression patterns (3,4), the mechanisms behind how defined DNA sequences and the assembly of TF complexes translate into global gene expression patterns remains to be fully understood.
Characterising TF binding sites (TFBSs) across the entire genome is a monumental task. It is estimated that the total number of TFs in the human genome number
!1500, where several hundred of these may be active in a given cell type at any one time (5). Currently, the ‘gold standard’ for identifying occupied TFBSs in a given context uses chromatin immunoprecipitation paired with
high-throughput sequencing (ChIP-seq) (6), which
requires either a high-quality antibody or high cell numbers or alternatively epitope tagging. Although
*To whom correspondence should be addressed. Tel: +44 2476 150258; Email: s.ott@warwick.ac.uk
Correspondence may also be addressed to Constanze Bonifer. Tel: +44 121 414 8881; Email: c.bonifer@bham.ac.uk Correspondence may also be addressed to Peter Cockerill. Tel: +44 121 414 6841; Email: p.n.cockerill@bham.ac.uk
The authors wish it to be known that, in their opinion, the first two authors should be regarded as Joint First Authors.
!The Author(s) 2013. Published by Oxford University Press.
This is an Open Access article distributed under the terms of the Creative Commons Attribution License (http://creativecommons.org/licenses/by/3.0/), which permits unrestricted reuse, distribution, and reproduction in any medium, provided the original work is properly cited.
at University of Warwick on February 12, 2014
http://nar.oxfordjournals.org/
ChIP-seq has proven to be extremely powerful, it is not without limitations: It is only possible to characterise one TF per experiment, it cannot be used alone to differentiate between primary and secondary binding (7), and the protein binding regions of the genome identified by ChIP-seq are in the order of several hundred base pairs. Progress has been made in this respect with the advent of ChIP-exo (8), which increases resolution of ChIP-seq data to below 50 bp, but this method has yet to see widespread adoption.
Another widely used approach in gene regulation studies uses DNase I as a tool to identify DNase I Hypersensitive Sites (DHSs) within chromatin (1). DHSs represent open chromatin regions that are normally only accessible at sites of active regulatory elements such as transcriptional enhancers. The recent development of DNase-seq has allowed more comprehensive mapping of the active chromatin landscape than is possible with ChIP-seq (9). The specific patterns of DNase I cleavage within DHSs also provide additional information about regions of DNA that are bound by proteins and are thereby protected from DNase I digestion, a feature that has been exploited for many years to obtain information
about DNA–protein interactions at specific genes
(10,11). However, the genome-wide data gained from this method are not trivial to analyse. DHSs can occupy hundreds of base pairs, and the entire complement of such sites contains an intrinsically high number of different specific TFBSs (9).
Although analyses of DNase-seq data were originally confined to identifying DHSs by peak detection, there have recently been several advances in the analysis of the raw tag counts that correspond to DNase activity at base pair resolution. The first of these digital genomic footprinting (DGF) methods were developed in yeast, where tag counts were processed with a rank transform-ation and tested for depletions in reads corresponding to occupied TFBSs using a binomial test (12). Subsequently, the first DGF studies in mammalian cells used a machine-learning approach where the tag counts were truncated, smoothed and differentiated, followed by the supervised training of a Hidden Markov Model on the known TFBSs
in the FMR1 promoter. Viterbi decoding was then
performed to provide binary classifications (bound or unbound) for every base in the genome (13). Although several sets of footprints for various cell types as well as the model parameters were published, a software imple-mentation was not made available. Another machine-learning approach, CENTIPEDE, trains an unsupervised Bayesian mixture model on the raw tag counts surround-ing all genomic occurrences of a specified motif of interest to predict the binding states of each motif occurrence (14); however, unlike the previous methods, it cannot make predictions at arbitrary genomic loci. A software imple-mentation of the CENTIPEDE algorithm is available but requires data to be pre-processed by the user into non-standard formats. The ENCODE project (15) has produced the most comprehensive set of DGFs in human cells by performing high-sequencing depth DNase-seq experiments on a multitude of cell types, adapting their previous footprinting methodology (12)
to human data through the use of a metric that calculates the ratio of DNase-seq tags within a binding site to those directly outside (the Footprint Occupancy Score) (7).
Using publically available DNase-seq data from the ENCODE project, we describe how the alignment direc-tion of DNA fragments relative to the reference strand exhibits a characteristic strand imbalance in the patterns surrounding known protein–DNA binding sites. We introduce Wellington, a novel footprinting algorithm that uses this knowledge to identify protein–DNA inter-actions in DNase-seq data with increased performance over previous methods, by reducing the number of false positives in our predictions. Alongside this, we provide the pyDNase software package to interface with DNase-seq data to run the Wellington algorithm and accelerate development of further analysis methods for these data. pyDNase and Wellington form a complete tool chain that can be used to identify protein–DNA interactions in any DNase-seq experiment performed according to the ‘double-hit’ protocol (16). Finally, we compared the performance of the different footprinting methods on a single data set, which we hope will be useful to the community in their decision of how to approach DGF tasks.
MATERIALS AND METHODS
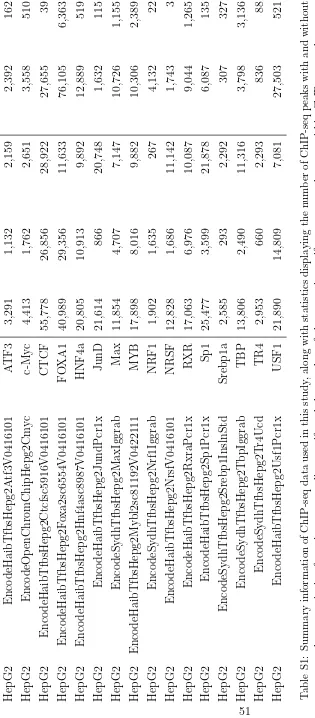
Data
Aligned double-hit DNase-seq data and genomic co-ordin-ates of DHSs (K562: wgEncodeUwDgfK562, HepG2: wgEncodeUwDgfHepg2, A549: wgEncodeUwDgfA549, SkMC: wgEncodeUwDgfSkmcAln) and PhyloP conserva-tion (Vertebrate phyloP46way) scores were downloaded from the UCSC genome browser (17). K562 data corres-ponding to the original single-hit DNase-seq library prep-aration method (9) were downloaded from the Sequence Read Archive (accession SRS131306) and aligned to hg19 using bowtie 1.0.0 (18) with the command line parameters ‘-a -best -strata -v 2 -m 1’. ChIP-seq data were downloaded as peaks from the ENCODE project’s ChIP-seq studies (19); for track names, see Supplementary Table S1.
The Wellington algorithm
To detect protein–DNA binding sites, we must
characterise the activity of DNase I and define what we consider to be a footprint. It is known that the activity of DNase I is lower in regions of inaccessible chromatin owing to protection of cleavage by histones or protein– DNA interactions. DNase I activity is therefore higher in regions of open chromatin without a bound protein. Protein–DNA binding sites can be detected by searching for a characteristic depletion of DNase I cuts compared with a large number of cuts in the surrounding region of open chromatin that do not harbour bound proteins.
To formalise our hypothesis test, we use the notation introduced in Figure 1. We will call the region surround-ing the possible footprint the shoulder region. Let lFPbe the length (in base pairs) of the possible footprint and lSH be the length (in base pairs) of the shoulder on each side of the possible footprint. We consider counts of cuts in these
e201 Nucleic Acids Research, 2013, Vol. 41, No. 21 PAGE2OF12
at University of Warwick on February 12, 2014
http://nar.oxfordjournals.org/
regions where ‘cuts’ refers to 50 ends of the aligned
sequencing tags. We consider four cut counts: the total number of cuts on the forward reference strand inside
the possible footprint (FP+), the cut count in the
upstream shoulder region on the forward reference strand (SH+), the cut count on the backward reference strand inside the possible footprint (FP") and the cut
count in the downstream shoulder region on the backward reference strand (SH").
We now test the null hypothesis that the number of reads is proportional to the region length by using a binomial test. As the number of reads can depend on the strand, e.g. because the protein structure might be such that it only inhibits DNase I activity on one strand, we test both strands separately. We consider these tests to be in-dependent, as each!200 bp fragment will at most produce either one forward or one backward read close to the footprint site under investigation. With F(k, n, p) being the binomial cumulative distribution function, i.e. the probability of achieving at least k out of n successes with the probability of each success being p, we calculate
a p-value using the formula p-value = {1-F[FP+,
FP++SH+, lFP/(lFP+lSH)]}#{1-F[FP", FP"+SH", lFP/ (lFP+lSH)]}. This p-value is for a given possible foot-print of length lFP with surrounding shoulder regions of length lSH.
We can calculate p-values for different possible foot-print and shoulder lengths lFP and lSH. We can then choose which regions we wish to consider footprints by selecting an appropriate threshold for the p-values and subsequently using a greedy selection strategy for foot-print identification. The parameters lFPand lSHare indi-vidually determined for each footprint using maximum likelihood estimation. The default values for lFP are
bound between 11 and 26 base pairs, whereas lSH is
fixed at 35 base pairs. Both of these parameters can be user-settable at run time with either ranges or fixed
values. Further details are provided in the supplementary material.
Validation of predicted binding sites
We downloaded peaks determined by ENCODE’s peak calling algorithm (specifically, ENCODE’s ‘optimal’, high confidence set of peaks) for ChIP-seq experiments corresponding to a range of TFs. ChIP-seq confirmed binding sites were defined as motif instances falling within these peaks for each TF, and unbound motif locations were defined as motif instances falling outside ChIP-seq peaks.
To calculate ChIP-seq recapitulation, we used
Wellington to calculate footprint p-values for each base pair in all DHSs and compared footprints with ChIP-seq positive motif instances. A ChIP-seq confirmed binding site is said to be successfully recapitulated by DNase-seq data if either at least 70% of the footprint is contained within the binding site or vice versa. This criterion is necessary as protection from DNase I is not always centred perfectly on a DNA motif. The same method was used when analysing Hesselberth et al. (12) footprints, Neph et al. (7) footprints and DHSs.
Average conservation scores were calculated using Vertebrate phyloP46way, and motif content was calcu-lated using the genomic locations of 214 curated ChIP-seq verified position weight matrices published as part of the HOMER suite (20). For full details, see supplementary material.
RESULTS
Strand imbalance information increases the predictive power of footprinting algorithms
Strand-specific information in the context of DNase-seq data has been used primarily to describe TF-specific
Figure 1.Wellington: a novel strand sensitive algorithm for the identification of protein–DNA binding sites from DNase-seq data. (A) The Wellington algorithm calculatesp-values for every base pair in all DNase hypersensitive sites in a given DNase-seq data set, where thes-value is assigned to the base pair at the centre of the footprint. For each base pair, Wellington tests the hypothesis that there are significantly more reads aligning to the forward reference strand in the upstream shoulder region (SH+) with respect to the +ve strand footprint region (FP+) and significantly
more reads aligning to the reverse reference strand in the downstream shoulder region (SH–) with respect to the"ve strand footprint region (FP–). (B) Example output of the Wellington algorithm. The corresponding footprint prediction recapitulates the ChIP-seq confirmed CTCF-binding site.
at University of Warwick on February 12, 2014
http://nar.oxfordjournals.org/