University of Warwick institutional repository:
http://go.warwick.ac.uk/wrap
A Thesis Submitted for the Degree of PhD at the University of Warwick
http://go.warwick.ac.uk/wrap/56009
This thesis is made available online and is protected by original copyright.
Please scroll down to view the document itself.
i
Development of methods for combinatorial
approaches to
cis
-regulatory module
interactions
By
Maxim B. Joseph
Molecular organisation and assembly in cells University of Warwick
A thesis submitted to the University of Warwick for the degree of Doctor of Philosophy
ii This book is dedicated to my brilliant and beautiful wife without whom I would be nothing. She
always comforts and consoles, never complains or interferes, asks nothing and endures all. She also writes my dedications
iii
List of figures ... xiii
List of tables ... xxi
Acknowledgements ... xxii
Declaration ... xxiii
Abstract ... xxiv
List of author’s publications ... xxv
List of abbreviations ... xxvi
1. Systems approaches of combinatorial dissection of cis-regulatory module function ... 1
1.1. Specification in development ... 1
1.2. Regulation of transcription ... 4
1.3. Signal interpretation at/by cis-regulatory modules ... 7
1.4. Evo-devo and CRM interactions ... 9
1.5. Mechanisms of CRM-promoter communication: Billboard vs. Enhanceosome .. 10
1.6. Investigation of CRMs ... 12
1.7. Thesis aims and objectives ... 17
1.8. References ... 23
2. Traditional and combinatorial investigations into the regulation of myod ... 27
2.1. Muscle specification in vivo ... 27
2.2. The MyoD protein ... 29
2.3. Regulation of MyoD ... 30
2.4. Satellite cell specification ... 33
2.5. Previous work ... 35
iv
2.5.3. Chromatin immunoprecipitation of factors on CRMs ... 43
2.6. Prioritisation of binding sites within CRMs ... 44
2.6.1. Summary of contributing factors ... 45
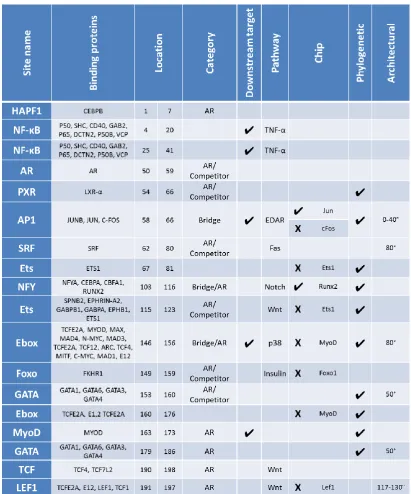
2.6.2. CRM binding site maps ... 49
2.6.3. Discussion of factors contributing to the prioritisation of binding sites ... 52
2.6.4. Selection of binding sites for further analysis ... 57
2.7. Generation of mutant sites ... 58
2.8. Unaddressed issues with CRM investigation ... 60
2.9. References ... 62
3. Review of microfluidics... 69
3.1. Microfluidic overview ... 69
3.2. Types of microfluidic devices ... 70
3.2.1. Continuous ... 70
3.2.2. Droplet ... 71
3.2.3. Digital ... 71
3.3. Microfabrication methods ... 72
3.4. Photolithographic techniques ... 72
3.5. Micromachining ... 73
3.6. Additive layer manufacture ... 74
3.7. Microfluidic device materials ... 78
3.8. Does smaller equal better in microfluidics? ... 79
3.9. Multilayer soft lithography ... 80
3.10. Bonding of PDMS devices ... 81
3.11. Flow in microfluidic channels ... 81
v
3.14. Methods of microfluidic valve actuation ... 87
3.15. Methods of making droplets within microfluidic devices... 90
3.16. Methods of controlling droplets within microfluidic devices ... 92
3.17. Droplet monitoring ... 93
3.18. Applications of microfluidics to synthetic and systems biology ... 94
3.18.1. Synthetic biology ... 94
3.18.2. Systems biology ... 95
3.19. Review conclusions ... 96
3.20. References ... 98
4. Methods ... 107
4.1. EnvisionTec Perfactory Mini microstereolithography machine ... 107
4.1.1. EnvisionTec Perfactory workflow ... 109
4.1.2. EnvisionTec Perfactory build material ... 110
4.1.3. Optical characterisation of R11 resin ... 111
4.1.4. EnvisionTec Perfactory capability ... 111
4.1.5. Burn-in range settings ... 112
4.1.6. Build range settings ... 113
4.1.7. WYKO build characterisation ... 113
4.1.8. Post curing ... 113
4.2. Microfluidic device fabrication ... 114
4.2.1. PDMS casting ... 114
4.2.2. Membrane thickness determination ... 115
4.2.3. Multilayer soft lithography ... 116
4.2.4. Microfluidic device control ... 116
vi
4.3.1. Restriction digests ... 119
4.3.2. PCR amplification ... 119
4.3.3. Gel electrophoresis... 120
4.3.4. DNA ladder ... 120
4.3.5. Gel extraction ... 120
4.3.6. Bacterial culture ... 121
4.3.7. Ligation for cloning ... 121
4.3.8. TOPO Cloning ... 122
4.3.9. Bacterial transfections ... 123
4.3.10. Sequencing ... 124
4.4. DNA assembly ... 124
4.4.1. Phosphoramidite synthesis ... 124
4.4.2. Assembly of genes by the Gao method ... 125
4.4.3. Gao assembly ... 126
4.4.4. Chip cleavage ... 128
4.4.5. Gao oligonucleotide digests ... 130
4.4.6. Gao assembly ligation reaction ... 130
4.4.7. Optimisation of the Gao assembly ... 131
4.4.8. Gao assembly amplifications ... 131
4.4.9. OptiCut oligonucleotides ... 132
4.4.10. Opticut assembly protocols ... 132
4.4.11. Purification protocol ... 133
4.4.12. Cloning and sequencing... 133
4.5. Tissue culture ... 134
vii
4.5.3. Cell Thawing ... 136
4.5.4. Cell seeding ... 136
4.5.5. Transient transfection ... 137
4.5.6. Differentiation ... 138
4.5.7. Cell fixing ... 139
4.5.8. Flow cytometry ... 140
4.5.9. Analysis of flow cytometry data ... 141
4.6. COMSOL modelling ... 145
4.7. Programming ... 145
4.7.1. MATLAB ... 145
4.7.2. DNA melting point determination ... 146
4.7.3. Algorithm scaling efficiency testing ... 146
4.7.4. LabVIEW ... 147
4.7.5. Flow rate analysis ... 148
4.7.6. Droplet size analysis ... 149
4.8. References ... 150
5. Flow cells by microstereolithography... 151
5.1. EnvisionTec build characterisation ... 152
5.1.1. Pixel size ... 152
5.1.2. Layer thickness ... 153
5.1.3. Model slicing ... 155
5.1.4. EnvisionTec build capability ... 156
5.1.5. EnvisionTec build artifacts ... 157
5.2. EnvisionTec MSL fluidic parts ... 159
viii
5.3.2. MSL moulds for PDMS flow cell... 164
5.3.3. Effect of uncured R11 on PDMS curing ... 167
5.4. Thin layer flow cells ... 168
5.5. Optical flow cell ... 175
5.6. Conclusions ... 180
5.7. References ... 181
6. Design and operation of PDMS microfluidic device ... 182
6.1. Droplet microfluidics ... 184
6.2. Making of PDMS channels using MSL moulds ... 185
6.3. Membranes from the mortar layer ... 190
6.4. Valve design ... 191
6.5. Layer production, alignment and bonding. ... 192
6.6. Membrane thickness ... 194
6.7. Flow rate through valves at varying pressures ... 198
6.8. Microfluidic chip design ... 201
6.9. Interfacing with the chip ... 205
6.10. Microfluidic setup ... 208
6.11. Droplet contamination ... 209
6.12. Droplet size variability ... 211
6.13. ValveControl LabVIEW program design ... 213
6.14. ValveControl GUI... 214
6.15. ValveControl text input ... 217
6.16. Additional functionality ... 218
6.17. DNA assembly testing ... 218
ix
7. Development of OptiCut ... 224
7.1. Introduction ... 225
7.1.1. Definition of the problem ... 225
7.1.2. Current gene assembly software... 227
7.1.3. Melting temperature estimation ... 228
7.1.4. Competitor identification ... 229
7.2. OptiCut method ... 230
7.3. Loop identification ... 234
7.4. Visualisation of algorithm performance ... 237
7.5. Competitor identification ... 239
7.6. Efficiency and effectiveness of algorithm ... 241
7.7. Optimisation and cost minimisation ... 245
7.8. OptiCut Graphical User Interface ... 245
7.8.1. Sub functions and installation of the OptiCut GUI ... 248
7.9. Assembly results ... 249
7.10. Further work ... 250
7.11. Conclusions ... 252
7.12. References ... 253
8. CRM library assembly ... 255
8.1. Introduction to gene assembly ... 256
8.1.1. Current gene assembly methods... 256
8.1.2. DNA assembly of the CRM... 257
8.1.3. Literature examples of library assembly ... 260
8.1.4. Downstream separation ... 261
x
8.2.2. Oligonucleotide mixture amplification ... 264
8.2.3. Oligonucleotide mixture digest ... 265
8.2.4. Gao Assembly PCR ... 267
8.2.5. Changing concentration of oligomix ... 268
8.2.6. Changing the conditions of the post-assembly PCR ... 270
8.2.7. Use of alternative primers ... 272
8.2.8. Reasons for failure of the Gao assembly ... 276
8.3. Opticut assembly ... 277
8.3.1. OptiCut optimised oligonucleotide assembly ... 278
8.3.2. Use of high fidelity DNA polymerase ... 279
8.3.3. Demonstration of the necessity of the ligation step ... 281
8.3.4. Assembly of whole CRM-B library ... 282
8.3.5. Sequencing of amplified assemblies ... 286
8.3.6. Palindromic regions present in original sequences ... 287
8.3.7. Error rate ... 288
8.4. Further work ... 291
8.5. Conclusions ... 293
8.6. References ... 294
9. Analysis of CRM position-effect and mutant constructs ... 297
9.1. Description of model system and analysis ... 297
9.1.1. C2C12 cells ... 298
9.1.2. Transient transfection to study reporter gene expression ... 299
9.1.3. Studying reporter gene expression using stable transfectants ... 300
9.2. Testing of position and orientation effects of CRM-B ... 301
xi
9.3. Mutational analysis of CRM activity ... 308
9.3.1. Selection of sites within CRM-B for mutational analysis ... 308
9.3.2. Selection of several members of the mutant library for further analysis ... 311
9.3.3. Mutation analysis of A-CER construct ... 314
9.4. Further work ... 316
9.5. Conclusions ... 318
9.6. References ... 319
10. Conclusions ... 321
10.1. Microfluidics for biological and chemical applications ... 322
10.2. Optimisation of oligonucleotide overlap sequences ... 324
10.3. Optimisation of CRM assembly ... 325
10.4. Investigation of CRM position/orientation and CRM mutation analysis ... 327
10.5. Future work ... 327
10.6. References ... 331
A. Appendix A: MATLAB code ... 332
A.1. Video reading code ... 332
A.2. Probability bootstrapping ... 334
A.3. OptiCut program ... 335
A.3.1. OptiCut GUI ... 335
A.3.2. GroupCutINIT ... 345
A.3.3. GroupCutOutput ... 350
A.3.4. PlotHist ... 351
A.3.5. HeterodimerMeltingTemp ... 352
A.3.6. TmNNSanta98... 355
xiv
(top), A (2nd top), B (2nd bottom) and C (bottom). ... 52
Figure 3.1: Flow lines (blue) of a fluid undergoing laminar flow as it moves through a tube and around an obstruction (grey oval). ... 82
Figure 3.2: Diagram of how the EOF is created. ... 84
Figure 3.3: Diagram of Quake valve assembly process: ... 88
Figure 3.4: Three channels geometries capable of producing droplets from two continuously flowing phases (pink and blue). ... 91
Figure 4.1: Schematic of EnvisionTec Perfactory MSL machine. ... 108
Figure 4.2: Workflow schematic of making parts with the EnvisionTec Perfactory Mini machine. ... 110
Figure 4.3: Steps of the phosphoramidite synthesis cycle for synthesis of DNA chains on a solid support. ... 125
Figure 4.4: Schematic of the assembly process developed by Gao. ... 127
Figure 4.5: Workflow of a typical transient transfection experiment. ... 137
Figure 4.6: Raw flow cytometry data from a population of untransfected, differentiating C2C12 myoblasts with ‘gates’ indicated black lines from FlowJo software. ... 142
Figure 4.7: Histogram of GFP expression in particles in the gated populations shown in figure 4.6. ... 144
Figure 4.8: Schematic diagram of high voltage switch circuit used to drive 12V solenoid valves. ... 148
Figure 5.1: Example single layer thicknesses as measured by interferometry. ... 154
Figure 5.2: Edge feature interferometry measurements (left pane) of an MSL part. ... 155
Figure 5.3: Example builds with the EnvisionTec Perfactory. ... 156
xv surfaces... 158 Figure 5.6: Isometric projection of the CAD model of the microbial flow cell. ... 161 Figure 5.7: Schematic diagram of the CAD model of the later iteration of the microbial flow cell. ... 161 Figure 5.8: COMSOL modelling flow through MSL flow cell for microbiology. ... 162 Figure 5.9: Relative velocity profiles of each of the four inlets as they enter the main chamber. ... 163 Figure 5.10: Schematic diagram of mould for SAW device flow cell. ... 166 Figure 5.11: Isometric projections of CAD models of PDMS cast (left) made from MSL mould (right). ... 166 Figure 5.12: Isometric projection of the CAD model of the thin layer flow cell (left) and radial flow cell (right). ... 170 Figure 5.13: Schematic diagrams of the linear (left) and radial (right) flow cells built by
MSL. ... 171 Figure 5.14: COMSOL Modelling of the currently available DropSens radial flow cell (left) verses relevant modelling of the MSL Radial flow cell (right). ... 172 Figure 5.15: Image of thin layer flow cell on electrode surface with inlet and outlet connectors. ... 173 Figure 5.16: Data obtained from the thin layer flow cell. ... 173 Figure 5.17: Data obtained from the radial flow cell. ... 174 Figure 5.18: Spectrophotometric analysis of different resin materials from 200 to 800
xvi
operation of the microfluidic device. ... 182
Figure 6.2: Diagram of valve controlled microfluidic droplet merging. ... 185
Figure 6.3: Process flow of making a simple PDMS microchip by multilayer soft lithography using MSL moulds. ... 186
Figure 6.4: Microscope image of PDMS channels test part. ... 187
Figure 6.5: Scanning electron microscope (SEM) images of cross sections through channels made by multilayer soft lithography. ... 189
Figure 6.6: Process flow for making PDMS microchip with actuatable PDMS membrane component by multilayer soft lithography. ... 190
Figure 6.7: Schematic diagram of valve closing of the Quake valves fabricated here. ... 192
Figure 6.8: Microscope images of PDMS layers prior to sealing against one another. ... 192
Figure 6.9: Microscope images of two valves made by multilayer soft lithography. ... 193
Figure 6.10: Graph of PDMS layer thickness after spinning from 500 to 5000 rpm. ... 195
Figure 6.11: SEM images of two orthogonal cross sections through two valves from the same chip assembled by multilayer soft lithography. ... 196
Figure 6.12: SEM image of a channel in a PDMS chip assembled by multilayer soft lithography. ... 197
Figure 6.13: Microscope images of a PDMS valve when closed (left) and open (right). ... 198
Figure 6.14: Graph of flow rate through a PDMS microvalve over the range of 0 – 55 kPa as measured by two complimentary methods. ... 199
Figure 6.15: Graph of valve pressure from 20.7 to 72.4 kPa against flow rate as measured by flow meter. ... 200
xvii for the fluidic layer. ... 204 Figure 6.18: Isometric views of 3D CAD models of the moulds for the two layers of the
xviii required, against number of sequences (blue diamonds). ... 241 Figure 7.9: Graph of the average number of iterations required before the optimisation minima is reached against length of inputted sequence (blue diamonds). .... 242 Figure 7.10: Graph of the average time required before the optimisation minima is reached against length of inputted sequence (blue diamonds). ... 243 Figure 7.11: Histogram showing comparison of oligonucleotide optimisation by the Gao lab’s SeqZego (left) and the OptiCut (right) optimisation algorithms. ... 244 Figure 7.12: Screenshot of the OptiCut GUI on opening. ... 246 Figure 7.13: Screen shot of the OptiCut GUI after running an optimisation on a sequence set. ... 247 Figure 7.14: Inverted colour agarose gel of 8 of 512 assembled products stained with
xix combinations ... 274 Figure 8.11: Sequence traces indicating partially successful assemblies of the Gao oligonucleotides. ... 275 Figure 8.12: Gel showing successful amplification of full length oligonucleotide
xxi Table 2.1: List of downstream targets for MyoD in both growing cells (GM) and myotubes (MT). ... 31 Table 2.2: Signalling pathways, their qualitative effect on MyoD expression and candidate downstream effectors. ... 33 Table 2.3: Summary of results from ChIP experiments. ... 44 Table 2.4: Factors affecting the prioritisation of binding sites in the CER. ... 46 Table 2.5: Factors affecting the prioritisation of binding sites in CRM-A. ... 47 Table 2.6: Factors affecting the prioritisation of binding sites in CRM-B. ... 48 Table 2.7: Factors affecting the prioritisation of binding sites in CRM-C. ... 49 Table 3.1: Comparison of the relative utility of the three primary types of microfluidic device. ... 72 Table 3.2: Comparison of ALM-based rapid manufacturing methods. ... 75 Table 3.3: Summary on detection methods in microfluidic devices. ... 87 Table 5.1: Table showing the advantages and disadvantages of different fabrication methods that could be used to fabricate the microfluidic devices. ... 152 Table 6.1: Sequencing data obtained from a set of 10 sequences produced using the PDMS chip mixtures. ... 221 Table 7.1: Nearest Neighbour (NN) binding energies for adjacent bases as determined by SantaLucia23. ... 229 Table 8.1: Table of all members of the CRM-B mutant library assembled by
OptiCut-optimised ligative oligonucleotide assembly. ... 285 Table 8.2: Sequencing data obtained from a set of 42 sequences produced by the
xxii I would like to foremost acknowledge both my supervisors, Prof. James A. Covington and Prof. Georgy Koentges, for their tireless and diligent effort to support, encourage and inspire me during this project. Without their mentorship I would not have been able to successfully complete this project.
My advisory committee, consisting of Dr. Til Bretschneider and Dr. Michael Chappell, is thanked for their time and constructive feedback that has materially contributed to this project.
I would like to thank the many people from the different labs that I have worked with during this project for their help and assistance. From the biology lab: Dr. Kate Jordan, Dr. Danuta Jeziorska, Polly Downton and Xintao Zhang. From the engineering lab: Dr. Simon Leigh and Chris Purssell. Each of these people provided experience and expertise where I lacked and their support (and, at times, medical assistance) has been invaluable during this project. Without the assistance of each of these people, this project would have failed to get off the ground and crashed several times along the way. In addition to these people I would like to thank all the members of the MOAC and Systems Biology students, academics and support staff for providing a warm and nurturing environment from which to develop. Foremost of these people I would like to thank Prof. Alison Rodger. I cannot overemphasise the benefit of her mentorship and advice has been during this project.
I would like to thank my various collaborators in groups. From the Department of Chemistry: Dr. Mike Snowden, Dr. Eleni Bitzou and Xi Cheng. Dr. Sacha Ott from Systems Biology. Dr. Rich Boden from the School of Biomedical and Biosciences, University of Plymouth. From the Department of Statistics: Dr. Sach Mukherjee and Dr John Reid. Prof. Mario Nicodemi from the Department of Physics. The fruitful discussions I have had with each of these individuals have enhanced the various portions of the project with which they have been involved.
This work has received technical assistance from many members of technical staff from both the School of Engineering and the School of Life Sciences. In particular I would like to acknowledge the help and support I have received from Frank Courtney.
xxiv The complexity and size of the higher animal genome and relative scarcity of DNA-binding factors with which to regulate it imply a complex and pleiotropic regulatory system. Cis-regulatory modules (CRMs) are vitally important regulators of gene expression in higher animal cells, integrating external and internal information to determine an appropriate response in terms of gene expression by means of direct and indirect interactions with the transcriptional machinery. The interaction space available within systems of multiple CRMs, each containing several sites where one or more factors could be bound is huge. Current methods of investigation involve the removal of individual sites or factors and measuring the resulting effect on gene expression. The effects of investigations of this type may be masked by the functional redundancy present in some of these regulatory systems as a result of their evolutionary development. The investigation of CRM function is limited by a lack of technology to generate and analyse combinatorial mutation libraries of CRMs, where putative transcription factor binding sites are mutated in various combinations to achieve a holistic view of how the factors binding to those sites cooperate to bring about CRM function. The principle work of this thesis is the generation of such a library.
xxv Arasaradnam, R. P., Quraishi, N., Kyrou, I., Nwokolo, C. U., Joseph, M., Kumar, S., Bardhan, K. D., Covington J. A. (2011). Insights into “fermentonomics”: evaluation of volatile organic compounds (VOCs) in human disease using an electronic “e-nose.” Journal of Medical
Engineering & Technology, 35(2), 87-91.
Fisher, R. D., Mbogoro, M. M., Snowden, M. E., Joseph, M. B., Covington, J. A., Unwin, P. R., Walton, R. I. (2011). Dissolution Kinetics of Polycrystalline Calcium Sulfate-Based Materials: Influence of Chemical Modification. ACS applied materials & interfaces, 3, 3528-3537.
Cheng, X., Joseph M. B., Covington J. A., Dafforn T. A., Hicks M. A. and Rodger A. (2012). Continuous-channel flow linear dichroism. Analytical methods, 4, 3169-3173
xxvi 3C Chromatin conformation capture
3DP 3D printing
4C Circularised chromatin conformation capture 5C Carbon copy chromatin conformation capture ABS Acrylonitrile butadiene styrene
ALM Additive layer manufacture
AP1 Activator protein 1
ASCII American standard code for information interchange
BiFa Binding factor
BMP-2 Bone morphogenic protein-2 BMP-4 Bone morphogenic protein – 4
BRE Transcription factor IIB recognition element
BSA Bovine serum albumin
CAD Computer aided design
CDF Cumulative distribution function
CER Core enhancer region
ChIP Chromatin immunoprecipitation CNC Computer numerical control
CODA Computationally optimised DNA assembly
CRM Cis-regulatory module
CSV Comma separated variable
ct-DNA calf thymus-DNA
DCE Downstream core element
xxvii
DMSO Dimethyl sulfoxide
DMT Deoxyribonucleic acid methyltransferase
DNA Deoxyribonucleic acid
dNTP deoxynucleotide triphosphate
DPE Downstream promoter element
DRIE Deep reactive ion etch DRR Distal regulatory region
EOF Electroosmotic force
EOP Electroosmotic pump
EWOD Electrowetting on dielectric FDM Fused deposition modelling Forkhead box Foxo
FPS Frames per second
FSC Front scatter
GeMS Gene morphing system
GFP Green fluorescent protein
GRN Gene regulatory network
GTF General transcription factor GUI Graphical user interface HAT Histone acetyl transferase HDAC Histone deacetylase
HPLC High performance liquid chromatography HPSF High purity, salt free
HS Horse serum
IC Integrated circuit
xxviii LB-Miller Lysogeny broth – Miller variant
LCR Ligase chain reaction
LENS Laser engineered net shaping
LIGA Lithographie, galvanoformung, abformung (lithography, electroplating and moulding)
LOM Laminar object manufacturing LSI Large scale integration
MAP Mitogen activated protein MAPK Mitogen activated protein kinase
MCR MATLAB C runtime
Mrf4 Myogenic regulatory factor 4. mRNA Messenger ribonucleic acid
MSL Microstereolithography
MTE Motif ten element
Myf5 Myogenic factor 5
MyoD Myogenic determination factor
Myog Myogenin
NFY Nuclear transcription factor Y NF-κB Nuclear factor-kappa B
NI-DAQ National Instruments – Digital acquisition
NN Nearest neighbour
OD Outer diameter
xxix PIC Pre-initiation complex
PMMA Poly(methyl methacrylate)
PMT Photomultiplier tube
PRR Promoter
PS Poly(styrene)
PSI Pounds per square inch
PUMA poly(urethane methacrylate) PVC Poly(vinyl chloride)
qPCR Quantitative polymerase chain reaction
RIE Reactive ion etch
RMSD Root mean square difference
RNA Ribonucleic acid
RNAi Ribonucleic acid interference RNAP Ribonucleic acid polymerase
RP Rapid prototyping
RPM Revolutions per minute
Runx2 Runt-related transcription factor 2
SAW Surface acoustic wave
SDM Site directed mutagenesis
SDS Sodium dodecylsulfate
SEM Scanning electron microscope
Shh Sonic hedgehog
SLA Stereolithography
SLS Selective laser sintering
SRF Serum response factor
xxx TGFβ Transforming growth factor β
TNFα Tumour necrosis factor α
Tris Tris(hydroxymethyl)aminomethane TSS Transcription start site
UV Ultraviolet
VDR Vitamin D receptor
1
Chapter 1
1.
Systems approaches of combinatorial dissection of
cis-regulatory module function
1.1. Specification in development
Development is the process by which higher organisms transition from a single celled zygote to the complex, multicellular adult. During this transition the cells of the developing embryo will undergo periods of patterning, specification, migration, rapid division, apoptosis and differentiation. These processes are regulated in a precise and concerted manner by a remarkably small set of developmental genes1,2. The expression of these developmental genes must be tightly restricted to specific spatial and temporal locations within the developing embryo. The result of these processes is the specification of populations of cells, cell lineages, which will go on to form all of the >200 cell types found in the complex metazoans, known colloquially as ‘higher animals’..
2 The processes of development are initiated in response to a range of inter- and intracellular signalling cues. Many cues are derived from the overlapping gradients of signalling molecules throughout the embryo generated by specific groups of cells (such as dorsal-ventral orientation). Other cues, however, are transmitted via direct cell-cell contacts (such as Notch/delta signalling in pigmentation). A cell must integrate information from various competing and cooperating signals and determine the appropriate response. One mechanism of this integration process occurs during signal transduction: different signalling pathways might share common elements in their cascades and by affecting the activity of these elements, the information from different signalling sources is merged. The p38 mitogen activated protein kinase (MAPK) pathway is an example of a signalling pathway with multiple inputs4. The activation of specific regulatory factors within the nucleus, however, is the terminus of many signalling cascades. In the nucleus, integration of complementary and competing signals is achieved at the promoters, enhancers, silencers and other regulatory modules associated with specific target genes. The result of these regulatory interactions is the expression of genes that result in the assumption of a cellular identity. Although selected, in some cases the identity of a cell is still plastic, as demonstrated by tissue grafting experiments in the chick embryo5. Cells previously expressing genes specific for one location can be induced to express genes specific to another location once grafted to the new location and the alternative signalling cues are internalised and interpreted.
3 known to lead to the silencing of whole regions of DNA, preventing the expression of regulatory genes therein6–8. Silencing is usually achieved by a combination of epigenetic and histone modification driven by the recruitment of DNA methylases and histone deacetylases that serve to favour the packaging of DNA into silent, non-expressing heterochromatin9.
The spatial and temporal expression of genes necessary to specify a cell lineage is usually tightly controlled. Figure 1.1 exemplifies this using the specification of muscle progenitor cells in the developing embryo. The specification of a region of tissue in the embryo that will become the adult skeletal musculature is achieved by the overlapping presence of several signals; bone morphogenetic protein-4 (BMP4), noggin, Shh and the Wnt proteins. This process is discussed further in chapter 3.
4 Bacteria are able to achieve a sufficiently sophisticated suite of regulatory control mechanisms by direct interactions between transcription factors and the core transcriptional machinery11. A population of bacteria may respond to changes in environment by evolving their responses appropriately, trimming excess genetic code and altering regulatory interactions. In contrast, the responses to environmental change of each of the >200 cell types of the higher animal must be encoded in each of the individual cell types. Remarkably, this function is achieved with relatively fewer transcriptional genes2. As a result, the regulatory interactions that ensure the appropriate responses occur are significantly more complex in higher animals than prokaryotes. In higher animals correct spatiotemporal gene regulation is achieved through the complex interactions of multiple DNA-binding proteins and their cognate binding sites in regulatory modules in the non-coding DNA. This is achieved with a relatively small amount of genes operating in pleiotropic networks and the mechanisms that result correct regulation of each gene are likely to be complex. To understand how genes are regulated, the mechanisms of their expression must first be understood.
1.2. Regulation of transcription
5 sequestration/localisation of mRNA, degradation of protein, sequestration of protein and post-translational modification. Regulation of transcription is achieved by the interaction of enhancing and silencing regulatory modules with the core transcriptional machinery at the core promoter.
In contrast to the highly conserved prokaryotic promoter, the promoters of eukaryotic cells exhibit significantly more variation in the elements present therein. The diversity in promoter structure observed in eukaryotic organisms13,14 is presumably a reflection of the range of regulatory conditions that must be represented in order to correctly control in a complex multicellular organism the spatiotemporal expression of the ~20000 genes present in the human genome with only an estimated <2000 DNA-binding transcription factors1,2.
The promoter alone is not sufficient to facilitate the high levels of expression associated with some genes6. The core promoter is supplemented by additional elements that facilitate and regulate the expression of a given gene. These elements can be close (≤1 kb) to the promoter they regulate in the case of proximal regulatory elements or many 10s or even 100s of kb away in the case of distal regulatory elements15. Regulation of a target gene by a regulatory element is achieved in conjunction with the binding of a specific transcription factor. For example, activation of a target gene can be achieved by the binding of an activatory transcription factor to an element, which is called an enhancer16. Conversely, the binding of a repressive transcription factor to an element produces a silencer. Clusters of regulatory transcription factor binding sites that act on genes on the same chromosome, to bring about enhancement or silencing of a target gene, are termed
cis-regulatory modules (CRMs)17. Further elements include insulators and locus control
6 achieve the regulation of a gene in a location-independent manner18. Similarly, groups of enhancers are able to associate into enhanceosome structures, the best characterised being the enhanceosome of the IFN-β gene19 which has even been crystallised20. Groups of repressive regulatory elements can also cooperate to act as a repressosome21 and, in the right circumstances, enhanceosomes can be converted to repressosomes22. The enhanceosome model of CRM action, therefore, involves the interaction of various factors bound to a CRM in with an overall structure and that each element of the structure is necessary in order for the whole to function as intended. In addition to this highly coordinated and cooperative model of CRM action, another model, the billboard model, also exists23. In this model, factors bound to binding sites do not interact with each other and instead regulate transcription through independent interactions with the core transcriptional machinery.
Regulation of the target promoter is brought about by the relative frequency with which these different elements are able to interact with the transcriptional machinery bound to the core promoter.
7 1.3. Signal interpretation at/by cis-regulatory modules
A vast number of regulatory inputs must be processed by the many cells of a developing embryo. The output, activation and/or silencing of gene expression at certain specific loci, will incorporate information about the history of the cell, or cell lineage with information from the environment. The effect of the integration of the external signalling influences and the internal lineage information is determined by CRMs that control the spatiotemporal expression of each gene. The regulatory responses to a given set of inputs by the cell is, therefore, ‘hardwired’ into the genome by the presence of these CRMs25.
CRMs are typically between 100 and 1000 basepairs in length and contain a high concentration of transcription factor binding sites26. Some regulatory modules are capable of acting on the promoters of more than one gene and also across chromosomes27. Furthermore, whether the CRM is activatory or inhibitory depends what factors are bound to the sites within that CRM. Regulatory modules in both these contexts are herein referred to as CRMs. Because they are the site of integration between the signalling and internal regulatory state of the cell, CRMs, or combinations thereof, are the site where the appropriate response is determined.
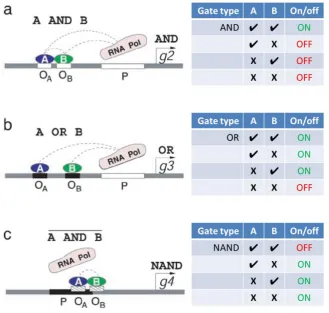
8 cooperatively to the DNA an AND gate is generated as the activatory effect is only observed when both factors are available (see figure 1.2, a). Similarly, if two independently binding activatory factors are able to perform the same activatory effect, an OR gate is generated (see figure 1.2, b). The NOT version of each of these gates, NAND and NOR, can be generated if the transcription factors compete with the RNAPII binding site. An example of a NAND gate is shown in figure 1.2, c.
Figure 1.2: Gene regulatory logic gates. Three gates are demonstrated: a) represents an AND gate, where both factor A and B must be present for either bind and interact with the RNAP. b) represents an OR gate, where factors A and B binding to distinct, non-interacting sites and each interact with the RNAP independently. c) represents a NAND gate, where both factor A and B must be present for either to bind and thereby disrupt RNAP function. Image adapted from Buchler et al.30.
[image:39.595.155.485.238.551.2]9 changes in position or orientation critically affecting function. Conversely, there are examples of considerable flexibility in the order and relative position of transcription factor binding sites33.
Logic functions appear to play a central role in the regulation of many developmental genes across several multicellular species 34. The mechanism by which a cell, finding itself in a given environment, determines what identity it should assume is hardwired into the genetic code by means of transcription binding sites within CRMs. Specific factors bound to these sites interact to bring about the expression of specific regulatory factors. The expression of these factors sets in motion a cascade of gene expression that brings about the appropriate response.
1.4. Evo-devo and CRM interactions
10 different expression patterns. It is the differences in expression patterns of these and other influential gene families that results in the differences in the body plans between higher animals.
Duplication of whole GRNs can lead to alteration of the body plan by patterning of previously adapted organs or tissues41. The flexibility and variation seen in the vertebrate body plan, as compared to the relatively insignificant variation in genome sequence, is probably due, at least in part, to the flexibility of a system where regulatory modules are divorced from the genes they regulate40,42. This conclusion is supported by the fact that there is significant variation in the relative number of members of DNA-binding protein families across different animal phyla, although each phyla does contain a common set of families overall43. The master muscle regulatory factors (MRFs) seem to exemplify this paradigm: A family of related transcription factors that exert high level control over the processes of muscle specification during development across all higher vertebrate animals. The MRFs are a family composed of four genes; myod, myf-5, myogenein and mrf4 44.
1.5. Mechanisms of CRM-promoter communication: Billboard vs. Enhanceosome
11 operates on the core transcriptional machinery independently. The output from a billboard-type CRM is more likely to be stochastic, with output from the gene depending on the relative likelihood of each subset of transcription factors interacting with the transcription machinery. The best known example of enhanceosome CRM is virus inducible enhancer in the human IFN-β gene19. Conversely, the stripe 2 enhancer in Drosophila exemplifies the billboard-type CRM45,46. The two types can be distinguished by the independence of the billboard-type from position and/or orientation sensitivity. Sites within the billboard-type operate essentially independently or in pairs and are therefore resistant to individual sites being changed. In contrast, sites in the enhanceosome model are highly cooperative, often requiring architectural looping interactions47,48and removal of one site likely result in the silencing of the CRM. Long distance interactions between CRMs that constitute enhanceosome structures can be identified through chromatin conformation capture (3C) assays49,50 that provide information about the 3D structure of interacting sites. More recently, high throughput modifications of the 3C protocols, such as circularised 3C (4C) and carbon-copy 3C (5C), have provided genome wide interaction maps51. Due to the involvement of multiple modules undergoing complex interactions, the enhanceosome model is likely to demonstrate context sensitivity, whereas an individual module can either be activatory, repressive or silent depending on the presence and factors bound to the other modules.
12 between these two types measurements of individual cells within large populations must be made. If the whole cell population state is measured by, for example a Western blot or qPCR, a moderate level of protein expression might be indicative of either all the cells expressing a moderate amount of protein, rheostatic type, or half the cells expressing a high level of protein and half the cells expressing none, binary type. To measure large populations of cells individually, either live cell imaging or flow cytometry can be used. Statistics about individual cells can then be determined and the two types of CRM, rheostatic or binary, distinguished.
1.6. Investigation of CRMs
CRMs are typically identified by either computational or perturbation experiments. In the former type, which is much faster but less conclusive and requires aligned genomic sequence information, sequences from the genomes of difference species are compared for conservation or simply scanning for high densities of predicted binding sites. Regions that are strongly conserved between species are considered to be important as there is a strong evolutionary pressure to resist changes in these regions. The CRMs putatively identified thusly must then be confirmed by in vivo/in vitro experimentation either in culture or in whole organisms. The latter type, which is slower but more conclusive and requires many constructs, the DNA sequence around a promoter of interest is manipulated. Specific regions or binding sites can be removed and their effect on expression of a gene can be monitored. Because transcription factors do not appear to bind sites with affinity directly proportional to the sequence of the site, as would be expected53, it is not possible to use solely predictive, computational methods for CRM identification.
13 and microarray expression studies have led to attempts to predict the number and interactions of CRMs necessary to achieve given gene expression patterns 59–61. In situations where comparable sequence information is not available, CRMs can still be identified by integrating information from chromatin immunoprecipitation on chip (chip) and ChIP-sequencing (ChIP-seq) that can identify regions where specific factors bind or where the chromatin is in the open conformation across the whole genome. Information from such experiments can be used to make sequence search models more accurate62. In relatively simple systems, such as segmentation in drosophila, a knowledge of the spatiotemporal expression of a range of factors and a clearly discernible output can be combined to make accurate models of CRM interactions based on probabilistic models of site occupancy63. Confirmation of networks predicted by such systems still requires some form of specific site ablation or knockdown.
The spatiotemporal expression pattern of a given gene can be determined by a combination of whole mount in situ hybridisation (WMISH) and quantitative PCR (qPCR), respectively. Ablation of whole CRMs, or sites within CRMs, that target the gene of interest can be followed by a mixture of WMISH, qPCR and microarray analysis64. A gold standard of confidence a CRM mode of action can be obtained by performing either in vivo gene ablation or knock-down and rescue of effect. A combination of approaches can be used to identify gene regulatory networks including statistical mechanics, in vivo knock outs and knowledge of protein-protein interactions65. An example of how prior knowledge of relevant GRNs, inter-species sequence comparison, gene knock-downs and reporter constructs can be used to elucidate mechanisms of gene regulation is presented by Ransick
et al.66. In this case, the mechanism of how Notch signalling is integrated in the decision
16 A crucial concept in CRM function is activator synergy71 and the regulatory logic gates are a form of transcription factor synergy. Cooperative binding is an obvious mechanism of activator synergy. This direct type of interaction may be transmitted short distances by one or more third party factors, the binding of which stabilises each of the DNA binding proteins. Indirect synergies can also occur: A factor bound to one site might recruit a chromatin remodelling complex or cause nucleosome slippage that adjusts the chromatin structure so as to expose another site7,72,73. Similarly, some effects that would otherwise be observable by single site sequence modification could be masked due to redundancy in the regulatory systems37. To observe and understand these effects, a combinatorial approach must be taken where pairs and whole sets of sites are simultaneously mutated and the effects observed. In this manner, an ‘alphabet’ of common networks or motifs of cis-regulatory functionalities can arise. Such a compendium would prove invaluable for future developments in the field of synthetic biology that might lift systems whole sale from those that already exist.
Investigation of CRM function by combinatorial investigation of transcription factor binding can be performed by examining the activity of CRMs that have sites mutated in pairs, triplets or more. By carefully comparing expression of reporter genes in the context of every combination of the ‘on’ (wild type) and ‘off’ (mutated) sites, a clear picture can be obtained of the effect and function of each site within the context of the presence or absence of each other site. This type of manipulation is usually achieved by gene ablation where sections or sites within the regulatory regions are removed.
17 making short (<5 bp) changes to the sequence75,76. SDM cannot make multiple changes in a single reaction and is limited in terms of the length of the change. Therefore SDM is suitable for targeting individual sites, but cannot make large scale changes. Thus SDM is only suitable for the generation of limited, small scale libraries. More recently, zinc-finger nucleases have been employed to make alter sequences at specific sites in the sea urchin genome77. Zinc finger nucleases rely on accurate targeting via DNA binding domains and therefore suffer the same limitations of restriction enzymes. These techniques offer a method to determine whether a given sequence is capable of affecting the expression of a target gene.
Error-prone polymerase chain reaction (PCR) could be used to produce a library of variants of a single sequence78,79, with this library then being assessed for activity. This method would, however, not make use of any of the available a priori information available in this situation and would make changes to all parts of the sequence at random rather than at specific sites as desired. The various methods of library production are discussed in more detail in section 8.1.
To produce a set of sequences, therefore, that are capable of interrogating the apparent complex, higher order interactions between previously identified CRMs (see section 3.5) a combinatorial approach must be taken which existing techniques are not suitable to provide. Such an approach would require the development of new technologies and techniques necessary for the efficient generation of the library.
1.7. Thesis aims and objectives
18 synthesis techniques useful information about how regulation of gene expression can be obtained24. Combinatorial libraries can be used to supplement traditional approaches of construct generation for transient expression studies in suitable cell culture models to rapidly elucidate the complex interactions between factors bound to discrete sites in the CRMs and the promoter of the myod gene. This type of investigation can also determine whether the mechanisms by which the previously identified CRMs of myod act in a manner consistent with either the billboard or enhanceosome model.
De novo gene assembly is such a technology that could be used to produce a library
19 Figure 1.4: Chart showing a high level breakdown of the different aspects required for the development of novel technology for the investigation of CRM interactions presented in this thesis. The thesis breaks down into three main subject areas; library design, microfluidics and DNA assembly. Each of these areas involves several distinct aspects that are split amongst the chapters as appropriate.
A combinatorial mutant library was designed by taking into account information from a variety of sources. Chapter 2 outlines the diverse signalling pathways involved in muscle specification and the regulation of myod. How these signalling events are integrated at the myod promoter is less clear, despite the considerable effort in the last two decades by
20 Figure 1.5: Flow chart describing the process of determining the sequences that make up the mutational library (see chapter 3). The process starts with previous work by firstly by H. Crutzen and secondly by P. Downton. Using information from this previous work and modelling of the CRM interactions by J. Reid and others, a CRM system of a set of sites to mutate within a specific CRM were selected. These sites were then used to produce a mutant library that consists of a complete set of combinatorial mutations of these sites.
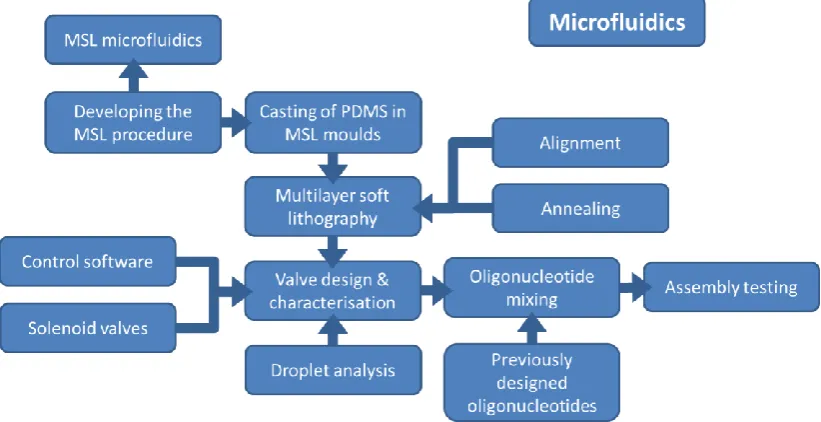
Chapter 3 reviews the application of microfabrication technologies to the production of microfluidics that could be used in this project. Whilst suitable for methods development and small scale library generation, molecular biology on the bench top scale is unsuitable for the generation of large scale, productive development. As a result, a method for the fabrication of microfluidic devices for the contamination free mixing of DNA assembly substrates is described in chapter 6. The microfluidic devices were fabricated by multilayer soft lithography, with each layer of the device composed of polydimethylsiloxane (PDMS) casts of moulds fabricated by microstereolithography (MSL). The process of optimising MSL for the production of microfluidic devices and its use as a mould to cast PDMS is described in chapter 5. Figure 1.6 shows a flow chart that describes the process employed here for the development, assembly and testing of the microfluidics in this project.
21 Figure 1.6: Flow chart describing the process for the development, assembly and testing of the microfluidic oligonucleotide mixing chip used in this project (see chapters 5 and 6). The MSL procedure was characterised and used to make MSL moulds from which PDMS casts were obtained. Several processes were necessary for the successful operation of the microfluidic chip: Assembly of the chip by multilayer soft lithograph and fabrication and writing of electronics and control software. The successfully assembled and characterised microfluidic chip was then employed to make oligonucleotide mixtures.
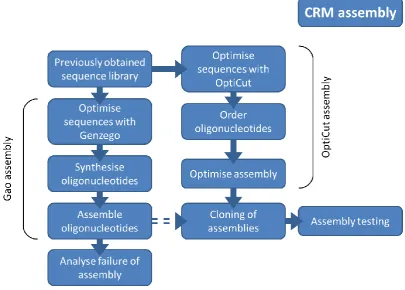
22 Figure 1.7: Flow chart describing the CRM assembly process used in this project (see chapter 8). The Gao assembly (section 8.2) process was the first attempted and failed at the assembly of oligonucleotides step. An alternative approach, OptiCut assembly (section 8.3), was then used as the source CRM mutant sequences that were then partially tested.
Whilst knock-down of a specific factor can yield high quality evidence of that factor’s importance to the regulation of a factor, knockdown alone does not indicate whether the observed effect is direct or indirect. Initially, observation of effects on the basis of ablation of specific sites or combinations of sites is a useful first step to identifying the factors to knock-down in further analysis.
Finally, chapter 9 describes the testing of both the position-orientation dependence of the CRMs (see section 9.3) and of a small portion of the mutant library (see section 9.4) generated in chapter 8. The position-orientation investigation shows whether the observed effects are an artificial product of the plasmid environment into which they are place or representative of the CRMs acting as independent regulatory entities.
[image:53.595.117.523.75.365.2]23 1.8. References
1. Davidson, E.H. The regulatory genome: Gene regulatory networks in development and evolution. (Academic Press: San Diego, CA., 2006).
2. Vaquerizas, J.M., Kummerfeld, S.K., Teichmann, S. a & Luscombe, N.M. A census of human transcription factors: function, expression and evolution. Nature reviews. Genetics10, 252-63 (2009).
3. Levine, M. & Davidson, E.H. Gene regulatory networks for development. Proceedings of the National Academy of Sciences of the United States of America102, 4936-42 (2005).
4. Ono, K. & Han, J. The p38 signal transduction pathway: activation and function. Cellular signalling12, 1-13 (2000).
5. Pourquié, O., Coltey, M., Teillet, M. a, Ordahl, C. & Le Douarin, N.M. Control of dorsoventral patterning of somitic derivatives by notochord and floor plate. Proceedings of the National Academy of Sciences of the United States of America90, 5242-6 (1993).
6. Svejstrup, J.Q. The RNA polymerase II transcription cycle: cycling through chromatin.
Biochimica et biophysica acta1677, 64-73 (2004).
7. Bai, L. & Morozov, A.V. Gene regulation by nucleosome positioning. Trends in genetics : TIG
26, 476-83 (2010).
8. Cedar, H. & Bergman, Y. Linking DNA methylation and histone modification: patterns and paradigms. Nature reviews. Genetics10, 295-304 (2009).
9. Reik, W. Stability and flexibility of epigenetic gene regulation in mammalian development.
Nature447, 425-32 (2007).
10. Piran, R., Halperin, E., Guttmann-Raviv, N., Keinan, E. & Reshef, R. Algorithm of myogenic differentiation in higher-order organisms. Development (Cambridge, England)136, 3831-40 (2009).
11. Payankaulam, S., Li, L.M. & Arnosti, D.N. Transcriptional repression: conserved and evolved features. Current biology : CB20, R764-71 (2010).
12. Smale, S.T. & Kadonaga, J.T. The RNA polymerase II core promoter. Annual review of biochemistry72, 449-79 (2003).
13. Juven-Gershon, T. & Kadonaga, J.T. Regulation of Gene Expression via the Core Promoter and the Basal Transcriptional Machinery. Developmental biology339, 225-229 (2010). 14. Gershenzon, N.I. & Ioshikhes, I.P. Synergy of human Pol II core promoter elements revealed
by statistical sequence analysis. Bioinformatics (Oxford, England)21, 1295-300 (2005). 15. Maston, G. a, Evans, S.K. & Green, M.R. Transcriptional regulatory elements in the human
genome. Annual review of genomics and human genetics7, 29-59 (2006).
16. Ptashne, M. & Gann, A. Transcriptional activation by recruitment. Nature386, 569-577 (1997).
17. Blackwood, E.M. Going the Distance: A Current View of Enhancer Action. Science281, 60-63 (1998).
18. Li, Q., Peterson, K.R., Fang, X. & Stamatoyannopoulos, G. Locus control regions. Blood100, 3077-86 (2002).
19. Panne, D. The enhanceosome. Current opinion in structural biology18, 236-42 (2008). 20. Panne, D., Maniatis, T. & Harrison, S.C. An atomic model of the interferon-beta
enhanceosome. Cell129, 1111-23 (2007).
21. Gowri, P.M., Yu, J.H., Shaufl, A., Sperling, M.A. & Menon, R.K. Recruitment of a
Repressosome Complex at the Growth Hormone Receptor Promoter and Its Potential Role in Diabetic Nephropathy. Molecular and Cellular Biology23, 815-825 (2003).
22. Lee, B. et al. From an enhanceosome to a repressosome: molecular antagonism between glucocorticoids and EGF leads to inhibition of wound healing. Journal of molecular biology
345, 1083-97 (2005).
24
24. Jeziorska, D.M., Jordan, K.W. & Vance, K.W. A systems biology approach to understanding cis-regulatory module function. Seminars in cell & developmental biology20, 856-62 (2009). 25. Ben-Tabou de-Leon, S. & Davidson, E.H. Gene regulation: gene control network in
development. Annual review of biophysics and biomolecular structure36, 191 (2007). 26. Berman, B.P. et al. Exploiting transcription factor binding site clustering to identify
cis-regulatory modules involved in pattern formation in the Drosophila genome. Proceedings of the National Academy of Sciences of the United States of America99, 757-762 (2002). 27. Arnone, M.I. & Davidson, E.H. The hardwiring of development: Organization and function of
genomic regulatory systems. Development124, 1851-64 (1997).
28. Kulkarni, M.M. & Arnosti, D.N. Information display by transcriptional enhancers.
Development (Cambridge, England)130, 6569-75 (2003).
29. Istrail, S., De-Leon, S.B.-T. & Davidson, E.H. The regulatory genome and the computer.
Developmental biology310, 187-95 (2007).
30. Buchler, N.E., Gerland, U. & Hwa, T. On schemes of combinatorial transcription logic.
Proceedings of the National Academy of Sciences of the United States of America100, 5136-41 (2003).
31. Bintu, L. et al. Transcriptional regulation by the numbers: models. Current opinion in genetics & development15, 116-24 (2005).
32. Zartman, J.J. & Shvartsman, S.Y. Enhancer organization: transistor with a twist or something in a different vein? Current biology17, R1048-50 (2007).
33. Cameron, R.A. & Davidson, E.H. Flexibility of transcription factor target site position in conserved cis-regulatory modules. Developmental biology336, 122-35 (2009).
34. Istrail, S. & Davidson, E.H. Logic functions of the genomic cis-regulatory code. Proceedings of the National Academy of Sciences of the United States of America102, 4954-9 (2005). 35. McAdams, H.H., Srinivasan, B. & Arkin, A.P. The evolution of genetic regulatory systems in
bacteria. Nature reviews. Genetics5, 169-78 (2004).
36. Teichmann, S.A. & Babu, M.M. Gene regulatory network growth by duplication. Nature genetics36, 492-6 (2004).
37. Barolo, S. Shadow enhancers: Frequently asked questions about distributed cis-regulatory information and enhancer redundancy. BioEssays34, 135-141 (2011).
38. Carroll, S.B. Evo-devo and an expanding evolutionary synthesis: a genetic theory of morphological evolution. Cell134, 25-36 (2008).
39. Hoekstra, H.E. & Coyne, J. a The locus of evolution: evo devo and the genetics of adaptation.
Evolution; international journal of organic evolution61, 995-1016 (2007).
40. Wagner, G.P., Pavlicev, M. & Cheverud, J.M. The road to modularity. Nature reviews. Genetics8, 921-31 (2007).
41. Davidson, E.H. & Erwin, D.H. Gene regulatory networks and the evolution of animal body plans. Science311, 796-800 (2006).
42. Litvin, O., Causton, H.C., Chen, B.-J. & Pe’er, D. Modularity and interactions in the genetics of gene expression. Proceedings of the National Academy of Sciences of the United States of America106, 6441-6 (2009).
43. Babu, M.M., Luscombe, N.M., Aravind, L., Gerstein, M. & Teichmann, S. a Structure and evolution of transcriptional regulatory networks. Current opinion in structural biology14, 283-91 (2004).
44. Pownall, M.E., Gustafsson, M.K. & Emerson, C.P. Myogenic Regulatory Factors and the Specification of Muscle Progenitors in Vertebrate Embryos. Annual Reviews in Cell and Developmental Biology18, 747-783 (2002).
45. Kulkarni, M.M. & Arnosti, D.N. cis -Regulatory Logic of Short-Range Transcriptional Repression in Drosophila melanogaster. Molecular and Cellular Biology25, 3411-3420 (2005).
25
47. Tolhuis, B., Palstra, R.-jan, Splinter, E., Grosveld, F. & Laat, W.D. Looping and Interaction between Hypersensitive Sites in the Active b -globin Locus. Molecular Cell10, 1453-1465 (2002).
48. Bulger, M. & Groudine, M. Looping versus linking: toward a model for long-distance gene activation. Genes & development13, 2465-77 (1999).
49. Dekker, J., Rippe, K., Dekker, M. & Kleckner, N. Capturing Chromosome Conformation.
Science295, 1306-1311 (2002).
50. Dekker, J. Gene Regulation in the Third Dimension. Science319, 1793-1794 (2008). 51. Sexton, T., Bantignies, F. & Cavalli, G. Genomic interactions: chromatin loops and gene
meeting points in transcriptional regulation. Seminars in cell & developmental biology20, 849-55 (2009).
52. Fiering, S., Whitelaw, E. & Martin, D.I. To be or not to be active: the stochastic nature of enhancer action. BioEssays : news and reviews in molecular, cellular and developmental biology22, 381-7 (2000).
53. Zinzen, R.P., Girardot, C., Gagneur, J., Braun, M. & Furlong, E.E.M. Combinatorial binding predicts spatio-temporal cis-regulatory activity. Nature462, 65-70 (2009).
54. Aerts, S., Van Loo, P., Thijs, G., Moreau, Y. & De Moor, B. Computational detection of cis -regulatory modules. Bioinformatics19, ii5-ii14 (2003).
55. Sharan, R., Ben-Hur, A., Loots, G.G. & Ovcharenko, I. CREME: Cis-Regulatory Module Explorer for the human genome. Nucleic acids research32, W253-6 (2004).
56. Xie, X. et al. Systematic discovery of regulatory motifs in human promoters and 3′ UTRs by comparison of several mammals. Nature434, 338-345 (2005).
57. Rebeiz, M., Reeves, N.L. & Posakony, J.W. SCORE : A computational approach to the identification of cis-regulatory modules and target genes in whole-genome sequence data.
Proceedings of the National Academy of Sciences of the United States of America99, 9888-93 (2002).
58. Yu, X., Lin, J., Zack, D.J. & Qian, J. Identification of tissue-specific cis-regulatory modules based on interactions between transcription factors. BMC bioinformatics8, 437 (2007). 59. Noto, K. & Craven, M. Learning probabilistic models of cis-regulatory modules that represent
logical and spatial aspects. Bioinformatics23, e156-62 (2007).
60. Zhang, J., Yuan, Z. & Zhou, T. Synchronization and clustering of synthetic genetic networks: A role for cis-regulatory modules. Physical Review E79, 1-12 (2009).
61. Segal, E., Friedman, N., Kaminski, N., Regev, A. & Koller, D. From signatures to models: understanding cancer using microarrays. Nature genetics37 Suppl, S38-45 (2005).
62. Won, K.-J. et al. An integrated approach to identifying cis-regulatory modules in the human genome. PloS one4, e5501 (2009).
63. Segal, E., Raveh-Sadka, T., Schroeder, M., Unnerstall, U. & Gaul, U. Predicting expression patterns from regulatory sequence in Drosophila segmentation. Nature451, 535-40 (2008). 64. Dean, A.K., Harris, S.E., Kalajzic, I. & Ruan, J. A systems biology approach to the identification
and analysis of transcriptional regulatory networks in osteocytes. BMC bioinformatics10 Suppl 9, S5 (2009).
65. Geier, F., Timmer, J. & Fleck, C. Reconstructing gene-regulatory networks from time series, knock-out data, and prior knowledge. BMC systems biology1, 11 (2007).
66. Ransick, A. & Davidson, E.H. cis-regulatory processing of Notch signaling input to the sea urchin glial cells missing gene during mesoderm specification. Developmental biology297, 587-602 (2006).
67. Yuh, C.-H., Bolouri, H. & Davidson, E.H. Genomic Cis-Regulatory Logic: Experimental and Computational Analysis of a Sea Urchin Gene. Science279, 1896-1902 (1998).
68. Howard, M.L. & Davidson, E.H. cis-Regulatory control circuits in development.
Developmental biology271, 109-18 (2004).
26
70. Guet, C.C., Elowitz, M.B., Hsing, W. & Leibler, S. Combinatorial synthesis of genetic networks.
Science (New York, N.Y.)296, 1466-70 (2002).
71. Levine, M. Transcriptional enhancers in animal development and evolution. Current biology : CB20, R754-63 (2010).
72. Jiang, C. & Pugh, B.F. Nucleosome positioning and gene regulation: advances through genomics. Nature reviews. Genetics10, 161-72 (2009).
73. Ay, A. & Arnosti, D.N. Nucleosome positioning: an essential component of the enhancer regulatory code? Current biology : CB20, R404-6 (2010).
74. Goldhamer, D., Faerman, A., Shani, M. & Emerson Jr, C. Regulatory elements that control the lineage-specific expression of myoD. Science256, 538-542 (1992).
75. Sucov, H.M., Hough-Evans, B.R., Franks, R.R., Britten, R.J. & Davidson, E.H. A regulatory domain that directs lineage-specific expression of a skeletal matrix protein gene in the sea urchin embryo. Genes & Development2, 1238-1250 (1988).
76. Kappel, A. et al. Role of SCL / Tal-1 , GATA , and Ets transcription factor binding sites for the regulation of Flk-1 expression during murine vascular development. Blood96, 3078-3085 (2000).
77. Ochiai, H. et al. Targeted mutagenesis in the sea urchin embryo using zinc-finger nucleases.
Genes to cells : devoted to molecular & cellular mechanisms15, 875-85 (2010). 78. Fujii, R., Kitaoka, M. & Hayashi, K. Error-prone rolling circle amplification: the simplest
random mutagenesis protocol. Nature protocols1, 2493-7 (2006).
27
Chapter 2
2.
Traditional and combinatorial investigations into the regulation
of
myod
The regulation of the muscle regulatory factor (MRF) myod was investigated to examine the mechanisms underpinning the expression of this tightly regulated factor. This chapter aims to summarise the key findings in the literature about the mechanisms of myod regulation in mouse (Mus muculus) in a variety of developmental contexts. Information from the literature, summarised in sections 2.1 to 2.4, is combined with data obtained by previous researchers within the group that this research project is based to present a current understanding of myod regulation. By developing on this previous work, the position/orientation of the previously identified CRMs can be determined. Furthermore, combinatorial mutant libraries can be developed and tested in order to deduce the activity of specific sites within a CRM.
2.1. Muscle specification in vivo