University of Warwick institutional repository:
http://go.warwick.ac.uk/wrap
A Thesis Submitted for the Degree of PhD at the University of Warwick
http://go.warwick.ac.uk/wrap/56120
This thesis is made available online and is protected by original copyright.
Please scroll down to view the document itself.
Blood Pressure and its Correlates in Children
and Adolescents in Urban Nigeria
by
Oluwatoyin Apeke Ogboye
A thesis submitted in partial fulfilment of the requirements for the
degree of
Doctor of Philosophy in Health Sciences
University of Warwick, Warwick Medical School
1
TABLE OF CONTENTS
DEDICATION ... 9
ACKNOWLEDGEMENTS ... 10
DECLARATION... 11
ABBREVIATIONS ... 12
ABSTRACT ... 13
1.0 INTRODUCTION ... 15
1.1 INTRODUCTION ... 15
1.2 ORIGIN OF MY INTEREST ... 19
1.3 OVERVIEW OF THE THESIS STRUCTURE ... 21
2.0 BACKGROUND ... 24
2.1 SETTING OF STUDY ... 24
2.1.1 COUNTRY PROFILE ... 24
2.1.2 STUDY AREA - PROFILE OF LAGOS STATE ... 31
2.1.2.1 THE EDUCATION SYSTEM ... 33
2.2 STUDY BACKGROUND ... 37
2.2.1 THE THEORY OF EPIDEMIOLOGICAL TRANSITION AND ACCOMPANYING TRANSITIONS ... 37
2.2.2 GLOBAL STATUS ON DISEASE PATTERN ... 41
2.2.3 CHRONIC NON-COMMUNICABLE DISEASES ... 44
2.2.4 CARDIOVASCULAR DISEASE ... 45
2.2.5 HYPERTENSION ... 48
2.2.6 HYPERTENSION IN CHILDREN AND ADOLESCENTS... 50
2.2.6.1 DEFINITION OF HYPERTENSION IN CHILDREN AND ADOLESCENTS ... 51
2.2.6.2 AETIOLOGY OF CHILDHOOD HYPERTENSION ... 54
2.2.6.3 ASSOCIATED FACTORS FOR VARIATION IN BLOOD PRESSURE IN CHILDREN AND ADOLESCENTS ... 54
2
3.0 LITERATURE REVIEW ... 61
3.1 EPIDEMIOLOGY OF HYPERTENSION IN CHILDREN AND ADOLESCENTS . 62 3.2 SOCIO-ECONOMIC CHARACTERISTICS AND BLOOD PRESSURE IN CHILDREN AND ADOLESCENTS ... 91
3.3 ADIPOSITY AND BLOOD PRESSURE IN CHILDREN AND ADOLESCENTS115 3.4 PUBERTAL MATURATION AND BLOOD PRESSURE ... 135
3.5 JUSTIFICATION OF THE STUDY ... 159
3.6 RESEARCH QUESTIONS ... 161
3.7 AIMS AND OBJECTIVES ... 161
3.8 NULL HYPOTHESES ... 162
4.0 METHODOLOGICAL ISSUES ... 164
4.1 STUDY SETTING ... 164
4.2 STUDY DESIGN ... 165
4.3 SAMPLE SELECTION ... 166
4.3.1 SCHOOL SELECTION ... 166
4.3.2 PUPIL SELECTION ... 167
4.4 DATA COLLECTION ... 168
4.4.1 BLOOD PRESSURE MEASUREMENT DEVICE ... 168
4.4.2 MEASURES OF ADIPOSITY ... 170
4.4.3 SOCIO-DEMOGRAPHIC INFORMATION AND HEALTH HISTORY... 172
4.4.4 PHYSICAL ACTIVITY LEVEL ... 173
4.4.5 SALT INTAKE ... 174
4.4.6 SOCIO-ECONOMIC CHARACTERISTICS ... 177
4.4.7 PUBERTAL MATURATION STATUS ... 191
4.5 PARTICIPANT CONSENT ... 194
4.6 PARTICIPANT INCENTIVE ... 196
5.0 PILOT STUDY ... 200
5.1 AIMS AND OBJECTIVES ... 200
5.2 METHODS ... 201
5.2.1 STUDY AREA ... 201
5.2.2 STUDY DESIGN ... 201
5.2.3 PARTICIPANT SELECTION ... 201
3
5.2.5 TRAINING OF RESEARCH ASSISTANTS ... 204
5.2.6 ASSESSMENT METHOD ... 205
5.2.7 DATA ENTRY, CLEANING AND QUALITY ... 210
5.2.8 DATA ANALYSIS ... 210
5.2.8.1 DESCRIPTIVE STATISTICS ... 211
5.2.8.2 INFERENTIAL STATISTICS ... 211
5.3 RESULTS ... 213
5.3.1 PROCEDURAL ISSUES... 213
5.3.2 DESCRIPTION OF PARTICIPANTS ... 216
5.3.3 BLOOD PRESSURE PATTERN ... 217
5.3.3.1 MEAN SYSTOLIC BLOOD PRESSURE OF THE STUDY PARTICIPANTS ... 217
5.3.3.2 MEAN DIASTOLIC BLOOD PRESSURE OF THE STUDY PARTICIPANTS ... 218
5.3.4 PREVALENCE OF HYPERTENSION... 219
5.3.5 LINEAR RELATIONSHIP BETWEEN BLOOD PRESSURE AND CONTINUOUS VARIABLES ... 220
5.3.6 UNIVARIATE LINEAR REGRESSION ANALYSIS – ASSOCIATION BETWEEN BLOOD PRESSURE AND SELECTED VARIABLES ... 221
5.3.7 MULTIPLE REGRESSION MODELS – ASSOCIATION BETWEEN BLOOD PRESSURE AND SELECTED VARIABLES ... 223
5.3.7.1 ASSOCIATION BETWEEN BLOOD PRESSURE AND PUBERTAL STATUS AND BMI: MULTIPLE REGRESSION MODEL 1... 223
5.3.7.2 ASSOCIATION BETWEEN BLOOD PRESSURE AND PUBERTAL STATUS AND WAIST CIRCUMFERENCE: MULTIPLE REGRESSION MODEL 2 ... 226
5.4 DISCUSSION AND CONCLUSION... 228
6.0 METHODS ... 231
6.1 STUDY SETTING ... 231
6.2 STUDY DESIGN ... 231
6.3 SAMPLE SIZE CALCULATION ... 231
6.4 ETHICAL APPROVAL ... 232
6.5 PARTICIPANT SELECTION ... 232
6.5.1 SCHOOL SELECTION ... 232
4
6.6 PROCEDURE ... 234
6.7 TRAINING OF RESEARCH ASSISTANTS ... 236
6.8 DATA COLLECTION ... 237
6.8.1 MATERIALS ... 238
6.8.2 ASSESSMENT METHOD ... 241
6.9 DATA HANDLING ... 251
6.10 DATA QUALITY, ENTRY AND CLEANING ... 252
6.11 DATA ANALYSIS ... 252
6.11.1 PRINCIPAL COMPONENTS ANALYSIS FOR HOUSEHOLD WEALTH INDEX ... 253
6.11.2 EXPLORATORY ANALYSIS ... 254
6.11.3 DESCRIPTIVE STATISTICS ... 254
6.11.4 INFERENTIAL STATISTICS ... 255
7.0 RESULTS ... 260
7.1 RESPONSE RATES ... 260
7.2 DESCRIPTIVE STATISTICS ... 261
7.2.1 SOCIO-DEMOGRAPHIC, SOCIO-ECONOMIC AND OTHER IMPORTANT CHARACTERISTICS OF STUDY PARTICIPANTS ... 261
7.2.2 PHYSICAL CHARACTERISTICS OF STUDY PARTICIPANTS ... 263
7.3 PREVALENCE OF HYPERTENSION ... 266
7.4 BLOOD PRESSURE PATTERN ... 269
7.4.1 MEAN SYSTOLIC AND DIASTOLIC BLOOD PRESSURE OF THE STUDY PARTICIPANTS ... 269
7.5 LINEAR RELATIONSHIP BETWEEN BLOOD PRESSURE AND CONTINUOUS VARIABLES ... 273
7.6 SELECTION OF VARIABLES FOR THE MULTIPLE REGRESSION MODEL 274 7.6.1 SELECTION OF VARIABLES OF ADIPOSITY FOR THE MULTIPLE REGRESSION MODEL ... 274
7.6.2 SELECTION OF VARIABLES OF SOCIO-ECONOMIC CHARACTERISTICS FOR THE MULTIPLE REGRESSION MODEL ... 275
7.7 MULTIPLE REGRESSION MODELS – ASSOCIATION BETWEEN BLOOD PRESSURE AND SELECTED VARIABLES ... 276
5
7.7.2 ASSOCIATION BETWEEN BLOOD PRESSURE AND WEALTH INDEX, PUBERTAL STATUS AND WAIST CIRCUMFERENCE: MULTIPLE
REGRESSION MODEL 2 ... 279
7.7.3 ASSOCIATION BETWEEN BLOOD PRESSURE AND SCHOOL FEE LEVEL, PUBERTAL STATUS AND BMI: MULTIPLE REGRESSION MODEL 3 ... 282
7.7.4 ASSOCIATION BETWEEN BLOOD PRESSURE AND SCHOOL FEE LEVEL, PUBERTAL STATUS AND WAIST CIRCUMFERENCE: MULTIPLE REGRESSION MODEL 4 ... 285
8.0 DISCUSSION ... 293
8.1 PRINCIPAL FINDINGS OF THE THESIS ... 293
8.2 STRENGTHS AND LIMITATIONS ... 298
8.3 COMPARISON WITH PREVIOUS STUDIES ... 303
8.4 IMPLICATIONS FOR POLICY ... 313
8.5 IMPLICATIONS FOR PRACTICE ... 314
8.6 IMPLICATIONS FOR RESEARCH ... 315
8.7 CONCLUSION ... 317
REFERENCES ... 320
APPENDICES ... 368
APPENDIX 1: BP LEVELS FOR BOYS BY AGE AND HEIGHT PERCENTILE .... 368
APPENDIX 2: BP LEVELS FOR GIRLS BY AGE AND HEIGHT PERCENTILE ... 369
APPENDIX 3: WHO BMI REFERENCE DATA FOR BOYS AND GIRLS ... 370
APPENDIX 4: WAIST CIRCUMFERENCE ESTIMATED VALUE FOR PERCENTILE REGRESSION FOR AFRICAN AMERICAN CHILDREN AND ADOLESCENTS BY GENDER ... 375
APPENDIX 5: MINISTRY OF EDUCATION APPROVAL LETTER ... 376
APPENDIX 6: CMUL, RESEARCH GRANTS AND EXPERIMENTATION ETHICS COMMITTEE APPROVAL LETTER ... 377
APPENDIX 7: BIOMEDICAL RESEARCH ETHICS COMMITTEE APPROVAL LETTER ... 378
APPENDIX 8: LETTER TO PRINCIPAL/HEAD TEACHER ... 379
APPENDIX 9: LETTER TO STUDENT ... 383
APPENDIX 10: LETTER TO PARENT/CARER ... 387
6
APPENDIX 12: FLOW CHART FOR THE STUDY IN SCHOOLS... 393
APPENDIX 13: SURVEY QUESTIONNAIRE FOR BOYS ... 394
APPENDIX 14: SURVEY QUESTIONNAIRE FOR GIRLS... 415
APPENDIX 15: LETTER TO PARENT/CARER FOR A CHILD WITH NORMAL BLOOD PRESSURE... 436
APPENDIX 16: LETTER TO PARENT/CARER FOR A CHILD WITH HIGH NORMAL BLOOD PRESSURE ... 437
APPENDIX 17: LETTER TO PARENT/CARER FOR A CHILD WITH HIGH BLOOD PRESSURE ... 438
APPENDIX 18: EXPLORATORY ANALYSIS ... 439
APPENDIX 19: ASSOCIATION BETWEEN DIASTOLIC BLOOD PRESSURE AND SCHOOL FEE LEVEL ... 469
LIST OF FIGURES
Figure 1: Conceptual Framework: Relationship between blood pressure and measures of socio-economic characteristics, anthropometric measures of adiposity or fatness and pubertal maturation status in children and adolescents. ... 19Figure 2: The Map of Nigeria showing its location in Africa and also showing the Federal capital territory – Abuja and Lagos State (the study area). ... 25
Figure 3: The Map of Nigeria showing the 36 States and the Federal capital territory – Abuja. ... 26
Figure 4: Population Pyramid, Nigeria, Census 2006 ... 27
Figure 5: The Map of Nigeria showing the population density across the 36 States and the Federal capital territory – Abuja. ... 27
Figure 6: The Map of Lagos State showing the local government areas. ... 32
Figure 7: Projected Main Causes of Death in selected countries, all ages, 2005 ... 42
Figure 8: Projected Main Causes of Death in selected countries, all ages, 2015 ... 42
Figure 9: Projected Main Causes of Death, worldwide, all ages, 2005 ... 47
Figure 10: Projected Main Causes of Global Burden of Disease (DALYs), worldwide, all ages, 2005 ... 48
Figure 11: Prevalence of hypertension in children and adolescents in Nigeria, Other African countries, USA, Europe, India, and Middle East... 71
Figure 12: Omron HEM-907 Digital Blood pressure monitor ... 238
Figure 13: Seca 877 Class III Weighing scale ... 239
Figure 14: Seca Leicester Portable Height Measure ... 239
Figure 15: Seca 201 Circumference Measuring Tape ... 240
Figure 16: Students filling out the questionnaire. ... 244
Figure 17: Student undertaking Blood Pressure measurement. ... 246
Figure 18: Student undertaking weight measurement. ... 248
Figure 19: Student undertaking Height measurement. ... 249
7
LIST OF TABLES
Table 1: Demographic, Health and Socio-economic indicators of Nigeria. ... 30
Table 2: Stages of the Epidemiological Transition ... 39
Table 3: Common causes of Hypertension by age group ... 54
Table 4: The prevalence of hypertension in children and adolescents in population studies in Nigeria and other parts of the world. ... 74
Table 5: Association between measures of socio-economic characteristics and blood pressure in children and adolescents ... 102
Table 6: Association between anthropometric measures of adiposity (BMI and waist circumference (WC)) and blood pressure in children and adolescents ... 123
Table 7: Association between pubertal maturation and blood pressure in children and adolescents ... 147
Table 8: Characteristics of the pilot study population ... 216
Table 9: Mean, Standard deviation and Range of age, weight, height, body mass index waist circumference and physical activity by gender in the study population. ... 217
Table 10: Difference in Mean Systolic Blood Pressure within categories of selected variables ... 218
Table 11: Difference in Mean Diastolic Blood Pressure within categories of selected variables ... 219
Table 12: Correlation between Systolic and Diastolic blood pressure and selected continuous variables ... 220
Table 13: Univariate linear regression analysis of selected variables and Blood Pressure. ... 222
Table 14: Multiple Regression Analysis of selected variables and Blood Pressure – Model 1 (BMI) ... 225
Table 15: Multiple Regression Analysis of selected variables and Blood Pressure – Model 2 (Waist circumference) ... 227
Table 16: Recommended Dimensions for BP Cuff Bladders. ... 246
Table 17: Characteristics and Response rates for each school ... 260
Table 18: Socio-demographic, socio-economic, pubertal, anthropometric and other important characteristics of the study participants ... 262
Table 19: Physical Characteristics of the study participants, by gender ... 265
Table 20: Physical Characteristics of the study participants, by school fee level... 265
Table 21: Blood Pressure status of study participants ... 268
Table 22: Mean Systolic Blood Pressure of the study participants ... 271
Table 23: Mean Diastolic Blood Pressure of the study participants ... 272
Table 24: Correlation between Systolic and Diastolic blood pressure and selected continuous variables ... 273
Table 25: Correlation between BMI and waist circumference ... 275
Table 26: Association between school fee level and wealth index ... 276
Table 27: Multiple Regression Analysis of selected variables and Blood Pressure – Model 1 (BMI and Wealth Index) ... 278
Table 28: Individual contribution of selected variables to the variation in Blood Pressure – Model 1 ... 279
Table 29: Multiple Regression Analysis of selected variables and Blood Pressure – Model 2 (Waist circumference and Wealth Index) ... 281
Table 30: Individual contribution of selected variables to the variation in Blood Pressure – Model 2 ... 282
8
Table 32: Individual contribution of selected variables to the variation in Blood Pressure – Model 3 ... 285
Table 33: Multiple Regression Analysis of selected variables and Blood Pressure –
Model 4 (Waist circumference and School fee level) ... 287
Table 34: Individual contribution of selected variables to the variation in Blood Pressure – Model 4 ... 288
Table 35: Variables that contribute to variations in systolic blood pressure in the four multiple regression models ... 289
Table 36: Variables that contribute to variations in diastolic blood pressure in the four multiple regression models ... 289
9
DEDICATION
I would like to dedicate this thesis to my mother, sisters, brother, brother-in-law and
nephew for their selfless and invaluable support throughout my course of study, and
10
ACKNOWLEDGEMENTS
I am most indebted to my supervisors, Professor Aileen Clarke, Professor Margaret
Thorogood, and Dr Kandala Ngianga-Bakwin for their assistance throughout my project,
who in spite of their tight schedule and commitments, sacrificed time to offer
constructive criticism at every stage of the project.
I would like to thank Professor Campbell at College of Medicine, University of Lagos for
providing access to the Research Assistants, the Research Assistants for their hard
work; and the study participants for their time, effort and generosity.
I would also like to thank the Directors of Research Degrees, Research Degrees
Co-ordinators, module tutors, and colleagues at the Warwick Medical School for the
11
DECLARATION
I hereby declare that this thesis is all my own work except where I have otherwise
stated and that this thesis has not been submitted for a degree at any other University.
Ogboye, Oluwatoyin Apeke
12
ABBREVIATIONS
ANOVA Analysis of variance
BMI Body mass index
BP Blood pressure
CVD Cardiovascular disease
DBP Diastolic blood pressure
DHS Demographic and Health Survey
K1 First Korotkoff sound phase
K4 Fourth Korotkoff sound phase
K5 Fifth Korotkoff sound phase
MDGs Millennium Development Goals
NCDs Chronic non-communicable diseases
PCA Principal components analysis
SBP Systolic blood pressure
S.D Standard deviation
SEC Socio-economic characteristics
UN United Nations
USA United States of America
WC Waist circumference
13
ABSTRACT
Background: A substantial increase in the incidence of chronic non-communicable diseases (NCDs) and a decline in communicable diseases and poverty-related diseases are occurring in developing countries (including Nigeria) as a result of an epidemiological transition. Given the burden and poor outcomes of NCDs related to hypertension or high blood pressure (BP) in adulthood, there is an urgent need for the identification of high risk individuals in early life. High BP has already been reported amongst young people worldwide, including Nigeria. High BP in childhood is predictive of high BP in adulthood. There is very little information available on the distribution of blood pressure in children and adolescents, and the factors which determine its distribution in Nigeria.
Objectives: To determine the association between: socio-economic characteristics and blood pressure, pubertal maturation status and blood pressure, and anthropometric measures of adiposity and blood pressure in children and adolescents in Nigeria; and also to determine the overall prevalence of hypertension in the population of secondary school aged children and adolescents in Nigeria.
Methods: A school-based stratified randomised cross-sectional survey of students aged 11 to 18 years was carried out in the urban area of Lagos, Nigeria. Blood pressure, body weight, height and waist measurements of the participants were obtained. A self-complete validated questionnaire was used to obtain socio-demographic information, health-related information, socio-economic characteristics (including living circumstances and parent/carer education level) and pubertal maturation status of the participants. Data analysis was carried out using descriptive statistics and multiple regression analysis.
Results: 1086 students (538 males and 548 females) participated in the study, giving a total response rate of 90.5%. The overall mean systolic and diastolic blood pressure was 105.23±12.63mmHg and 57.87±8.09mmHg, respectively. The overall prevalence of hypertension was 2.5%. Socio-economic characteristics, pubertal maturation status, body mass index and waist circumference were statistically significantly associated with systolic and diastolic blood pressure (p<0.05).
14
15
1.0 INTRODUCTION
In this chapter, I will present the important information underpinning the basis of the
present study. I will also describe the origin of my interest in the research topic, and the
structure of the thesis.
1.1 INTRODUCTION
“We cannot afford to say, ‘we must tackle other diseases first – HIV/AIDS, malaria,
tuberculosis – then we will deal with chronic diseases’. If we wait even 10 years, we will
find that the problem is even larger and more expensive to address”
– President Olusegun Obasanjo, former President of Nigeria
(World Health Organisation, 2005: ix).
Globally, disease profiles are altering dramatically (Raj and Kumar, 2010). In the new
millennium, the epidemiological transition is presenting in the form of a shift toward an
increase in prevalence of chronic non-communicable diseases (NCDs) (cardiovascular
disease (CVD), cancer, injuries and metabolic disease such as diabetes) and a decline
in communicable diseases (excluding HIV/AIDS), and poverty-related disease (maternal
and perinatal conditions, and nutritional deficiencies), collectively (Tharkar and
Viswanathan, 2009).
This transition has been linked to the current economic development,
socio-cultural transitions, rapid urbanisation, globalisation and westernisation experienced
globally (Longo-Mbenza et al., 2007), which are taking place alongside lifestyle
changes towards unhealthy diets and more sedentary lifestyles. Most notably the
16
wealthy middle-aged adults during the initial stage of transition but gradually affecting
deprived populations with continuing socio-economic transitions (Suchday et al., 2008;
Mendez et al., 2003; Colhoun et al., 1998). Nigeria, like other developing countries, is
experiencing an epidemiological transition phenomenon. This study was set in Lagos
State, a fast growing megacity in Nigeria, with the characteristic of a rapidly developing
society, where diseases of poverty and wealth coexist (Ben-Bassey et al., 2007).
Until recently, in many developing countries, chronic non-communicable diseases were
not considered to be public health challenges (Tang et al., 2007). The developing
countries have found themselves having to tackle the new epidemic of
non-communicable diseases (NCDs) while the scourge of non-communicable diseases, maternal
and perinatal conditions, and nutritional deficiencies are far from disappeared (World
Health Organisation, 2005). The consequences of chronic non-communicable diseases
are expected to be worse in the developing countries, where health system capacity to
cope with the disease condition is lax (Yach et al., 2004). A global action has recently
been taken on the prevention and control of chronic non-communicable diseases, with
primary concentration on developing countries. In late 2011, a political declaration was
adopted by the United Nations General Assembly during its High-Level meeting on
chronic non-communicable diseases (World Health Organisation, 2011a).
Cardiovascular disease (CVD) is the leading cause of death from chronic
non-communicable diseases (NCDs), and a major contributor of the disease burden from
chronic non-communicable diseases (NCDs), worldwide (World Health Organisation,
2005). The emerging epidemics of cardiovascular disease in developing countries form
the core of the phenomena of epidemiological transition (Raj and Kumar, 2010), hitting
pre-17
maturely (under 70 years of age) (World Health Organisation, 2012; Abegunde et al.,
2007). The increasing burden of cardiovascular disease in developing countries reflects
the increasing prevalence of cardiovascular disease risk factors, and specifically
hypertension (Ejike et al., 2008; Moura et al., 2004).
Hypertension is a major public health challenge for societies in epidemiological
transition, and contributes to 7.5 million deaths worldwide every year (World Health
Organisation, 2011a). Hypertension is a silent threat to the health of people worldwide
(Tesfaye et al., 2009), as it is most often asymptomatic (Anand and Tandon, 1996).
According to the World Health Organisation (2012), the mean blood pressure has
decreased remarkably in almost all developed countries, while it has remained
unchanged or increased in most developing countries. The morbidity and mortality of
adult hypertension is well established, and there is now a substantial body of evidence
from prospective studies indicating that blood pressure in adulthood may have its origin
in childhood and adolescence – the phenomenon of “tracking” (Chen and Wang, 2008).
This indicates that in order to investigate the early stage of the epidemiological
transition, it may be preferable to focus on the determinants of the health of children
rather than on those of adults.
Children and adolescents are an important segment of the society, as their health is
paramount. It can be used to represent the general health status of a society (Ramzan
et al., 2008). Interest in blood pressure assessment in children and adolescents has
increased, since its emergence in the 1960s, with the first recommendations on blood
pressure evaluation in children and adolescents in the 1970s (de Araujo et al., 2007).
Once considered relatively rare, primary or essential hypertension in children is more
18
pressure levels in children, as compared to the past notion that increased blood
pressure levels in children was mainly secondary hypertension (caused by a disease
condition) (Sorof and Daniels, 2002). Hypertension is increasingly recognised among
children and adolescents throughout the world, including Nigeria (Mijinyawa et al.,
2008); however, the specific prevalence of child and adolescent hypertension is
unknown.
Many factors that may account for population level blood pressure variations have been
established (Monyeki and Kemper, 2008). According to Ejike and Ugwu (2010), the
identification of attributes associated with higher blood pressure in children and
adolescents (in developing countries) may be instrumental in the interruption of
cardiovascular disease risk factors (such as hypertension), in order to counteract both
the risk of cardiovascular disease in adulthood and the impending burden on the health
systems of developing countries. In Nigeria, where the epidemiological transition is well
established, little is known about the distribution of blood pressure at younger ages and
its relationship to other characteristics in this society.
This study was carried out to provide epidemiological information on the association
between: socio-economic characteristics (school fee level, parent education level, and
household wealth index) and blood pressure, pubertal maturation status and blood
pressure, and anthropometric measures of adiposity (body mass index (BMI) and waist
circumference (WC)) and blood pressure in children and adolescents in Nigeria (the
conceptual framework for these relationships is shown in Figure 1); and also to
determine the overall prevalence of hypertension using internationally agreed
guidelines, for the population of secondary school aged children. To the best of my
19
pubertal maturation status and blood pressure in the African continent. It is expected
that the findings of this study will help to guide the development of health policy and
prevention strategies, and health practice that are essential to combat the
[image:21.612.99.573.182.458.2]cardiovascular disease epidemic in Nigeria in course of the epidemiological transition.
Figure 1: Conceptual Framework: Relationship between blood pressure and measures of socio-economic characteristics, anthropometric measures of adiposity or fatness and pubertal maturation status in children and adolescents.
1.2 ORIGIN OF MY INTEREST
This thesis was originally derived from my special interest in non-communicable
diseases, and my motivation to contribute to the research expertise in developing
countries. I am a Public Health Professional, with a background in Physiotherapy, and,
experience of working in national and international health organisations, where I have
had the opportunity to gain relevant knowledge on various health and developmental
issues worldwide. I am from Nigeria, a developing country, where the epidemiological
Pubertal maturation status
Physical activity, dietary salt intake, other factors Socio-economic characteristics –
School fee level, Parent education level, Household wealth index
Adiposity – BMI and Waist circumference
Blood Pressure
Age
Study Aim Study Aim
20
transition is evident in its urban cities, and I have knowledge of its medical and
educational facilities and the health profile. Throughout my academic and professional
life, most of my research projects have been centered on non-communicable diseases.
From my experience in the hospital setting in Nigeria, I have provided treatment to
many people with different medical problems, including chronic non-communicable
diseases.
My interest in paediatric health started with my Masters in Public Health project where I
carried out a systematic review about back-care education in children and adolescents.
My interest in paediatric or child health is based on the fundamental rationale of a need
for a preventive intervention to address health problems in early life – childhood, given
the poor outcomes of clinical treatment and public health prevention programmes in
adulthood because of the problems of correcting long standing lifestyle patterns or
embedded social characteristics.
I decided to focus on hypertension and blood pressure (the most common risk factor for
cardiovascular disease) because of my knowledge of the epidemiological transition
occurring worldwide and the obvious effect on cardiovascular disease in developing
countries. I felt it would be of value to apply the knowledge of this transition in the
paediatric population, as they are the future adults, and future of the nation. I had a
primary thought, “Is the epidemiological transition in the 21st century already having
measurable effects on the younger population – the future of the nation?” With all these
21
1.3 OVERVIEW OF THE THESIS STRUCTURE
This thesis is comprised of eight chapters. In Chapter Two (Background Chapter), I
describe my study area – Lagos State, Nigeria, in the first section. In the second section
I present detailed important background information for the present study. I highlight the
global status of disease patterns, putting Nigeria in perspective, describe the theoretical
basis of the shift in disease profile worldwide, with relevance to Nigeria, and elaborate
on chronic non-communicable diseases (NCDs) (including cardiovascular disease
(CVD)) and hypertension (a main risk factor for CVD) and their global challenges. I also
describe hypertension in children and adolescents, where I highlight the definition of
hypertension, the aetiology of hypertension, associated factors for variations in blood
pressure, and the tracking of blood pressure in children and adolescents.
In Chapter Three, I present a detailed review of published literature on the epidemiology
of hypertension in children and adolescents in Nigeria and other parts of the world, the
relationship between measures of socio-economic characteristics and blood pressure in
children and adolescents, the relationship between anthropometric measures of
adiposity or fatness and blood pressure in children and adolescents, as well as the
relationship between pubertal maturation status and blood pressure in children and
adolescents. I also highlight the justification for the study; which is followed by an
itemised statement of my research questions, aims and objectives, and the null
hypothesis of the study.
Chapter Four consists of the Methodological issues of the present study; where I
discuss the rationale for choosing the methodological approaches used. In Chapter
22
secondary school in Lagos State, Nigeria, as a precursor to the main study. This is
followed by the Methods Chapter (Chapter Six), where I describe aspects of the
research methods used in this main study, including: setting, study design, sample size
estimation, participant selection, data collection, data handling, data entry and cleaning,
and data analysis. In Chapter Seven, I present the main findings of the study, which
include both descriptive and inferential results.
Chapter Eight (the final chapter) of this thesis covers the discussion, recommendations
for policy, practice and future research, as well as the conclusion. In this chapter, I
summarise the main findings from each section of the thesis in relation to the original
research questions, discuss the relationship between the findings and the results of
previous research, highlight the strengths and limitations of the present study, discuss
the implications for policy, practice and future research, and end with a broad
conclusion.
SUMMARY
In this chapter, I have presented the introduction to this thesis and information
underpinning the basis of the present study. I also presented the description of the
origin of my interest in the research topic, and the structure of the thesis. In the next
chapter, I will describe my study area – Lagos State, Nigeria, and background
23
24
2.0 BACKGROUND
2.1 SETTING OF STUDY
INTRODUCTION
In this section, I will describe my study area, including the country (Nigeria) and the
precise study area – Lagos State.
2.1.1 COUNTRY PROFILE
Located in the west coast of Africa, Nigeria is bordered on the north by Niger, on the
northeast by Chad, on the east by Cameroon, on the west by Republic of Benin, and on
the south by the Atlantic Ocean (Demographic and Health Survey, 2008) (Figure 2). It is
the fourteenth largest country in Africa with a land area of 924,000 square kilometres.
Nigeria is grouped into six geopolitical zones – North-Central, North-East, North-West,
South-East, South-South, and South-West, and is comprised of 36 states and a Federal
Capital Territory (FCT) – Abuja (located in the centre of the country) (United States
Department of State, 2011; Demographic and Health Survey, 2008) (Figure 3). Lagos
State, the former capital of Nigeria from 1991, is located on the coast (Demographic
and Health Survey, 2008). Nigeria has a tropical climate with temperature range
between 25°C and 40°C, and two well defined seasons, rainy season (March to
October) and dry season (November to February) (Demographic and Health Survey,
2008). Table 1 (page 30) shows selected demographic, health and socio-economic
25
Figure 2: The Map of Nigeria showing its location in Africa and also showing the Federal capital territory – Abuja and Lagos State (the study area).
26
Figure 3: The Map of Nigeria showing the 36 States and the Federal capital territory – Abuja.
Source:Demographic and Health Survey (2008)
UNICEF (2011) estimates Nigeria’s population at approximately 155 million in 2009,
with an annual growth rate of about 2.7 percent. It is the most populous country in
Africa (thus, referred to as the “Giant of Africa”) (World Bank, 2011), and the seventh
most populated country worldwide; it also accounts for approximately seventeen
percent of the black population in the world and 47 percent of the population in West
Africa (World Bank, 2011). The nation’s population is largely young, with about 50% of
the population under the age of 18 (Nigeria National Population Commission, 2006)
(see Figure 4 for the population pyramid). The population is not uniformly spread across
Nigeria (Demographic and Health Survey, 2008). Lagos and Anambra are the most
densely populated states, while Yobe, Niger, and Taraba states are the most sparsely
27
Figure 4: Population Pyramid, Nigeria, Census 2006
Source: Nigeria National Population Commission (2006)
Figure 5: The Map of Nigeria showing the population density across the 36 States and the Federal capital territory – Abuja.
28
Nigeria has the highest number of large cities (that is, population of over one million) in
Africa (Agunwamba et al., 2009). It is partly urbanised, with half the population living in
urban areas, and a high average annual growth rate of urban population of 4 percent
(UNICEF: State of the World’s Children, 2011), which is greater than sub-Saharan
Africa’s urban population growth rate. Urbanisation is occurring rapidly in the country; in
the next two decades, the percentage of the population living in urban areas is
estimated to rise to about 64 percent (United Nations, 2007).
There are about 250 ethnic groups in Nigeria; but, the major ethnic groups are the
Hausa-Fulani in the North region, the Igbo in the South-East region, and the Yoruba in
the South-West region (United States Department of State, 2011). English is the official
language in Nigeria; however, there are 500 native languages, and the widely spoken
languages are Hausa-Fulani, Igbo and Yoruba languages (United States Department of
State, 2011). While there are a wide range of religious beliefs in Nigeria, the most
common ones are Islam and Christianity (United States Department of State, 2011).
Islam is predominant in the north, while Christianity is predominant in the south (United
States Department of State, 2011).
Nigeria is the largest oil producer in Africa, with the highest natural gas reserves (World
Bank, 2011). In spite of the large returns obtained from oil wealth and natural
resources, Nigeria is a low-income country, with a gross domestic product (GDP) per
capita of only about US$1,118 (UNICEF: State of the World’s Children, 2011). About
half of the population live below the poverty line (less than 1.25 dollars per day)
(UNICEF: State of the World’s Children, 2011). The gross domestic product growth rate
has doubled in the last decade in Nigeria (UNICEF: State of the World’s Children,
29
representing the second largest economy in the region (World Bank, 2011). The
southern region of the country is wealthier and more urbanised than the north. The
North-East and North-Central region (comprising about half of the nation’s population)
are the poorest in the country, with the majority of nation’s poor residing in these
regions (Demographic and Health Survey, 2008).
The total expenditure on health as a percentage of gross domestic product (GDP) in
Nigeria is 5.8 percent (World Bank, 2011). The general government expenditure on
health as percentage of total expenditure on health (2008) is about 37 percent while
private expenditure on health as percentage of total expenditure on health (2008) is
30
Table 1: Demographic, Health and Socio-economic indicators of Nigeria.
Indicator Year Estimate Source
Demographic
Total population 2009 154729000 UNICEF 2011
Life expectancy at birth (years), male 2009 53 UNICEF 2011 Life expectancy at birth (years), female 2009 54 UNICEF 2011
Population, under 18 2009 75994000 UNICEF 2011
Adolescents Population (aged 10-19) 2009 35386000 UNICEF 2011 Adolescents Population (aged 10-19), as a proportion of
total population (%)
2009 23 UNICEF 2011
Population annual growth rate (%) 2000-2009 2.7 UNICEF 2011 Crude birth rate (births per 1,000 population) 2009 40 UNICEF 2011 Crude death rate (deaths per 1,000 population) 2009 14 UNICEF 2011
% of population urbanised 2009 50 UNICEF 2011
Average annual growth rate of urban population (%) 2000-2009 4 UNICEF 2011 Health
Health System Performance ranking 2000 187 WHO, 2000 Physicians per 10,000 population 2009 4.0 WHO 2011b Nurses and midwives per 10,000 population 2009 16.1 WHO 2011b Total fertility rate (per woman) 2009 5.2 UNICEF 2011 Under-5 mortality rate (per 1,000 live births) 1990 212 UNICEF 2011 Under-5 mortality rate (per 1,000 live births) 2009 138 UNICEF 2011 Infant mortality rate (per 1,000 live births) 1990 126 UNICEF 2011 Infant mortality rate (per 1,000 live births) 2009 86 UNICEF 2011 Adult mortality rate (per 1,000 population) 2009 370 WHO 2011b Adult HIV prevalence rate (aged 15-49) (%) 2009 3.6 UNICEF 2011 Proportional mortality (% of total deaths, all ages)
Chronic non-communicable diseases (NCDs) Injuries
Communicable, maternal, perinatal, and nutritional conditions 2008 28 5 67 WHO 2011c
Chronic non-communicable diseases
Total NCD deaths (per 1,000 population) 2008 269.9 WHO 2011c Total NCD deaths (percentage of all deaths) 2008 28 WHO 2011c NCD deaths under age 60 (percentage of all NCD deaths) 2008 41.7 WHO 2011c All NCDs (age-standardised death rate per 100,000) 2008 805.4 WHO 2011c Cancers (age-standardised death rate per 100,000) 2008 94.1 WHO 2011c Chronic respiratory diseases (age-standardised death
rate per 100,000)
2008 95.3 WHO 2011c
Cardiovascular disease and diabetes (age-standardised death rate per 100,000)
2008 455.8 WHO 2011c
Hypertension (prevalence %) 2008 42.8 WHO 2011c
Mean systolic blood pressure (mmHg) 1990 130 WHO 2011c Mean systolic blood pressure (mmHg) 2008 132 WHO 2011c
Overweight (prevalence %) 2008 26.8 WHO 2011c
Obesity (prevalence %) 2008 6.5 WHO 2011c
Mean body mass index (Kg/m2) 1990 21 WHO 2011c
Mean body mass index (Kg/m2) 2008 24 WHO 2011c
Socio-economic
Gross National Income per capita (US$) 2009 1140 UNICEF 2011
GDP per capita (US$) 2009 1118 UNICEF 2011
GDP per capita average annual growth rate (%) 2009 5.6 UNICEF 2011 % share of household income, lowest 40% 2000-2009 15 UNICEF 2011 % share of household income, highest 20% 2000-2009 49 UNICEF 2011 Total adult literacy rate (%) 2005-2008 60 UNICEF 2011 Youth (15-24 years) literacy rate, female 2004-2008 65 UNICEF 2011
31
2.1.2 STUDY AREA - PROFILE OF LAGOS STATE
The study was carried out in Lagos Metropolis (also known as Lagos City), the urban
area of Lagos State. Lagos State is one of the 36 states that constitute the Federal
Republic of Nigeria (Nigeria National Population Commission, 2006). It is located in the
South-West region of the country. Lagos State is bounded in the North and East by
Ogun State, in the west by Republic of Benin and the south by the Atlantic Ocean (Oke
et al., 2000) (Figure 3). It comprises twenty Local Government Areas (Fabamwo and
Okonofua, 2010). Lagos State has the smallest land space (3577 square kilometres) in
the country (Figure 3) (Fadare and Oduwaye, 2009), although it is the most populous
state in Nigeria and also in sub-Saharan Africa, comprising a population of about 17.5
million. Lagos State has an annual growth rate of 3.2 percent and a population density
of 4,193 persons per square kilometre (Lagos State Government, 2011).
Lagos is the most urbanised state of the Federal Republic of Nigeria (Fadare and
Oduwaye, 2009). Lagos Metropolis, the urban area of Lagos state and Nigeria's largest
urban area, covers about 40% of the land area of Lagos State, and constitutes
approximately 90% of the total population of the state (Lagos State Government, 2011).
It has an average population density of more than 20,000 persons per square kilometre
(Lagos State Government, 2011; Fadare and Oduwaye, 2009). Lagos Metropolis, itself
is the most populated city in Africa and the 14th most populated city worldwide. Globally,
Metropolitan Lagos is one of the most rapidly growing cities, with a population rising ten
times more rapidly than New York or Los Angeles (Lagos State Government, 2011). By
2020, it is expected to be the 7th most populated city worldwide (City Mayor Statistics,
32
The native people of Lagos State are the Yorubas, but there is also a wide
socio-cultural mix of Nigerians from all over the country, people from other African countries
as well as from other continents (Oke et al., 2000). There are a variety of religious
groups in the state; however, the most common ones are Christians (71.8 percent) and
Muslims (27.9 percent) (Demographic and Health Survey, 2008).
Lagos State is the economic and financial centre of Nigeria and also of West Africa
(Fadare and Oduwaye, 2009). The state accounts for almost two-thirds of the nation’s
GDP (UN-HABITAT, 2006). As a result of the rapid urbanisation and population
expansion in Lagos State, the poverty level in Lagos Metropolis is substantial, with
[image:34.612.117.524.370.594.2]about 65 percent of the population living below the poverty line (UN-HABITAT, 2006).
Figure 6: The Map of Lagos State showing the local government areas.
33
2.1.2.1 THE EDUCATION SYSTEM
The schools (primary schools, secondary schools, universities and polytechnics) in
Lagos State are owned by the public sector – government (Federal or State
government) or private sector. There are about 1,000 public primary schools, 400 public
secondary schools, 1,200 privately owned nursery/primary schools and 110 privately
owned secondary schools, and 8 public universities and polytechnics in Lagos State
(Oke et al., 2000). Both publicly (Federal or State government) and privately owned
primary and secondary schools are almost evenly distributed all over the state. Lagos
State government owned primary and secondary schools are grouped under 20 local
education districts, grouped within five divisions (Oke et al., 2000). The Lagos State
government owned secondary schools included in the present study were from the
“Lagos State district IV”.
Lagos State has the three-tier: 9-3-4 education system (created in 2006), which
includes six years of primary education, three years of junior secondary education,
three years of senior secondary education, and four years of university or polytechnic
education (Uwaifo and Uddin, 2009). This system is used in all the states in Nigeria.
The 9-3-4 system of education was created to align with the Millennium Development
Goals (MDGs) and universal basic education goal (Uwaifo and Uddin, 2009). Following
the Universal Primary Education (UPE) enacted in all states in Nigeria in 1976, which
offered tuition-free primary education in State government owned public schools,
Nigeria currently has the Universal Basic Education (UBE) system, implemented in all
states in Nigeria in 1999 (Demographic and Health Survey, 2008). The Universal Basic
Education (UBE) system makes it compulsory for every child to have access to
34
government owned public schools (Demographic and Health Survey, 2008). Unlike the
tuition fee free State government owned public primary and secondary schools, all
Federal Government and privately owned schools are fee-paying schools.
Under the Universal Basic Education (UBE) system, distinct from the UPE, school
attendance is compulsory; the UBE places the responsibility on parents and carers to
register their children in school and ensure the completion of the primary and secondary
education(Kazeem et al., 2010). The Universal Basic Education (UBE) system also has
assigned legislated penalties for parents and carers who fail to perform this obligation
(Kazeem et al., 2010).
The percentage of the Nigerian population that has received any education differs
according to geopolitical regions (Demographic and Health Survey, 2008). The
North-East and North-West regions have the highest percentage population with no
education, the South-South region has the lowest percentage population with no
education, and the South-West region has the highest percentage population with more
than secondary education (Demographic and Health Survey, 2008). The 2008
Demographic and Health Survey (DHS) indicate that only 4 percent of the total
population in Lagos State have no education, compared with 19 percent of the total
population in Nigeria. In Lagos State, 2 percent have only some primary education, 10
percent completed only primary education, 16 percent have some secondary education,
43 percent have completed secondary education, and a further 25 percent have higher
than secondary education (Demographic and Health Survey, 2008). The percentage of
persons who have completed secondary education and the percentage of those with
more than secondary school level of education in Lagos State are more than twice the
35
Lagos State has the highest literacy rate in Nigeria (Nigeria National Population
Commission, 2006). Data from the Nigeria National Population Commission (2006)
indicated that 88 percent of the total population in Lagos State are literate, compared to
the nation’s 67 percent. Ninety four percent of the population aged 10 to 19 years in
Lagos State are literate, while Nigeria overall has 75 percent literacy rate (Nigeria
National Population Commission, 2006).
School attendance rate is relatively high in Lagos, compared to the national average.
According to the Nigeria National Population Commission (2006), 94 percent of the
population aged 10 to 14 years and 74 percent of the population aged 15 to 19 years
are attending school in Lagos State. At national level, 74 percent of children aged 10 to
14 years and 68 percent of children and adolescents aged 15 to 19 years are attending
school (Nigeria National Population Commission, 2006). Four percent of children and
adolescents aged 10-19 years in Lagos State have never attended school, compared
with the national average of about 22 percent (Nigeria National Population Commission,
2006).
SUMMARY
In this section, I have given an overview of my study area, including the geographic
location, demographic, health, education, and socio-economic characteristics of the
entire nation (Nigeria), as well as Lagos State, so as to provide knowledge of the study
population features.
In the next section, I will provide the information which form the fundamental foundation
36
worldwide and discuss the global status on disease pattern with relevance to Nigeria. I
will then have a detailed look at non-communicable diseases (NCDs) (including
cardiovascular disease (CVD) and hypertension (a main risk factor for CVD) and their
global challenges, and subsequently locate my main focus in the context of blood
37
2.2 STUDY BACKGROUND
INTRODUCTION
In this section, I will present the theory and epidemiological trends underpinning the
basis of the present study. I will describe the theory of epidemiological transition and
accompanying transitions. I will discuss the global status on disease pattern, placing
Nigeria in perspective. I will then elaborate on chronic non-communicable diseases
(NCDs) (including cardiovascular disease (CVD)) and hypertension (a main risk factor
for CVD) and their global challenges. I will later explain the main focus of my study in
the context of blood pressure in children and adolescents, under the following headings
– definition of hypertension, the aetiology of hypertension, associated factors for
variations in blood pressure, and the tracking of blood pressure in children and
adolescents
2.2.1 THE THEORY OF EPIDEMIOLOGICAL TRANSITION AND
ACCOMPANYING TRANSITIONS
The epidemiological transition refers to a distinct shift in the disease and mortality
profile of a population (Omran, 1971). Omran first proposed the theory of
epidemiological transition in 1971. The theory of epidemiological transition describes
four sequential stages of changing patterns of disease and mortality in human society
(Pearson, 1999). Omran (1971) proposed three stages of epidemiological transition in
the process of modernisation: “the stage of pestilence and famine”, “the stage of
receding pandemics” and “the stage of degenerative and man-made diseases”. A fourth
stage was introduced by Olshansky and Ault (1986), as “the stage of delayed
38
Countries in the world and states within a country at any point in time can be at different
phases of epidemiological transition (Yusuf et al., 2001). According to Hill et al (2007),
in the developing world, the majority of Africa (including Nigeria) and South Asian
countries are in the initial stages of the epidemiological transition, while much of Latin
America and East and Southeast Asian countries are in the later stages. In addition,
populations from a homogenous origin at any point in time have been noted to be at
different stages of epidemiological transition (Gillum, 1996). Six stages of the
epidemiological transition of CVD among black people of sub-Saharan African origin
(such as black populations in the West Indies and black Americans) have been
39
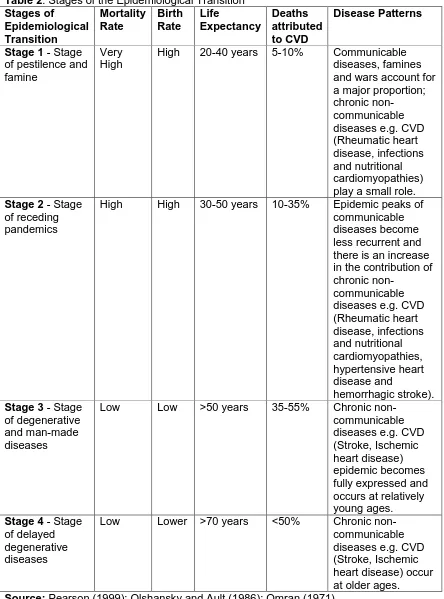
Table 2:Stages of the Epidemiological Transition
Stages of Epidemiological Transition Mortality Rate Birth Rate Life Expectancy Deaths attributed to CVD Disease Patterns
Stage 1 - Stage of pestilence and famine
Very High
High 20-40 years 5-10% Communicable diseases, famines and wars account for a major proportion; chronic
non-communicable diseases e.g. CVD (Rheumatic heart disease, infections and nutritional cardiomyopathies) play a small role.
Stage 2 - Stage of receding pandemics
High High 30-50 years 10-35% Epidemic peaks of communicable diseases become less recurrent and there is an increase in the contribution of chronic
non-communicable diseases e.g. CVD (Rheumatic heart disease, infections and nutritional cardiomyopathies, hypertensive heart disease and hemorrhagic stroke).
Stage 3 - Stage of degenerative and man-made diseases
Low Low >50 years 35-55% Chronic non-communicable diseases e.g. CVD (Stroke, Ischemic heart disease) epidemic becomes fully expressed and occurs at relatively young ages.
Stage 4 - Stage of delayed degenerative diseases
Low Lower >70 years <50% Chronic non-communicable diseases e.g. CVD (Stroke, Ischemic heart disease) occur at older ages.
40
The shifts in disease and mortality patterns which characterise the epidemiological
transition are closely related to two processes – the demographic transition and the
nutrition transition (Popkin and Gordon-Larsen, 2004). The demographic transition
describes a change in population dynamics (Amuna and Zotor, 2008). The theory of the
demographic transition proposes a relationship between mortality and birth rate. The
demographic transition is characterised by a gradual shift from a pattern of high
mortality and birth rate, short life expectancy and low population growth to low mortality
and birth rate, longer life expectancy and increased population growth (Lee, 2003) (see
Table 1, page 30). Nigeria currently has an average life expectancy at birth of 54 years,
a high birth rate of 5.2 births per woman and high infant and under 5 mortality rates of
86 and 138 per 1000 live births respectively, (UNICEF: State of the World’s Children,
2011), with an adult mortality rate (probability of dying between 15 and 60 years) of 370
per 1,000 population (World Health Organisation, 2011b).
Population growth and ageing will augment a significant rise in the numbers of deaths
from chronic non-communicable diseases, especially in developing countries. An
eighteen percent rise in population growth has been projected for developing countries
between 2005 and 2015 (Abegunde et al., 2007). Smith and Mensah (2003) highlighted
that in the next three decades between 2000 and 2030, the population of elderly
persons aged 65 years and older is projected to increase by two-fold in many
Sub-Saharan African countries.
The nutrition transition refers to a shift in the patterns of diet and physical activity
towards unhealthy foods higher in fat, sugar and energy, and low in fruit and vegetable
41
2.2.2 GLOBAL STATUS ON DISEASE PATTERN
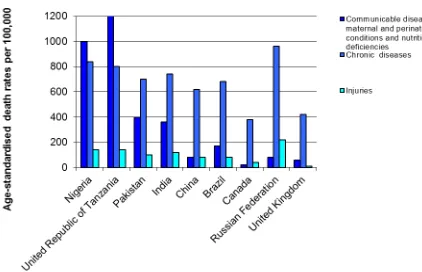
Over the next two decades, the relative contribution of the major cause of death and
total burden of disease in many developing countries (including Nigeria) is projected to
alter significantly (Mathers and Loncar, 2006). A major decline in communicable
diseases (except HIV/AIDS) and poverty-related diseases, and a substantial increase in
the incidence of chronic non-communicable diseases (such as cardiovascular disease
(a hypertensive-related disease), cancers, chronic respiratory diseases and diabetes) is
expected worldwide (including in Nigeria) over the next few years (World Health
Organisation, 2005) (Figures 7 and 8).
The World Health Organisation (2005) has predicted that although communicable
diseases and poverty-related diseases will continue to be the leading causes of death in
Nigeria over the next few years, deaths from chronic non-communicable diseases
(including cardiovascular disease (CVD), cancers, chronic respiratory diseases and
diabetes) will rapidly catch up (Figures 7 and 8). By 2030, chronic non-communicable
diseases are predicted to surpass communicable diseases and poverty-related
diseases in Africa (World Health Organisation, 2011a). Some developing countries such
as India and Pakistan are already experiencing a predominance of chronic
42
Figure 7: Projected Main Causes of Death in selected countries, all ages, 2005
[image:44.612.118.540.71.343.2]Source: World Health Organisation (2005)
43
While communicable diseases and poverty-related diseases (such as HIV/AIDS,
tuberculosis, malaria, maternal and perinatal conditions, and nutritional deficiencies)
remain a threat in many developing countries, including Nigeria, the increasing
prevalence of chronic non-communicable diseases (such as cardiovascular disease (a
hypertensive-related disease)) has led to a “double burden of disease” (Yusuf et al.,
2001). This double burden of disease has a grave public health impact as it places
serious challenges on the health system (Yach et al., 2004), since the health system is
still coping with the challenges of tackling communicable and poverty-related diseases
with limited financial and human resources. BeLue et al (2009) highlighted that the
management of chronic non-communicable diseases (such as cardiovascular disease)
would be available for only a small number of people, resulting in high disease burden
and mortality.
Nigeria alongside other developing countries is currently undergoing a process in
modernisation known as “an epidemiological transition”, characterised by a progressive
rise in the burden of chronic non-communicable diseases including cardiovascular
disease and a decrease in the communicable diseases and poverty-related diseases
(BeLue et al., 2009), associated with socio-economic development, urbanisation,
industrialisation, globalisation and changing lifestyle factors (Kadiri, 2005). Many
developed countries (especially European countries) passed through this transition in
the first half of the 1900s (Hill et al., 2007). However, the epidemiological transition
presently being experienced in developing countries is occurring in a shorter time frame
44
2.2.3 CHRONIC NON-COMMUNICABLE DISEASES
Globally, chronic non-communicable diseases (NCDs) (mainly, cardiovascular disease,
cancers, chronic respiratory diseases and diabetes) are currently the leading cause of
death in the adult population. In 2008, about sixty percent of deaths (36 million)
worldwide were due to NCDs; and this is predicted to increase by about 15% by 2020
(World Health Organisation, 2011a). NCDs (such as cardiovascular disease, cancers,
respiratory diseases, diabetes and injuries) were estimated to account for 28 percent of
all deaths in Nigeria in 2008 (World Health Organisation, 2011c). Because of the larger
populations involved, the preponderant effects of chronic non-communicable diseases
are falling increasingly on developing nations, with 80 percent of NCD deaths occurring
in these countries and the highest percentage of these deaths occurring prematurely
during working age (that is in people under 70 years of age) (World Health
Organisation, 2011a).
In addition to the health impact associated with chronic non-communicable diseases,
there is also a socio-economic and human development adverse impact, hindering
progress (World Health Organisation, 2011a). Every 10% increase in NCDs is linked to
a 0.5% decrease in the yearly rate of economic growth (World Health Organisation,
2011a). According to World Health Organisation (2005), the economic losses due to
chronic non-communicable diseases (mainly cardiovascular disease and diabetes) in
Nigeria, United Kingdom, India and China were 400 million dollars, 2 billion dollars, 9
billion dollars and 18 billion dollars, respectively, in 2005. By 2015, the accumulated
amount of loss in national income as a result of deaths caused by chronic
non-communicable diseases (mainly cardiovascular disease and diabetes) in Nigeria,
45
dollars, 247 billion dollars, and 558 billion dollars, respectively (World Health
Organisation, 2005).
Chronic non-communicable diseases (NCDs) were omitted in the United Nations (UN)
Millennium Development Goals (MDGs) established in 2000. These goals were
established to reduce poverty and improve human well-being (World Health
Organisation, 2011a). Today, NCDs encompass a significant burden of disease and
mortality worldwide; thus, it is inappropriate that they are not a part of the MDGs. There
is an increasing global interest and action on chronic non-communicable diseases. In
September 2010, the Millennium Development Goals Review Summit took place in New
York, which highlighted NCDs as important issue for addition to the MDG successor
goals in 2015 (United Nations, 2010). At the UN High-Level Meeting on prevention and
control of chronic non-communicable diseases which took place in New York in
September 2011, the significant rise of NCDs in developing countries was
acknowledged, and it was agreed that chronic non-communicable diseases should be
high on the global health agenda (United Nations, 2011). The strategies to respond to
the issues of NCDs through a reduction in risk factors, strengthening of health systems,
and improvement in surveillance and evaluation were also outlined at the meeting.
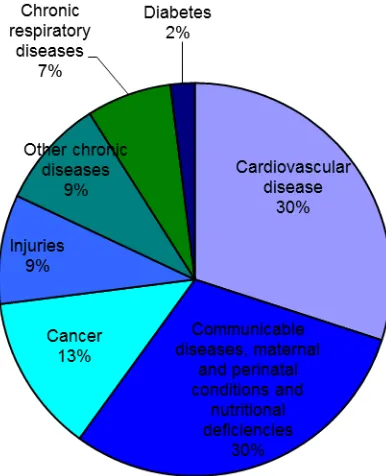
2.2.4 CARDIOVASCULAR DISEASE
Cardiovascular disease (CVD) is a leading cause of death and burden of disease from
chronic non-communicable diseases in adults worldwide (World Health Organisation,
2005) (Figures 9 and 10). An estimated 17 million people die annually from
cardiovascular disease conditions (such as stroke and coronary heart disease), with
46
stroke (World Health Organisation, 2010). As stated previously, the poorer countries
carry the heaviest burden from cardiovascular disease deaths, with 80 percent of the
deaths occurring in these countries (World Health Organisation, 2005). In 2008, about
half of NCD deaths worldwide were caused by cardiovascular disease (World Health
Organisation, 2011a). In the same year, CVD contributed to 10 percent of overall
all-cause mortality, and was responsible for almost half of the NCD deaths in Nigeria
(World Health Organisation, 2011c).
Although the current high mortality and burden of CVD is in itself a sufficient rationale
for attention, a bigger issue is the more premature mortality from CVD in developing
countries compared with the developed countries (World Health Organisation, 2012;
Abegunde et al., 2007), with almost half of these CVD deaths occurring prematurely
(under 70 years) (Abegunde et al., 2007). This will have adverse effects on productivity
and economic development, weakening the economies of countries (World Health
Organisation, 2011a). Cardiovascular disease is expected to remain the single leading
causes of death worldwide, with an estimated 23.6 million deaths by 2030, mainly
because it will increase in developing countries (Mathers and Loncar, 2006).
Socio-economic differences exist in the distribution of cardiovascular disease within
countries, worldwide. In developed countries, CVD has a greater impact on the poor
(World Health Organisation, 2005); whilst in developing countries (such as Nigeria),
CVD is commoner in those with a more “western” lifestyle. This lifestyle accompanies
urbanisation, and may be more prevalent with rising socio-economic status (Ejike et al.,
2008). As CVD epidemic progresses in developing countries, the disease prevalence
will alter to the poorer population groups (World Health Organisation, 2011a). The
47
beginning of CVD epidemic in developed countries in the early 1900s, and it is classic
for a population in epidemiological transition (Karaye et al., 2009). Despite the fact that
CVD affects mainly adults, its causes may begin in early childhood (Hulanicka et al.,
2007).
The rise in CVD is mostly due to a rise in key risk factors, mainly hypertension or high
blood pressure (BP) (Ejike et al., 2008; Moura et al., 2004). An increase in hypertension
[image:49.612.202.395.294.532.2]or high blood pressure heralds an increase in CVD (Ejike et al., 2008).
Figure 9: Projected Main Causes of Death, worldwide, all ages, 2005