Original citation:
Atia, Jolene, McCloskey, Conor, Shmygol, Anatoly, Rand, D. A. (David A.), Van Den Berg, Hugo and Blanks, Andrew M.. (2016) Reconstruction of cell surface densities of ion pumps, exchangers, and channels from mRNA expression, conductance kinetics, whole-cell calcium, and current-clamp voltage recordings, with an application to human uterine smooth muscle cells. PLoS Computational Biology, 12 (4). e1004828.
Permanent WRAP URL:
http://wrap.warwick.ac.uk/78768
Copyright and reuse:
The Warwick Research Archive Portal (WRAP) makes this work of researchers of the University of Warwick available open access under the following conditions.
This article is made available under the Creative Commons Attribution 4.0 International license (CC BY 4.0) and may be reused according to the conditions of the license. For more details see: http://creativecommons.org/licenses/by/4.0/
A note on versions:
The version presented in WRAP is the published version, or, version of record, and may be cited as it appears here.
RESEARCH ARTICLE
Reconstruction of Cell Surface Densities of
Ion Pumps, Exchangers, and Channels from
mRNA Expression, Conductance Kinetics,
Whole-Cell Calcium, and Current-Clamp
Voltage Recordings, with an Application to
Human Uterine Smooth Muscle Cells
Jolene Atia1, Conor McCloskey1, Anatoly S. Shmygol1, David A. Rand2, Hugo A. van den Berg2, Andrew M. Blanks1*
1Division of Reproductive Health, Warwick Medical School, University of Warwick, Coventry, United Kingdom,2University of Warwick, Coventry, United Kingdom
Abstract
Uterine smooth muscle cells remain quiescent throughout most of gestation, only generat-ing spontaneous action potentials immediately prior to, and durgenerat-ing, labor. This study pres-ents a method that combines transcriptomics with biophysical recordings to characterise the conductance repertoire of these cells, the‘conductance repertoire’being the total com-plement of ion channels and transporters expressed by an electrically active cell. Transcrip-tomic analysis provides a set of potential electrogenic entities, of which the conductance repertoire is a subset. Each entity within the conductance repertoire was modeled indepen-dently and its gating parameter values were fixed using the available biophysical data. The only remaining free parameters were the surface densities for each entity. We characterise the space of combinations of surface densities (density vectors) consistent with experimen-tally observed membrane potential and calcium waveforms. This yields insights on the func-tional redundancy of the system as well as its behavioral versatility. Our approach couples high-throughput transcriptomic data with physiological behaviors in health and disease, and provides a formal method to link genotype to phenotype in excitable systems. We accu-rately predict current densities and chart functional redundancy. For example, we find that to evoke the observed voltage waveform, the BK channel is functionally redundant whereas hERG is essential. Furthermore, our analysis suggests that activation of calcium-activated chloride conductances by intracellular calcium release is the key factor underlying sponta-neous depolarisations.
a11111
OPEN ACCESS
Citation:Atia J, McCloskey C, Shmygol AS, Rand DA, van den Berg HA, Blanks AM (2016) Reconstruction of Cell Surface Densities of Ion Pumps, Exchangers, and Channels from mRNA Expression, Conductance Kinetics, Whole-Cell Calcium, and Current-Clamp Voltage Recordings, with an Application to Human Uterine Smooth Muscle Cells. PLoS Comput Biol 12(4): e1004828. doi:10.1371/journal.pcbi.1004828
Editor:Daniel A Beard, University of Michigan, UNITED STATES
Received:May 19, 2015
Accepted:February 23, 2016
Published:April 22, 2016
Copyright:© 2016 Atia et al. This is an open access article distributed under the terms of theCreative Commons Attribution License, which permits unrestricted use, distribution, and reproduction in any medium, provided the original author and source are credited.
Data Availability Statement:All relevant data are within the paper and its Supporting Information files.
Author Summary
A well-known problem in electrophysiologal modeling is that the parameters of the gating kinetics of the ion channels cannot be uniquely determined from observed behavior at the cellular level. One solution is to employ simplified“macroscopic”currents that mimic the behavior of aggregates of distinct entities at the protein level. The gating parameters of each channel or pump can be determined by studying it in isolation, leaving the general problem of finding the densities at which the channels occur in the plasma membrane. We propose an approach, which we apply to uterine smooth muscle cells, whereby we con-strain the list of possible entities by means of transcriptomics and chart the indeterminacy of the problem in terms of the kernel of the corresponding linear transformation. A graph-ical representation of this kernel visualises the functional redundancy of the system. We show that the role of certain conductances can be fulfilled, or compensated for, by suitable combinations of other conductances; this is not always the case, and such“ non-substitut-able”conductances can be regarded as functionally non-redundant. Electrogenic entities belonging to the latter category are suitable putative clinical targets.
Introduction
The human genome contains a large number of distinct ion channels, each of which may be assembled into multimeric complexes that modulate the electrical activity of the cell in a subtly different way [1]. Determination of the total ion channel repertoire of a given cell (its‘ conduc-tance repertoire’) is cumbersome via conventional biophysical techniques. The latter rely on the specificity and availability of suitable pharmalogical agents or protocols, which may or may not be able to differentiate between combinations of conductances that can give rise to similar behaviors at the electrophysiological level. By contrast, transcriptomic analysis accurately sur-veys the complete complement of mRNA coding for all potential conductances. However, such data sets are semi-quantitative at best, absent a straightforward relationship between mRNA levels and surface expression/functionality of the electrogenic proteins.
The classic approach in electrophysiology has been to fit a suitable mathematical model to the data, where the parameters to be estimated represent not only the densities of the electro-genic entities but also their biophysical properties [2–4]. This approach is hampered by the large number of distinct electrogenic species. One option is to combine the contributions from several electrogenic species (which are often oligomeric complexes) into single entities, result-ing in a‘macroscopic current’model [4–10]. Such models may not be sufficiently detailed for pharmacological purposes and accurate assessment of currents within native cells can be tech-nically challenging.
The gold standard, therefore, is to determine the conductance repertoire at the level of indi-vidual molecular species. The present paper integrates transcriptomics with the information encoded by the action potential (AP) waveform. Electrophysiological data do not necessarily fix a unique solution; there are infinitely many alternative conductance repertoires, that are all equally compatible with the available electrophysiological data. We should consider all conduc-tance repertoires that are consistent with the data, and focus on the properties that they share as a class. This motivates a formal characterisation of the functional redundancy of the system.
Our approach is based on two key ideas. First, we use two kinds of data to constrain the space of possibilities, namely mRNA sequencing to determine which species the cell is capable of expressing, combined with parameter estimation to determine the conductance repertoire from electrophysiological data. Second, we obtain the parameters associated with the gating Competing Interests:The authors have declared
kinetics from the analysis of published data, which means that theonlyremaining free parame-ters are the surface densities of the species on the list compiled from transcriptomics.
We focus on a cell type of considerable clinical interest, namely the myometrial smooth muscle cell (MSMC), which is the principal unit of electrical activity in the uterus, normally quiescent except in labor, when spontaneous action potentials are generated by the MSMC [11]. A detailed, comprehensive characterisation of these cells would aid the development of therapeutics to manage both preterm birth and perinatal complications associated with uterine contractility, such as postpartum haemorrhage [12]. From a pharmacological point of view, the most promising targets are electrogenic entities whose contribution to the overall electrophysi-ological behavior is essential in the sense that the role of such an entity cannot be fulfilled by some combination of other ion channels. We show that our analysis is capable of identifying such entities and verify these predictions by means of additional experiments.
Results
We formulated a mathematical model based on individual currents carried by the electrogenic transmembrane proteins in the human MSMC. There are four steps: (i) characterise the poten-tial repertoire of electrogenic proteins by means of expression studies; (ii) model each ion chan-nel or transporterindependentlyand determine its gating parameter values on the basis of data taken from the literature; (iii) characterise the space of possible solutions of conductance reper-toires consistent with the experimentally observed calcium and membrane potential wave-forms; (iv) select a putative conductance repertoire from this set and use this in subsequent
‘free-running’simulations in order to explore various hypotheses.
We determined the repertoire of the electrogenic proteins that are potentially expressed in MSMC, as indicated by mRNA expression data [13]. These proteins are often subunits that contribute to functional channels in various combinations. The expression list therefore gener-ates a potential repertoire of conducting entities that may be present in the plasma membrane of the MSMC; a list of all potential entities considered in the model is given inTable 1. This list is depicted diagrammatically inFig 1A.
For every channel complex consistent with the subunits in the mRNA expression list and attested in the literature, a sub-model was compiled by taking a mathematical description of gating kinetics from the literature whenever available; otherwise novel equations were formu-lated using available data, and biophysical and kinetic parameter values were determined via least-squares fitting to experimental data on heterologous expression systems (seeMaterials and Methodsand Supporting Information for more details).
The current summation model accomodates the contributions made by each of the conduc-tances:
C d
dtVðtÞ ¼IðtÞ þ
Xn
i¼1
ϰiciðtÞ ð1Þ
whereCis the membrane capacitance,V(t) is the transmembrane voltage difference at timet, I(t) is the injected current,ψi(t) is the current carried per ion channel or transporter complex,
andϰiis the corresponding surface density of this entity. The densities can be estimated in
terms ofκi=ϰi/C, which expresses the number of pores of speciesiper unit of capacitance
(clearlyκi0 for alli).
The parameters of the gating kinetics of each species having been determined indepen-dently, the only remaining unknowns are the cell-surface densities (Fig 1A). Native cell behav-ior combining two simultaneously acquired data sets (voltageVand intracellular calcium [Ca2+]ias a function of time; seeMaterials and Methodsfor detailed experimental procedures)
was used to constrain the parameters. Briefly, the observed voltage and Ca2+time series (Fig 2), detailed inS1 Data, were used to drive the gating kinetics of each entity (‘data-driven’ simula-tions, as opposed to free-running simulations that were done subsequently). The gating time series thus obtained were used to calculate the individual current densities. The observed mem-brane potential time series is linear in the channel densities, which implies that the kernel of a
Table 1. Potential conductance species included in the model.
Name given Gene combination State variables References
Kv2.1 KCNB1 C½Kv2:1
0 –C½4Kv2:1 [14]
O[Kv2.1]
I½Kv2:1
0 –I½5Kv2:1
Kv9.3 KCNB1+KCNS3 g1,g2fast,g2slow [15]
Kv6.1 KCNB1+KCNG1 l1,l2 [15,16]
BK KCNMA1 PoBKα [17]
BKβ1 KCNMA1+KCNMB1 PoBKα+β1 [17]
BKβ3 KCNMA1+KCNMB3 C½aþb3
0 –C½
aþb3
4 [18]
O½0aþb3–O½
aþb3
4
I½0aþb3–I½
aþb3
4
BKβ4 KCNMA1+KCNMB3 PBKaþb
4 [19,20]
SK2 KCNN1 PSK2 [21,22]
SK3 KCNN3 PSK3 [23]
SK4 KCNN4 PSK4 [24]
hERG KCNH2 C½hERG
0 –C½2hERG [25]
O½1hERG–I½0hERG
CaL (L-type) CACNA1C d,f [3]
CaT (T-type) CACNA1G a,c [26]
CaCC ANNO1 cc [27]
Kv3.4 KCNC4 a1,a2 [28]
Kv4.1 KCND1 b1,b2fast,b2inter,b2slow [29,30]
Kv4.3 KCND3 C½Kv4:3
0 –C½4Kv4:3 [31]
O[Kv4.3]
I½Kv4:3
0 –I½6Kv4:3
Kv4.3+KCNE3 KCND3+KCNE3
Kv4.3+KChIP2b KCND3+KChIP2b k1,k2fast,k2slow [32]
Kv4.3+KChIP2d KCND3+KChIP2d k1,k2fast,k2slow [32]
Kv4.3+KChIP2b+KCNE3
Kv7.1 KCNQ1 C½Kv7:1
1 ,C½2Kv7:1 [33]
O½1Kv7:1,O½2Kv7:1
I[Kv7.1]
Kv7.4 KCNQ4 d1,d2 [34]
Kir7.1 KCNJ13 PKir7.1 [35]
bgK, bgCl
Gap1, Gap2 PGJI,PGJII [36]
NCX, PMCA, NaK [3,37]
P2X4 P2X4R Pact,Pdes [38]
Various potential conductance species considered in the model based on mRNA expression data.
linear transformation characterises the space of all possible combinations of ion channel densi-ties that is consistent with the data. This kernel represents the functional redundancy of the system, as it is essentially the space of all conductance repertoires that are compatible with the data. In particular, unless the transformation is of full rank, no unique conductance repertoire can be inferred from the data and the parameter vectorκis formally unidentifiable. This is the typical situation encountered in practice.
To overcome this problem, an additional criterion is required to select one particular vector in this space. Different criteria lead to different choices. We chose to calculate the vector with smallestℓ1-norm, subject to non-negativity. This is parsimonious in the sense that it represents
the most economical way for the cell to exhibit the observed physiological behavior, although we do not necessarily believe that this is the dominant operative evolutionary criterion.
Fig 1. Model diagram.(A) Diagrammatic representation of all potential entities considered in the model repertoire according to mRNA expression data [13]. (B) Diagrammatic representation of the potential entities based on the most parsimonious solution (ℓ1-norm; see text for further details). SR: sarcoplasmic
reticulum; CaCC: calcium-activated chloride channel; CaT: T-type calcium channel; CaL: L-type calcium channel; hERG: humanether-à-go-go-related gene potassium channel; Kvx.x: potassium channel; SK-x:“small unitary current”potassium channels; BK-x:“big unitary current”potassium channels; NCX: sodium-calcium exchanger; PMCA: plasma-membrane calcium exchanger; pNaK: sodium-potassium exchanger; bgK: background potassium current; bgCl: background chloride current.
doi:10.1371/journal.pcbi.1004828.g001
An estimate of the channel densities up to the indeterminacy of the kernel is obtained. The scaled surface density vectorκis given as the sum of a particular solutionκpplus an arbitrary linear combination of the kernel’s basis vectors. Forκpwe can take the pseudo-inverseκ+, which has the property that the discrepancy between the observedV(t) and the model predic-tion is minimised in the least-squares sense (κ+has the smallest Euclidian norm out of all vec-tors that achieve this best fit). However, the affine space formed ofκ+plus the basis vectors is not guaranteed to intersect with the non-negative cone. Only this intersection is relevant because channel densities cannot be negative. Constrained non-linear least-squares fitting was used to find a vector in the non-negative cone that was minimal in theℓ1-norm. This vector is
listed inTable 2andFig 1B. Figure D2 in McCloskey et al [39] shows the observed voltage trace together with the free-running simulation usingκ+and the free-running simulation using the non-negativity-constrained, minimal-ℓ1vector.
Validation of the estimated conductance repertoire
Physiological predictions were made, using the simulation model in its free-running mode, on the basis of the conductance repertoire as per the minimalℓ1-norm criterion. The predictions
were validated against experimental data obtained from voltage-clamp experiments for cur-rents isolated by antagonist application. Sets of curcur-rents were measured for control and antago-nist-inhibited current, and specific current was obtained by subtracting the current recorded in the presence of antagonist from the total current; measurements were reported as mean current at 450 ms ± SEM. The simulations were entirely independent of these additional data.
To inhibit and thereby isolate the Kv2.1 currents, we applied stromatoxin (ScTx), an inhibi-tor of Kv2.1 homomeric channels, Kv2.1/Kv6.1, Kv2.1/Kv9.3, as well as the A-type channel Kv4.2. The late outward current was measured to separate Kv2.1 from A-type currents. The measured ScTx-sensitive late outward current (att= 450 ms), resulting from voltage-clamp experiment at 40 mV after application of 100 nM ScTx, was 3.71±0.41 pA/pF (n= 19). The total peak Kv2.1 current elicited by the simulation for the same voltage step (40 mV) was 3.77 pA/pF (the channels Kv2.1, Kv6.1, and Kv9.3 contribute to this current).
Dofetilide is a selective inhibitor of hERG channels. The isolated dofetilide-sensitive current at 450 ms observed in voltage-clamp experiments at 40 mV after the application of 1μM
Fig 2. Calcium dynamics.(A) Calcium fluorescence signal (dots) together with the least-squares fit of the calcium excitation model (solid line); parameter estimates are given inTable 4. (B) Reconstructed calcium concentration time course obtained using the model with these estimates.
dofetilide was 1.24±0.61 pA/pF (n= 7), as compared to 1.544 pA/pF for the simulated current elicited by hERG at the same voltage.
Fig 3shows the experimental current densities under the voltage-clamp conditions. The simulated values of peak currents at selected voltage steps agree, to within the margins of experimental error, with the currents measured for Kv2.1 channels and hERG channel.
Representation of the functional redundancy of the MSMC
The functional redundancy is encoded by the kernel of a linear transformation. An informative graphical representation of this functional redundancy can be obtained by transforming the basis of the kernel to a suitable echelon form, which is then visualised as a heat map. These redundancy maps, shown in Figs4and5, are to be read one row at a time. A unit change in the density of the channel appearing in the leading (left-most) position of each row can be func-tionally compensated, by upward or downward shifts represented by the trailing elements (i.e., those to the right). The redundancy map thus represents a compensation signature, charting
Table 2. Parameter estimation.
Potential conductance species number of channels/pF
Kv2.1 15.7
Kv9.3 6
Kv6.1 0.74
BK 0.064
BKβ1 0.3
BKβ3 0.037
BKβ4 0
SK2 0
SK3 0.78
SK4 0.015
hERG 2.4
CaL (L-type) 10.5
CaT (T-type) 19.8
CaCC 0.45
Kv4.1 0
Kv4.3 0
Kv4.3+KCNE3 1.3
Kv4.3+KChIP2b 2.7
Kv4.3+KChIP2d 0.3
Kv4.3+KChIP2b+KCNE3 0
Kv3.4 5.2
Kv7.1 0
Kv7.4 0.84
Kir7.1 0
bgK, bgCl 0.5, 0.46
Gap1 0
Gap2 0
Potential conductance species channel density factor
NCX 0.03
PMCA 3.9
NaK 1.1
doi:10.1371/journal.pcbi.1004828.t002
the cell’s ability of exhibiting the same electrophysiological behavior despite altered channel densities. This compensation is computed on the basis of the voltage waveform that was used to derive the basis vectors, but it is not unreasonable to expect that the compensatory adjust-ments prescribed by the redundancy map are applicable for a wider range of behaviors. An additional caveat is that these adjustments are exact only for infinitesimal changes in the lead-ing channel density; for finite perturbations in the leadlead-ing variable, the correspondlead-ing shifts dictated by the trailing elements are only a first-order approximation. This means that there is
Fig 3. Validation of the model.(A) Bar chart comparing experimental and simulated Kv2.1, hERG, and Kir7.1 current densities (means±SEM). (B, C, D) ScTx-, dofetilide-, and VU590-sensitive currents in day-15 (D15) mice samples, the asterisk indicating at which point in time the current was sampled for the data reported in A; experimental traces under voltage-clamp conditions with 40 mV voltage step for ScTx- and dofetilide-sensitive currents and−150 mV for VU590-sensitive current from holding potential of−60 mV (ScTx:n= 19; dofetilide:n= 7; VU590:n= 9). A detailed comparison of measured and simulated currents is reported inS1 Fig. Voltage time series data are provided inS2 Data.
a finite operating range within which the approximation can be expected to be reasonably accu-rate. Moreover, the operating range is further constrained by considerations of physiologic fea-sibility: channel densities cannot be negative and, similarly, there will be a upper bound to the current density that can be physically sustained by the cell membrane (there will also be a phys-iological upper bound to the quantities of channel proteins that can be synthesised and inserted into the membrane). To estimate such upper bounds we used the procedure detailed in Materi-als and Methods,“Physiological upper bounds on channel density values.”
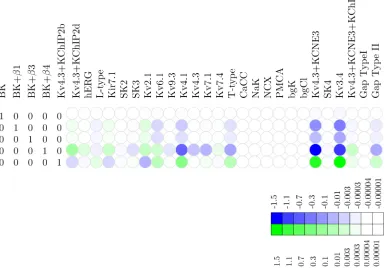
BK. To investigate the functional redundancy of the BK channel and its isoforms, we took these channels as leading variables in the echelon form, resulting in the redundancy map shown inFig 4. This map indicates that minute adjustments suffice, i.e., the effect of BK can be compensated by extremely small variations in the densities of other channels.Fig 6depicts the effect of increasing the BK channel density by a single-channel per pF on the membrane poten-tial waveform. The changes in the densities of the various channels, according to the values shown in the echelon map ofFig 4, compensate for the effect of shifting the BK channel den-sity. This points to a substantial degree of functional redundancy: apparently, the biological role of BK channels is readily fulfilled by other channels (at least for the waveform under con-sideration here). For instance, shifts for BK+β1 can be compensated by A-type and Kv2.1 (Fig 4). This redundancy is consistent with the finding by Aaronson et al that inhibition of BK channels has no effect on uterine contractionsin vitro[40].
[image:10.612.39.427.392.660.2]hERG. The adjustments prescribed by the redundancy map translate into extremely large compensatory shifts that are physiologically implausible; the channel is effectively pinned because even a minute change in its density cannot be compensated by a combination of
Fig 4. Redundancy map for the BK potassium channel.Heat map of the null space matrix in echelon form with BK as a leading variable, showing which linear combinations of other channels can compensate for shifts in BK density. Whereas shifts in the BKαdensity require virtually no compensation to
maintain the voltage waveform, shifts in e.g. BKα+β4 require large compensatory shifts in several other channels, both upward and downward. The color key
relates hue to thelog10of the fold change.
doi:10.1371/journal.pcbi.1004828.g004
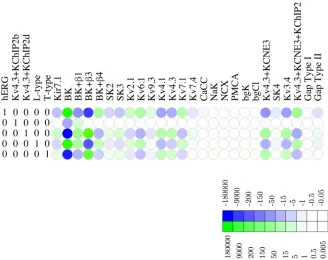
adjustments in other channels. A point in case is the channel hERG, where a slight decrease of 1 channel/pF in the hERG channel density would require*200,000 channels/pF increase in BK,*10,000 channels/pF decrease in BKα+β3, and an increase of*150 channels/pF in the
Kv4.3/KCNE3/KChIP2, as shown inFig 5. The redundancy map thus suggests that hERG is non-compensatable (relative to the observed voltage waveform). In biological terms, this sug-gests that hERG is functionally non-redundant, i.e.,essential. This conclusion agrees with the experimental finding that application of the hERG antagonist dofetilide initiates prolonged depolarisations [41].
SK. The genes encoding the family of SK channels exhibit substantial structural homology, with little similarity to members of other potassium-channel subfamilies [23]. In MSMCs the expressed channels are SK3and SK4[13,42]. The high degree of homology suggests members
of the SK family should be readily interchangeable. To verify this, we selected the SK2channel
as a leading variable for the echelon form and found that a unit change in the latter can be com-pensated by an 0.49 units negative shift in the SK3channel density, and 0.45 units negative
shift in the SK4channels density. Using the model in free-running mode, we tested the effect of
increasing the SK2channel density by 0.4 channels/pF on the membrane waveform. As shown
inFig 7, this perturbation can be compensated by decreasing the SK3density by 0.15 channels/
pF and decreasing the SK4density by 0.14 channels/pF.
Simulations to explore hypotheses on periodic triggering of
depolarisation
[image:11.612.200.528.77.337.2]Uterine contraction during labor is characterised by its automaticity [43]. The myogenic mech-anisms underlying uterine activity are not fully understood, although it is generally accepted
Fig 5. Redundancy map for the hERG potassium channel.Heat map of the null space matrix in echelon form with hERG as a leading variable, showing which linear combinations of other channels can compensate for shifts in BK density. Shifts in e.g. hERG require large compensatory shifts in several other channels. The color key relates hue to thelog10of the fold change.
that a major contribution is made by the increase in the concentration of intracellular calcium of MSMCs via L-type calcium channels [43]. Here we explore three mechanisms that could result in the initiation of periodic spontaneous contractions. The first mechanism acts through the activation of the purinergic membrane receptor (P2RX4), which is an adenosine triphos-phate (ATP)-gated ion channel. The second mechanism depends on the periodic depletion of phosphatidylinositol-4,5 bisphosphate (PIP2), which modulates the activation of a number of
plasma membrane potassium ion channels. Closure of these channels would promote
Fig 6. The effect of a shift in the BK channel density on the action potential.The effect of varying the BK channel density on the action potential triggered by a 10-sec extracellular ATP step function, compared to compensatory corrections of the densities of the various other channels according to the redundancy map shown inFig 4. The solid line shows the reference waveform, which is produced by running the simulation model in free-running mode with parameter values constrained by theℓ1-norm. The dashed line shows the distortion caused by a small change in BK density, while the dotted line shows the
waveform when compensatory shifts in other channels are applied in addition to the BK perturbation, partially restoring the waveform back to the reference waveform. (i) enlarged detail.
doi:10.1371/journal.pcbi.1004828.g006
Fig 7. Effect of a shift in the SK2channel density on the action potential.The effect of varying the SK2channel density on the action potential triggered
by a 10-sec extracellular ATP step function, compared to compensatory corrections of the densities of the various other channels according to the redundancy map. The solid line shows the reference waveform, which is produced by running the simulation model in free-running mode with parameter values constrained by theℓ1-norm. The dashed line shows the distortion caused by a small change in SK2density, while the dotted line shows the waveform
when compensatory shifts in other channels are applied in addition to the SK2perturbation, partially restoring the waveform back to the reference waveform.
(i, ii) enlarged details.
doi:10.1371/journal.pcbi.1004828.g007
depolarisation and subsequent contractions. The third mechanism is based on periodic intra-cellular Ca2+release from sarcoplasmic reticular stores, leading to activation of the Ca2+ -acti-vated Cl−conductance ANO1.
Hypothesis I: Availability of ATP. We investigated the role of ATP in the depolarisation that initiates spontaneous electrical activity and hypothesised that the initiation of the depolari-sation is via activation of the P2RX4 receptor by a periodic release of ATP via hemichannels [44–46]. Several lines of evidence point to the existence of a purine-gated non-specific cationic conductance in MSMCs [47–49]: the mRNA expression levels of P2RX4 and P2RX7 increase in rat myometrial samples as pregnancy progresses [47], suggesting that these receptors are associated with uterine contractions at term. Moreover, mRNA for these proteins is increased upon stimulation with lipopolysaccharide, which is a known stimulant of preterm labor [47]. In freshly dissociated rat myometrial cells, a non-specific cationic conductance consistent with the biophysical properties of P2RX7 was measured upon stimulation with ATP [48,49]. In human MSMCs both isoforms are expressed, but P2RX4 dominates [13].
We modeled the current conducted by P2RX4 and added it to the model. The time course of the extracellular ATP concentration ([ATP]o) was assumed to be constant over a time
inter-val of finite duration of 10 s and zero outside this interinter-val, and this step function was used as a forcing function to drive the ATP-gated kinetics of P2RX4, in free-running simulations using the conductance repertoire found for the minimalℓ1-norm criterion. The P2RX4 channel is
activated by [ATP]o, evoking an inward current that activates and deactivates rapidly and
desensitises relatively slowly (within seconds of continuous agonist application) [50]. The rates of activation and desensitisation are dependent on [ATP]o, whereas the activation and
desensi-tisation time constants are inversely correlated with [ATP]o[50]. The ATP-dependence of the
steady-state of the P2RX4 activation variable was modeled by the Hill equation which was fit-ted to experimental data [38], giving an EC50of 32μM and a Hill coefficient of 1.6 (Fig 8B).
The time constants of activation and desensitisationτactandτdes, were determined by fitting a
single exponential to current data [38]. The simulated current trace is shown inFig 8A. The channel P2RX4 has a unitary conductance of*36 pS; it is impermeable to Cl−, highly permeable to Ca2+, and equally permeable to Na+and K+with a ratio of calcium to monovalent ion permeability of 4.2 [51]. To calculateEP2RX4(the reversal potential of the P2RX4), we used
the Goldman-Hodgkin-Katz voltage equation [1,52,53]. The current carried by P2RX4 is
Fig 8. Properties ofIP2X4.(A) NormalisedIP2X4theoretical current traces for various ATP concentrations at a holding potential of−60 mV. (B) Simulated
ATP-concentration effect curve (solid line) and experimental data by Toulme et al [38] (solid circles). Values are normalised to the peak current values.
given by the following equation:
IP2RX4¼kP2RX4GP2RX4PactPdesðVEP2RX4Þ; ð2Þ
whereκP2RX4is the P2RX4 channel density,GP2RX4is the unitary conductance andPactand
Pdesare the activation and desensitisation gating variables, respectively. We setκP2RX4= 90
channels/pF; further details can be found in the Supplementary Material.Fig 9confirms that the 10-second temporary elevation of [ATP]oleads to depolarizations.
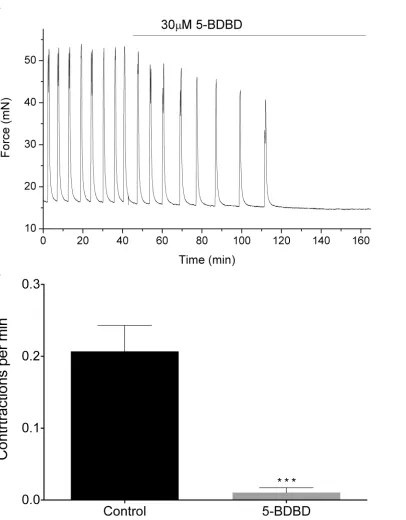
To assess experimentally how P2RX4 might initiate spontaneous contractions, we recorded isometric tension from*5 × 10 mm muscle strips of the human myometrium, examining the effects of the P2RX4-antagonist 5-(3-Bromophenyl)-1,3-dihydro-2H-Benzofuro[3,2-e]-1,4-diazepin-2-one (5-BDBD) on contractile activity (seeMaterials and Methodssection for details).Fig 10Ashows a representative trace of the mechanical activity observed in term human myometrium, where application of 30μM 5-BDBD reduces contraction frequency to zero. The contraction frequency was significantly reduced from 0.2±0.09 to 0.01±0.01 contrac-tions per minute, as shown inFig 10B(n= 11,p0.001).
Hypothesis II: Periodic depletion of PIP2. An alternative hypothesis to explain periodic
depolarisation in MSMCs is that depletion of PIP2affects several potassium channels. The
sec-ond messenger precursor PIP2is located in the inner leaflet of the cell plasma membrane
where it participates in several signalling pathways, one of which produces the second messen-gers diacylglycerol and inositol-1,4,5-triphosphate [1]. Numerous plasma membrane ion chan-nels require PIP2to function and can be inhibited by signalling pathways that deplete PIP2
[54]. In particular, PIP2regulates myometrial potassium channels such as Kir7.1, Kv7.1, Kv7.4,
and hERG, and PIP2could therefore well be the means by which the cell coordinates
intracellu-lar processes with gating of electrogenic proteins. In this way, periodic depletion of PIP2could
lead to depolarisation.
Lacking dose-response data on PIP2, we assumed a“two-level”mechanism: a release of
PIP2followed by a temporary depletion and then a replenishment of PIP2. We examined in
detail the effect of PIP2concentration on the kinetics of each of the ion channels affected.
Two models, with different kinetics, were constructed for each of those channels, both with and without PIP2application. We investigated the effect of PIP2on each of the susceptible
channels.
Effect of PIP2on hERG.PIP2modulates hERG by increasing its maximal current,
concomi-tantly slowing deactivation, and changing activation and inactivation gating; at low PIP2levels,
a marginal hERG current persists [55]. A Markov model, adopted from previously described hERG models (seeMaterials and Methods) was used to simulate the effect of PIP2on hERG
[55]. Inactivation was modeled as a late activation-dependent transition. All transition rates were voltage-dependent. Model equations and parameters are given in theS1 Equations.
Effect of PIP2on Kir7.1Members of Kir channel family were among the first channels
dem-onstrated to be gated by PIP2[54]. In general, Kir channels run down if PIP2is depleted and
reactivate if PIP2is applied. Pattnaik et al [56] recorded whole-cell currents in solitary bovine
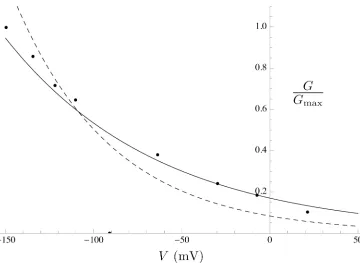
RPE cells and isolated the Kir7.1 current as the Cs+-sensitive component. We extracted the G-Vcurve from the Cs+-sensitiveI–Vcurve in a cell dialysed with solution containing 50μM PIP2from Pattnaik et al [56] (Fig 11; equations are given inS1 Equations).
Effect of PIP2on Kv7.1 and Kv7.4.PIP2controls the activity of the KCNQ1/KCNE1
potas-sium channel complex; the current is suppressed by depletion of PIP2[57]. However, we were
unable to locate experimental data in the literature to support an effect of PIP2on Kv7.1 and
Kv7.4.
No support for hypothesis II.In free-running simulations using the conductance repertoire consistent with the smallestℓ1-norm, the switch was applied for 30 seconds. Corresponding
[image:15.612.45.451.79.599.2]changes in the kinetics of the above ion channels were induced but failed to trigger an action potential.
Fig 9. Effect of increasing the extracellular ATP concentration.Simulation of the mathematical model in free-running mode, showing the effect of increasing the extracellular ATP concentration on the myometrium AP waveform. Key to ATP concentrations during 10-sec application: light blue: nil; blue: 10 μM; black: 100μM; green: 1 mM; and red: 10 mM.
Hypothesis III: Effect of calcium on chloride conductance. Intermittent release of cal-cium ions from intracellular stores gives rise to short-lasting local elevations of [Ca2+]i, known
as‘puffs’or‘sparks’[58]. We surmised that these fluctuations drive a spontaneous transient inward current (STIC) which is carried by calcium-activated chloride channels (CaCCs). The activation of CaCCs depolarises the membrane slightly, increasing excitability and leading to the opening of L-type calcium channels, which in turn depolarises the membrane further. Fur-ther evidence for the involvement of CaCCs was provided by Wray et al [59], who showed that
Fig 10. Effect of 5-BDBD on mechanical activity.(A) Representative trace of force generated by human myometrium at term, registered before and during application of 5-BDBD. (B) Reduction of contraction frequency associated with application of 5-BDBD (n= 11, means±SEM,p<0.001).
[image:16.612.42.490.78.329.2]doi:10.1371/journal.pcbi.1004828.g010
Fig 11. Effect of PIP2on the Kir7.1G-Vcurve.Simulated PIP2effect onG-Vcurve (solid line) with data
extracted from experiments by Pattnaik et al [56] (solid circles). TheG-Vcurve in the absence of PIP2
(dashed line) is shown for comparison.
doi:10.1371/journal.pcbi.1004828.g011
the pharmacological inhibition of CaCCs reduced the frequency of spontaneous contractions, although only*30% of MSMCs expressed these channels, which suggests that only cells within this subgroup have the potential to be pacemakers [59]. The CaCCs ANO1 and ANO2 are both present in human and murine myometrium and application of the antagonist tannic acid inhibits both STICs and MSMC contraction [60].
Local calcium sparks have been demonstrated in cardiac [61], skeletal [62,63], and smooth muscle [64]. A single calcium spark is capable of producing a substantial local Ca2+increase (10–100μM) [58], which barely affects the overall cellular calcium concentration (2 nM increase) [58]. The duration of a single spark is*100–450 ms [58,65] and the same is true for STICs since the decay of the STIC mirrors the decay of the spark. The time interval between sparks varies from 200 ms to 1200 ms [58,60,66] and the frequency is between one to three sparks per second when cAMP or cGMP are elevated [66]. Each spark will activate*600 CaCCs, and the activation of*5% of the CaCC channels produces STIC [58]. Thus, the dura-tion, amplitude, and frequency of the sparks, as well as the density of the CaCCs, could be cen-tral factors governing spontaneous contractions in MSMCs.
We investigated the putative role of CaCCs in MSMCs by representing the opening events of IP3-operated channels as a stochastic process [59] (as described inMaterials and Methods).
This process was used to drive the gating kinetics of a sub-population of CaCCs. Simulations in free-running mode revealed that a train of APs could be elicited when we imposed a succession of random sparks with duration between 200 ms to 500 ms, an amplitude of 10 to 80μM, and an average frequency around one spark per second (Fig 12). Spark amplitudes lower than 10
μM did not trigger a full AP, while increasing the amplitude of the sparks beyond 10μM did not result in a significant variation in AP shapes. A density of at least 800 CaCCs per cell was required to elicit excitation. The duration and frequency of the AP train mirrored that of the generated sparks.
Model simulations supporting experimental design
Using free-running mode simulations in which the cell was activated through ATP variation (as outlined above), we evaluated the effect of increasing or decreasing various channel densi-ties. The results are shown inFig 13. When the BK channel density was set to zero, no signifi-cant effect was observed on the waveform, in accordance with our earlier characterisation of BK as functionally redundant. On the other hand, variation of Kv2.1 density, from around 30 channels/pF (double the estimated channel density of Kv2.1) to 0 channels/pF (complete block of Kv2.1), had a substantial effect on the waveform (Fig 13). When Kv2.1 was completely blocked, there was a more marked overshoot of the AP that rapidly depolarised to a plateau level with increased AP frequency. The slight change in the resting membrane potential (RMP) might imply a minor role for Kv2.1 in maintaining the RMP.
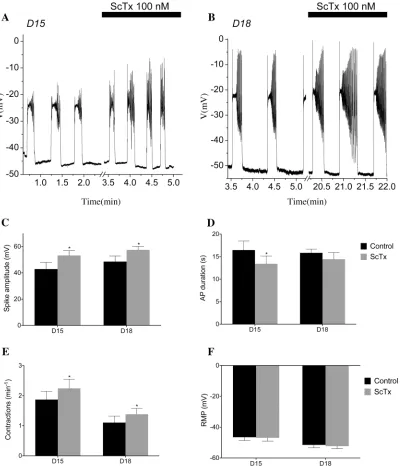
56.21±3.37 mV (p0.05) in D18 tissue. Application of 100 nM ScTx also significantly increased AP frequency in D15 samples from a mean of 1.69±0.18 AP min−1to 2.31±0.34 AP min−1and 1.11±0.22 AP min−1to 1.38±0.19 AP min−1. A modest yet consistent reduction in the duration of AP was apparent in APs recorded from D15 tissue. The number of experi-ments carried out in the current study was insufficient to detect a significant change in RMP with ScTx application in either D15 or D18 cells (Fig 14F). To assess how Kv2.1 regulates
Fig 12. Simulations in support of Hypothesis III.(A) Simulated local calcium sparks; the panel to the right is an expanded time-axis representation of the boxed section (i). (B) Train of action potentials in response to driving the gating kinetics of a small proportion (5%) of the CaCC population with the simulated calcium sparks on top of the global cytosolic calcium concentration.
[image:18.612.205.565.73.336.2]doi:10.1371/journal.pcbi.1004828.g012
Fig 13. Model simulations in free-running mode.(A) Action potential triggered by a 10-sec extracellular ATP step function from 0 to 15μM with parameter values constrained by theℓ1-norm. (B) Effect of setting the channel densities of BK and its isoforms to zero. (C) Effect of doubling the channel densities of BK
and its isoforms. (D) Effect of setting the channel density of the Kv2.1 channel to zero. (E) Effect of doubling the channel density of Kv2.1.
doi:10.1371/journal.pcbi.1004828.g013
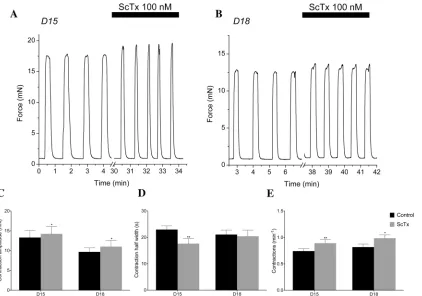
spontaneous contractions, we recorded isometric tension from*3 × 10 mm muscle strips of the longitudinal layer of the mouse myometrium, examining the effects of 100 nM ScTx on the activity.Fig 15A and 15Bshow representative traces of the mechanical activity of D15 and D18 myometrium. In the presence of 100 nM ScTx, contraction amplitude was increased (13.32
Fig 14. ScTx modulates AP frequency, duration, and spike amplitude.Spontaneous electrical activity recorded from the longitudinal layer of D15 & D18 murine myometrium (A, B). Activity consisted of slow depolarisation to threshold, followed by an action potential composed of a plateau upon which a number of spikes were superimposed. The bar represents the maximum effect in the presence of 100 nM ScTx. (C) Mean AP spike amplitude increase from 42.87 ±5.07 mV to 53.25±3.78 mV (p0.05) in D15 tissue (n= 6) and from 45.5±4.96 mV to 56.21±3.37 mV in D18 tissue (n= 6). (D) Decrease in mean AP duration from 16.77±2.14 s to 11.87±0.76 s (p0.05) in D15 tissue but no significant difference in D18 tissue. (E) Application of 100 nM of ScTx increased AP frequency in the D15 samples from a mean of 1.69±0.18 to 2.31±0.34 AP min−1and from 1.11±0.22 to 1.38±0.19 AP min−1in D18 tissue. (F) ScTx did not
alter the resting membrane potential of either D15 or D18 (p0.01).
±1.79 to 14.24±1.87 mN, D15; 9.69±1.79 to 11.02±1.87 mN, D18;Fig 15C), as was frequency (0.74±0.05 to 0.89±0.07 contractions per minute, D15; 0.82±0.06 to 0.99±0.07 contractions per minute, D18;Fig 15E), whereas contraction half-width was reduced (22.97±1.38 to 17.65±1.86 s, D15; not significant in D18;Fig 15D).
Discussion
Laser-capture microdissection [67] and mRNA-sequencing have led to significant advances in gene expression analysis in both single cells and tissues. Application of these techniques pro-vided a complete repertoire of the mRNA population in MSMCs, which we used to construct a list of possible electrogenic entities by combining all possible combinations of ion channel sub-units that are potentially expressed in the MSMC. Since many channels exist as various combi-nations of subunits, we obtain a repertoire of over thirty electrogenic entities that could be present in the plasma membrane of the MSMC. A mathematical model for every individual potential oligomeric channel complex was formulated on the basis of biophysical data in the lit-erature (typically obtained via heterologous expression).
[image:20.612.40.462.76.372.2]We used native cell behavior to drive the individual conductance currents (viz. voltage and calcium time series as detailed in Materials and Methods). The remaining unknowns were the
Fig 15. Kv2.1 contribution to spontaneous contractile activity.(A, B) Representative isometric force recordings in the presence of 100 nM ScTx in D15 (A) and D18 (B). (C) ScTx significantly increases contraction amplitude in both D15 murine myometrium from 13.32±1.79 mN to 14.24±1.87 mN and in D18 from 9.69±1.79 mN to 11.02±1.87 mN. (D) ScTx significantly decreases contraction half width in D15 from 22.97±1.38s to 17.65±1.86s, while contraction half width in D18 tissue remained unchanged. (E) Effect of ScTx on contraction frequency for D15 & D18 murine myometrium. ScTx significantly increased contraction frequency for D15 & D18 murine myometrium from 0.74±0.05 to 0.89±0.07 contractions per minute and in D18 from 0.82±0.06 to 0.99±0.07 contractions per minute (p0.01,n= 7).
doi:10.1371/journal.pcbi.1004828.g015
densities in the plasma membrane of the various species. The observed membrane potential time series is linear in these densities, allowing us to calculate the space of all possible solutions of ion channel densities that are consistent with the observed data; the functional redundancy of the system is represented by the basis vectors of this space. To fix the channel densities we considered the most parsimonious solution defined as having the smallestℓ1-norm subject to
non-negativity. Alternative criteria are possible, such as optimising for agreement with mRNA expression levels for the conductances. However, this approach is conditional on accurate quantitative measurements of expression levels, and on the availability of a reliable mapping from transcriptomics to functional proteomics; neither condition is satisfactorily met at the present state of the art (life times and translation efficiencies of mRNA species vary; moreover, the protein may be stored or degraded instead of being translocated to the membrane).
Predictions were made using our model based on the conductance repertoire imposed by the criterion of the smallestℓ1-norm. These predictions were tested against experimental data,
obtained in voltage-clamp experiments for isolated currents that were sensitive to inhibition by antagonist application. The simulated values of peak currents in response to voltage steps closely matched the values that were observed experimentally. In the case of certain channels, for example Kir7.1, the simulated data failed to predict the observed data accurately, which can be attributed to the fact the particular voltage waveform that was used to drive the model does not distinguish well between currents (e.g. between the Kir7.1 current and the background potassium current).
The myometrium has been modeled at the levels of both tissue and the whole organ [5–7]. Bursztyn et al developed an excitation-contraction model of the uterine muscle cells, compris-ing voltage-gated calcium channels, calcium transporters, and Na+/Ca2+exchangers [8]. This model explicitly accounts for the processes of myosin light chain phosphorylation and stress production as per the cross-bridge model of Hai and Murphy [9], but did not include the inac-tivation process of the calcium current and several other ionic currents. By contrast, Rihana et al [10] modeled themacroscopiccurrents for each of the relevant ionic species based on volt-age-clamp experiments; the dimension of the state space of this model was an order of magni-tude lower than ours. Nevertheless, they were able to reproduce various phenomena, such as a single AP, or a train of APs with an RMP of−35 mV to−40 mV and a duration of about 133– 200 ms. Another macroscopic ionic current model, accounting for fourteen types of current, was presented by Tong et al [4]. Gating kinetics in the present study were largely derived from equations and parameter estimates taken from the literature and as such representative of the state of the art in the field; accordingly, not all models may have been evaluated to the same standard of rigour as advocated by Fink and Noble [68].
Huys et al [69] proposed an approach similar to ours. However, they illustrated their method on simulated data generated by a macroscopic current model, as opposed to the pres-ent work in which real-life data have been confronted with a microscopically detailed account of all relevant currents. One distinguishing feature of our approach is that we can chart the functional redundancy of the system at the level of individual species of electrogenic entities. The redundancy maps show which combinations of channels can be substituted for one another. We investigated the potential scope for redundancy of the system of some of the most-studied potassium channels in MSMCs (e.g. BK, Kv2.1, SK3, hERG).
the model parameters to probe identifiability and sensitivity, whereas the present method takes a single quantity of interest, the voltage, but treats itsentire time courseas the output and is accordingly time-global. A regression-based method to perform parameter sensitivity analysis in electrophysiological models was proposed by Sobie [73], who derived quasi-equiv-alent linear models by treating simulation outputs obtained under randomised parameter var-iation as statistical input data. Saltelli and Annoni [71] emphasize the essential locality of
“one-at-a-time exploration”given the lack of information that would be provided by the higher-order derivatives (including cross terms), but this caveat is not applicable here since the model is linear in the vector of parameters of interest (our model is non-linear in the parameters that were fixed from extraneous data but this is not germane to the point made by these latter authors).
The role of BK channels in modulating uterine excitability remains controversial: whilst the presence of the protein and an active conductance are not disputed [74–76], the impact of the BK current is not fully understood [40]. Our functional redundancy analysis indicates that the effect of BK can be compensated by small changes in the channel densities of the other chan-nels in the model. This suggests that the effect which BK exerts on the voltage waveform (as observed in the present study) is readily replaceable by the currents carried by other electro-genic entities. This observation is consistent with the findings of Aaronson et al, who demon-strated that application of BK inhibitors has no effect on spontaneously contracting rodent myometrial strips [40]. If BK can be readily substituted by suitable combinations of other chan-nels, one might ask why it should be part of the conductance repertoire at all. It may be relevant that the unitary conductance of the BK channel is unusually large [77], which means that the cell can be silenced by expressing even a minor number of these molecules. Perhaps BK serves the function of an“emergency shut-down.”
We also investigated the potential involvement of Kv2.1 in shaping the action potential (AP). We investigated the effect of changes in Kv2.1 channel density on the AP waveform by running free-running simulations. Decreasing the Kv2.1 channel density from the estimated value to zero increased the amplitude of the initial AP as well as the rate at which steady state is reached during the plateau phase of the AP. The predicted effects on AP amplitude and fre-quency were confirmed by experiments although the effect on the resting membrane potential (RMP) could not be verified with certitude. It appears that Kv2.1 channels do play a role in modulating the excitability of the myometrium by inhibiting both contraction frequency and amplitude, while contributing little to the RMP.
As regards the hERG channel, our functional redundancy analysis indicated that small changes in the hERG channel density could not be compensated by physiologically realistic adjustments in the densities of the other channels. In addition, the simulations carried out free-running mode suggest that variations in the hERG channel density substantially affect the AP waveform (Fig 13). Taken together, these findings indicate that hERG is a major suppressor of bursting activity in MSMCs, in keeping with Greenwood et al [41], who observed that the ERG-specific blocker dofetilide-induced contractions in quiescent tissues, while ERG-channel blockers were able to induce contractions in tissue strips that failed to develop spontaneous rhythmic activity.
In contrast to hERG’s essential role, the SK channels were found to be readily susceptible to compensation. The redundancy analysis indicates that SK2can be functionally replaced by
adjustments in SK3and SK4densities. This is in accordance with the close physiological
simi-larities between the members of the SK family.
We also demonstrated the utility of the model in exploring various mechanistic hypotheses, addressing three mechanisms that could trigger spontaneous contractions. Simulations pro-vided supporting evidence for the involvement of extracellular ATP and/or calcium‘sparks’
affecting CaCCs, whereas we found no support for a role of PIP2acting on potassium channels.
Although far from conclusive in their own right, such simulations can help experimentalists to pinpoint promising research avenues.
The model can be improved in several ways. In its present form, the dynamics of intracellu-lar calcium are represented in a minimalistic way and a more physiologically faithful model would be desirable. However, this is subject to the quality of the temporospatial resolution of the cytosolic and sarcoplastic-reticular levels of Ca2+. Another mechanism we have not consid-ered here is the feedback from force-generation on the dynamics of membrane potential, which acts via stretch-sensitive ion channels. Furthermore, our model describes a single cell, whereas thein vivoactivity of MSMCs is critically dependent on their interconnectivity. Thus, a multi-cell model with realistic network properties would constitute another future improvement.
In the present study a spontaneous voltage signal was imposed. It is also possible to impose artificial voltage waveforms (AVWs), for instance composed as a linear combination of B-splines, and compare the current response to such an AVW to the current response of the model. The advantage of this approach would be that the AVW can be optimised to discrimi-nate maximally between two given conductances, for instance by minimising the inner product between the current responses of the respective conductances, where the two are considered as functions of time. A tighter upper bound on the functional redundancy of the system can be obtained in this manner.
The functional redundancy we map is strictly relative to the waveform that is imposed. As more behaviors are explored, more“essential roles”are revealed and the dimensionality of the kernel can generically be expected to diminish; in fact, it could come down all the way to zero, which would imply that there is no intrinsic redundancy in the conductance repertoire. Alter-natively, the kernel dimensionality settles on a non-zero value“in the limit of arbitrarily many explored behaviors”—this value would then denote the irreducible functional redundancy of the system. It stands to reason that sundry physiological limitations will impose further con-straints on the system, but the considerations in the present paper concern only the functional redundancy vis-à-vis the membrane conductance repertoire.
Two key advantages of our approach are that it ismodularandexpandable. The model can readily accommodate new information regarding additional conductances or novel kinetic properties. Moreover, being expressed in terms of microscopic conductances that correspond to particular molecular entities, the model can in principle be related directly to transcrip-tomics. This has important practical advantages, because transcriptomics data can be acquired in different tissues, and at different time points, accurately surveying all potential molecular entities. Another facet of the expandability of our approach is that the characterisation of func-tional redundancy, becomes more accurate, that is, comes closer to the irreducible funcfunc-tional redundancy, as a wider range of physiological behavior of a given cell (both spontaneous and evoked) is observed.
Materials and Methods
Ethics statement
All procedures were conducted within the guidelines ofThe Declaration of Helsinkiand were subject to local ethical approval (REC-05/Q2802/107). Prior to surgery, informed written con-sent for sample collection was obtained.
Experimental methods
Solutions. Fresh samples were stored in ice-cold modified Krebs-Henseleit (m-KHS) solu-tion containing (mmol l−1): NaCl 133; KCl 4.7; Tes 10; glucose 11.1; MgSO41.2; KH2PO41.2;
CaCl22.5; adjusted to pH 7.4 at 25°C with 5 NaOH. Hank’s Balanced Salt Solution (HBSS)
con-taining no calcium or magnesium was purchased from Invitrogen (Paisley, UK). The electrode (internal) solution for voltage clamp studies contained (mmol l−1): KCL 140; EGTA 1.1; CaCl2
0.06; Hepes 10; MgCl22; adjusted to pH 7.2 at 25°C with 5 NaOH.
5-(3-Bromophenyl)-1,3-dihydro-2H-Benzofuro[3,2-e]-1,4-diazepin-2-one (5-BDBD) stock solution was prepared in DMSO (Tocris Bioscience, Bristol, UK). ScTx stock solution was prepared in HBSS (Alo-mone Labs, Jerusalem, Israel).
Subject criteria and sample collection. Subject criteria.Samples were taken at caesarean section at term (>37 and<40 completed weeks gestation).
Sample collection.At caesarean section, human tissue samples were collected before synto-cin administration by knife biopsy from the lower uterine segment incision. Samples for cell isolation were placed in ice-cold modified Krebs-Henseleit solution and utilised the same day. Experiments were also carried out on murine whole tissue or single cells taken from day of gestation 15 (D15) and 18 (D18) pregnant mice (B6 CB F1), culled by CO2asphyxiation.
The uterine horn was dissected to remove the pups and the myometrium was stored in ice-cold m-KHS.
Cell isolation.Strips of myometrium from the longitudinal layer (2 × 2 × 20 mm) were iso-lated and washed in Ca2+- and Mg2+-free HBSS at 37°C for 10, 20, and 30 minutes, respectively, followed by 45 min incubation in digestion solution containing Liberase™(Roche, Welwyn Garden City, UK) dissolved in HBSS to a final concentration of 0.13 WU/ml at 37°C. Digestion was terminated by several dilutions with fresh HBSS. Cells were dispersed by slow trituration through a wide-bore fire-polished glass pipette in HBSS Solution. Single myometrial cells were filtered through a 200μM gauze and stored in HBSS for use within 6 hours
Electrophysiology and imaging. Voltage clamp.A drop of myometrial cell suspension was placed in a glass-bottomed petri dish and mounted on the stage of an inverted microscope (IX51, Olympus). After settling (approx. 10 min), cells were perfused with bath solution at a rate of 1–2 ml min−1at 37°C. Patch pipettes were fabricated (Model P-87; Sutter Instruments, Novato, CA, USA) from 1.5 mm glass capillaries with a resistance of 2.0–4.0 MOwhen filled with pipette solution. Liquid junction potential was zeroed prior to seal formation. Transmem-brane currents were recorded with an amplifier (Axopatch 700b; Axon Instruments) using the perforated-patch configuration of the whole-cell patch-clamp technique [78]. The cell mem-brane was perforated using the antibiotic amphotericin B (720μg/ml). Series resistance was compensated after membrane perforation. Currents were elicited by stepping to a range of potentials between−150 and +80 mV from a holding potential of−60 mV. To isolate currents that were sensitive to inhibition by drug application, difference currents were obtained by elec-tronic subtraction of traces. Currents were filtered at 10 kHz and sampled at 5 kHz. Voltage protocols were delivered via a Digidata 1440a computer interface usingpCLAMP 9.0software (Molecular Devices, Sunnyvale, CA, USA).
Ca2+imaging and current clamp recordings of isolated cells(recordings inS1 Data) Smooth muscle cells were impaled with glass microelectrodes filled with 2M KCl of resistance 80–120 MO. Transmembrane potentials were recorded at an acquisition rate of 1 KHz with an ampli-fier (Axopatch 700b; Axon Instruments) and a Digidata 1440a computer interface using pCLAMP 9.0software (Molecular Devices, Sunnyvale, CA, USA).
Single myometrial smooth muscle cells were plated onto glass-bottomed, collagen-coated dishes (Matek, Massachusetts, USA) and left to adhere for 10 min on an Olympus IX51 micro-scope stage. Cells were incubated in the dark for 60 min at room temperature with the Ca2+ -sensitive fluorescent dye Fluo4-AM (5μM, Invitrogen, Paisley, UK), Pluronic F127 (0.025%, w/v) was included to aid dye loading. Cells were washed then maintained at 37°C in m-KHS. Fluo-4 was excited by an X-cite 120 UV lamp (EXFO, Eastleigh, UK) and emitted light (520 nm) was captured with a LucaEMEMCCD camera, which was controlled by theIQsoftware package (Andor Technology, Belfast, UK). Images were acquired at 30 Hz.
Mean camera background was subtracted and images were normalised to obtain f/f0by
dividing the entire image by the mean intensity of the cell during a quiescent period, defined as the minimum fluorescence obtained between periods of excitation.
Current clamp recordings of myometrial strips.Strips (5 × 10 mm) of murine myometrium from the longitudinal layer were pinned out on a sylguard base and perfused with m-KHS solu-tion at 37°C on an upright microscope (MVX10, Olympus). Tissue was incubated with 5μM wortmannin (Sigma) to prevent spontaneous contractions from dislodging impalements. Smooth muscle cells were impaled with glass microelectrodes filled with 2M KCl, of resistance 80–120 MO. Transmembrane potentials were recorded with an amplifier (Axopatch 700b; Axon Instruments) and a Digidata 1440a computer interface runningpCLAMP 9.0software (Molecular Devices, Sunnyvale, CA, USA).
Isometric tension recordings. Murine myometrium.Strips of myometrium measuring approximately 2 × 2 × 10 mm were cut the longitudinal layer of D15 and D18 uterine horns. Each strip was mounted horizontally on a muscle strip myograph system (800MS, Danish MyoTechnology, Denmark) placed under 2 mN tension. Strips were bathed in 4 ml of m-KHS at 37° which was replaced every 30 minutes. After an initial equilibration period, isometric force was recorded usingLABCHARTsoftware (ADI Instruments, Oxford, UK).
Human myometrium.Myometrial muscle strips approximately 10 × 2 × 2 mm were mounted vertically in 10 ml organ bath chamber perfused in m-KHS at 37°C. Force was mea-sured with FT03C transducers (Grass Instrument Co, Quincy, Mas) and recorded digitally withMacLab Chartsoftware (ADInstruments Ltd, Oxfordshire, UK). Strips were held under 20 mN tension and allowed to equilibrate for 90–120 min, wherein spontaneous contractions were observed. Strips that failed to contract spontaneously were excluded. 5-BDBD was added directly to the organ bath chamber.
Computational methods. Data were extracted from published graphs by means of the graph digitiser software packageGraphClick. Least-squares estimation was used to estimate parameter values. The equilibrium point of the dynamics without input current was used as initial condition. All analyses were carried out inMathematica(Wolfram Research, Cham-paign, IL), using the built-in facilities for the numerical evaluation of differential equations, least-squares estimation, and singular-value decomposition. Code is listed inS1andS2 Mod-els. Briefly, theMathematicafunctionNDSolvewas used to solve ordinary differential equa-tions, using an adaptive method. The default method,Automatic, automatically switches between backward differentiation formulas and Adams multistep methods, depending on the stiffness. InMathematica,FindFitwas used to perform least-squares parameter
estima-tion,SingularValueDecompositionto obtain singular value decompositions, and
carried out using GraphpadPrism (California, USA). Data are presented as mean ± standard error of the mean, withnreferring to the number of cells. Statistical significance two-tailed paired or unpaired studentt-test where relevant. Significance is indicated at levels of 0.05 (), 0.01 (), or 0.005 ().
The channel-density method is based on the well-established current summation frame-work:
C d
dtV¼IðtÞ
Xn
i¼1
ϰiciðtÞ ð3Þ
(this iseq (1), repeated here for the sake of convenience). The unit currentsψiare generally
described by the following standard equation:
ci¼giðxÞðVEiÞ ð4Þ
wheregiis unit conductance, dependent on gating variables collected in a vectorx, andEiis the
reversal potential of theith conductance. For every channel, there is a more or less complex model describing the gating kinetics. In abstract form, each of these can be represented as fol-lows:
d
dtx¼fðx;VðtÞ;uðtÞÞ: ð5Þ
Hereu(t) denotes any additional input variables, such as the intracellular calcium concentra-tion and the extracellular ATP concentraconcentra-tion;xcollects the gating variables for all the conduc-tances, transporters, and exchangers in the model, andfrepresents the dynamics of these variables. In our modelx2R123.
The experimentally observed time series for the membrane potentialV(t), together with the calcium time series (treated as an input variableu(t)), are used as forcing functions to drive the gating kinetics,eq (5), in a numerical solution of the corresponding initial-value problem (IVP). In practice, we are dealing with a time series in which the membrane potential has been observed at timest1,t2,. . .,tm, where is can be arranged thatm>n. Numerical solution of the
IVP requires that we work with interpolated forms of the voltage and calcium waveforms; we ensured that the sampling density was sufficient that linear interpolation gave satisfying results not substantially different from higher-order interpolations. The numerical solution of the IVP yields the currentsψi, which are in turn integrated numerically to give:
qiðtkÞ ¼
Z tk
0
ciðtÞdt ð6Þ
at timestkwith 1km. We can represent the basiceq (3)as an integral equation
VðtkÞ ¼Vð0Þ þV0ðtkÞ
Xn
i¼1 ϰi
CqiðtkÞ ð7Þ
where the voltage term due to injected current is given byV0ðtkÞ ¼C1
Z tk
0 I
ðtÞdt. The integral
form,eq (7), is intrinsically linear in the quantitiesqi(i.e. not the result of a linearisation, hence
global). We define scaled densities as follows:κi=ϰi/Cfori= 1,. . .,n, which we collect collect
in a vectorκ2Rþn. This vector represents the conductance repertoire. Our objective is tofind
a value for the conductance repertoireκthat minimises the discrepancy between the driving time seriesV(tk) and the membrane potential calculated according toeq (7).
Next, we defineWto be anm×nmatrix such thatWhi=qi(th) andYto be anm-vector
whosehth element isV(th)−V(0)−V0(t). The channel densities, i.e. the elements of the
con-ductance repertoire vectorκ, are constrained by the matrix equation
Y¼Wκ: ð8Þ
Even though this equation is readily solved in the least-squares sense, uniqueness is not ensured since the rankrofWmay be smaller thann.
The space of least-squares solutions can be found via the singular-value decomposition
W=USVT. LetVrdenote the matrix containing the firstrcolumns of then×nmatrix
V,Danr×rdiagonal matrix containing the non-zero singular values, andUrthe matrix
con-taining the firstrcolumns of them×mmatrixU. Then the pseudo-inverse ofWis given by
VrD
1UT
r and a particular least-squares solution is given by the following expression:
κþ¼V
rD1U T
r Y: ð9Þ
This describes the solution characterised by having minimal Euclidian norm. However, it is not necessarily the desired solution because we also require that the densities be non-nega-tive. Otherwise the solution would have no physiological significance. Thefinaln−rcolumns ofVconstitute an orthonormal basis for the null space ofW. Writing these asv01,v02,. . .v0nr,
we have the least-squares estimate for the scaled densities in the following general form:
^
κ ¼κþþXnr
j¼1 gjv0
j : ð10Þ
The coefficientsγ1,γ2,. . .,γn−rremain to be determined, subject to constraint thatκlie in the
positive cone. If we wish to single out one vector in the set of channel density vectors, as is necessary to employ the model in free-running mode simulations, further constraints must be imposed. In addition to non-negativity, we use the criterion of least total channel density. The coefficientsγ1,. . .,γn−rthat minimise the sum of the elements ofκ^(such thatκ^2Rnþ) can then be determined by means of linear programming. The resultingκ^represents the expression profile that achieves the observed behavior with the least amount of molecular building blocks expended (a criterion that can be further refined by noting that ion channels do not all have the same molecular weight; and additional step taking this into account could have been included). We should perhaps emphasise that, due to the non-linearity off, the kernel is strictly local in the space of all possible waveforms; in particular, a reduction of the dimensionality of the kernel may generally be anticipated when the waveform probes the behavioral propensities of the system more extensively (with a slight technical modification, it is even possible to concatenate waveforms from a series of experiments) and in the limit of an arbitrarily extended exploration of the behavioral envelope of the system, the dimension-ality of the kernel approaches the intrinsic functional redundancy of the system from above. In practice, it was found that the affine space generated byeq (10)does not always intersect with the positive cone. Accordingly, a vectorκpwas found using constrained least-squares fit-ting that satisfies the non-negativity requirement, and this value was used instead ofκ+ineq (10)to generate the most-parsimonious solution by means of linear programming. This modi-fication does not affect the analysis of functional redundancy, since the basis of the kernel remains unaltered.
The conductance repertoire vector obtained by the above method was used for exploratory simulations that have been reported previously in McCloskey et al [39].
estimate of these upper bounds (listed inTable 3), we attempted to calculate a reasonable esti-mate for the maximum possible channel density for each of the conductance species in the model, proceeding as follows. From eqs(3)and(4)we obtain the current carried by a speciesi:
Ii¼ϰi giðxÞðVEiÞ: ð11Þ
Using a set of whole-cell voltage-clampI–Vcurves for MSMCs (a selection of which is shown inFig 16), we obtain the steady-state current densityIðVÞfor a given MSMC. Substituting in Eq (11), wefind:
IðVÞ ¼ϰigiðxðVÞÞðVEiÞ; ð12Þ
wherexðVÞis the steady state ofx, which can be treated as function ofVunder voltage-clamp conditions. Hence we have
ϰi ¼
IðVÞ giðxðVÞÞðVEiÞ
; ð13Þ
which can be interpreted as the density that speciesiwould in order to be the sole carrier of the observed current, which gives a conservative upper bound (since in reality the current may be born by several species). Since we are looking for an upper bound, we maximise this expression, described byeq (13), with respect to physiologically achievableV,
^
ϰi¼maxV
IðVÞ giðxðVÞÞðVEiÞ
[image:28.612.203.577.90.384.2]
: ð14Þ
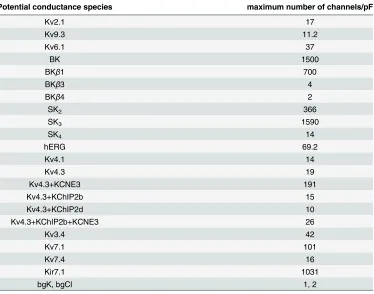
Table 3. Channel density upper bounds.
Potential conductance species maximum number of channels/pF
Kv2.1 17
Kv9.3 11.2
Kv6.1 37
BK 1500
BKβ1 700
BKβ3 4
BKβ4 2
SK2 366
SK3 1590
SK4 14
hERG 69.2
Kv4.1 14
Kv4.3 19
Kv4.3+KCNE3 191
Kv4.3+KChIP2b 15
Kv4.3+KChIP2d 10
Kv4.3+KChIP2b+KCNE3 26
Kv3.4 42
Kv7.1 101
Kv7.4 16
Kir7.1 1031
bgK, bgCl 1, 2
doi:10.1371/journal.pcbi.1004828.t003
![Fig 11. Effect of PIP2 on the Kir7.1 G-V curve. Simulated PIP2 effect on G-V curve (solid line) with dataextracted from experiments by Pattnaik et al [56] (solid circles)](https://thumb-us.123doks.com/thumbv2/123dok_us/9464613.452963/16.612.42.490.78.329/effect-simulated-effect-curve-dataextracted-experiments-pattnaik-circles.webp)