warwick.ac.uk/lib-publications
Original citation:
Roberts, Stephen I., Wright, Steven A., Fahmy, Suhaib A. and Jarvis, Stephen A. (2017)
Metrics for energy-aware software optimisation. In: Kunkel, J. and Yokota , R. and Balaji , P.
and Keyes , D., (eds.) High Performance Computing 32nd International Conference, ISC High
Performance 2017, Frankfurt, Germany, June 18–22, 2017, Proceedings. Lecture Notes in
Computer Science, 10266. Springer, pp. 413-430. ISBN 9783319586663
Permanent WRAP URL:
http://wrap.warwick.ac.uk/87287
Copyright and reuse:
The Warwick Research Archive Portal (WRAP) makes this work by researchers of the
University of Warwick available open access under the following conditions. Copyright ©
and all moral rights to the version of the paper presented here belong to the individual
author(s) and/or other copyright owners. To the extent reasonable and practicable the
material made available in WRAP has been checked for eligibility before being made
available.
Copies of full items can be used for personal research or study, educational, or not-for profit
purposes without prior permission or charge. Provided that the authors, title and full
bibliographic details are credited, a hyperlink and/or URL is given for the original metadata
page and the content is not changed in any way.
Publisher’s statement:
“The final publication is available at Springer via
https://doi.org/10.1007/978-3-319-58667-0_22
A note on versions:
The version presented here may differ from the published version or, version of record, if
you wish to cite this item you are advised to consult the publisher’s version. Please see the
‘permanent WRAP url’ above for details on accessing the published version and note that
access may require a subscription.
Metrics for Energy-Aware Software Optimisation
Stephen I. Roberts, Steven A. Wright, Suhaib A. Fahmy, and Stephen A. Jarvis
University of Warwick, U.K. [email protected]
Abstract. Energy consumption is rapidly becoming a limiting factor in scientific computing. As a result, hardware manufacturers increas-ingly prioritise energy efficiency in their processor designs. Performance engineers are also beginning to explore software optimisation and hard-ware/software co-design as a means to reduce energy consumption. En-ergy efficiency metrics developed by the hardware community are often re-purposed to guide these software optimisation efforts.
In this paper we argue that established metrics, and in particular those in the Energy Delay Product (Etn) family, are unsuitable for energy-aware software optimisation. A good metric should provide meaningful values for a single experiment, allow fair comparison between experiments, and drive optimisation in a sensible direction. We show thatEtnmetrics are unable to fulfil these basic requirements and present suitable alterna-tives for guiding energy-aware software optimisation. We finish with a practical demonstration of the utility of our proposed metrics.
1
Introduction
Advances in processor design have delivered improvements in CPU performance for decades. As physical limits are reached, however, refinements to the same basic technologies are beginning to show diminishing returns [6]. One side-effect of this is an unsustainable rise in system power consumption, which has been identified as a primary constraint for exascale systems [20].
Moore’s law, which states that transistor density doubles every 18-24 months, led to exponential increases in processor performance during a period often re-ferred to as the “free lunch” [23]. More recently, the breakdown of Dennard scaling has meant that performance improvements are increasingly reliant on microarchitectural changes rather than increases in processor clock speed.
Hardware manufacturers are increasingly prioritising energy efficiency in their processor designs [15]. Research suggests that software modifications will be re-quired to fully exploit the resulting improvements in modern architectures [21]. This has spurred interest in the possibility of optimising software for increased energy efficiency.
A fundamental aspect of performance engineering isperformance assessment.
implementations and approaches. Some metrics also serve as fitness functions, combining various costs into a singlefigure of merit(FoM). Such metrics can be used to guide optimisation attempts and the search for better solutions [12].
New metrics which incorporate both energy and runtime costs will be re-quired if developers are to identify and capitalise on new classes of energy-aware optimisations. Many early efforts have borrowed metrics developed by the hard-ware community, which has a long history of energy efficiency research. In par-ticular, the Energy Delay Product (Etn) family of metrics are frequently used for software optimisation.
In this paper we argue thatEtnand related metrics are not suitable for soft-ware optimisation. We discuss their shortcomings and provide examples of their failures in this domain. We then propose alternative metrics which address these
shortcomings and compare their performance withEtn. Finally, we demonstrate
our metrics with an investigation of the energy efficiency of scientific codes.
Specifically, this paper makes the following contributions:
– We present a set of criteria that we believe are necessary for effective software optimisation metrics. Additionally, we introduce fitness landscape diagrams to visualise the behaviour of these metrics;
– We evaluate the Etn family of metrics against our criteria. Our analysis
highlights weaknesses in metrics commonly used in the energy efficiency optimisation literature;
– We propose two new metrics to measure software energy efficiency. We
eval-uate our proposals against the same criteria and describe how they improve on established metrics;
– Finally, we validate our proposed metrics with a study into the efficiency of codes from the Mantevo application suite.
The remainder of this paper is structured as follows: Section 2 presents a survey of related work; Section 3 lays the foundations for this work, providing formal definitions and criteria which we use to compare and assess different metrics; Section 4 uses these criteria to assess the suitability ofEtn metrics for software optimisation; Section 5 introduces our proposed metrics and evaluates them against the same criteria; Section 6 demonstrates the metrics discussed in previ-ous sections by studying the energy efficiency of variprevi-ous applications; and finally Section 7 concludes this paper and describes upcoming research.
2
Related Work
The simplest approach to dealing with multiple optimisation criteria is to han-dle each one in isolation. A solution is said to be Pareto-Efficient if it is not dominated by any other solution across all objectives. Pareto-Efficiency yields a partial ordering, with a set of maximal elements but no ordering between them.
The set of maximal elements delineates thePareto Front, as shown in Fig. 1.
Runtime (s)
Energy
(J)
[image:4.612.240.378.198.310.2]Pareto front Pareto-Optimal Pareto-Dominated
Fig. 1: Pareto-Efficiency
Pareto-Efficiency is useful when the relative importance of different requirements is unknown and the final choice of optimal solution can be deferred to the end user. For this reason it is often used by library developers who want their code to run efficiently in many different execution environments.
Balaprakash et al. use this approach to investigate the trade-offs between runtime and energy consumption for common kernels in scientific computing [2]. A similar technique has also been used to determine optimal checkpoint intervals for energy efficient fault tolerance [1].
A second MOO approach combines multiple objectives into a single scalar fitness function. This function then serves as a FoM metric for the overall utility of different solutions. Scalar fitness functions are in some sense fundamental to MOO; they can be used in isolation, but are also required by users choosing between solutions from a Pareto-efficient set.
Energy Delay Product was first proposed by Gonzalez et al. to measure the energy and runtime efficiency of microprocessors [9]. Martin et al. generalised this concept into theEtnfamily of FoM metrics, with parameters E and t corre-sponding to energy and time [17]. They argue thatEt2provides the best balance between the two optimisation objectives for microprocessor design. Srinivasan et al. reached the same conclusion, although for slightly different reasons [22].
Many authors have adopted these metrics originating from the hardware community and applied them to software optimisation problems. Vincent et al.
describe a technique which minimises Et1 using CPU throttling [8]. Bingham
and Greenstreet use Etn metrics to analyse runtime constraints imposed by a
balance between runtime and energy for high performance computing [16].Et1 has also been used extensively to quantify the efficiency of resource provisioning in a cloud computing environment [19,24].
Bekas and Curioni further generalised Etn metrics to the form E
·f(t), a product between energy and an application dependent function of time [3].
Another metric related to energy efficiency is FLOPS Per Watt, which relates the number of Floating Point Operations Per Second (FLOPS) and the rate of power consumption. Despite its name, this metric is quoted in units of Operations per Joule (1 Joule is defined as 1 Watt-Second). FLOPS/Watt measures how effective an application is at converting energy into floating point results.
UnlikeEtn, FLOPS/Watt does not measure application cost and hence
can-not be used as a fitness function. This is analogous to metrics like branch mis-prediction rate, which may inform optimisation attempts but are not measures of utility. Branch misprediction can be eliminated by disabling speculative exe-cution, but this does not result in better performance. Similarly, optimising for FLOPS/Watt may increase both runtime and energy consumption.
Heuristic models offer another source of optimisation guidance. Choi et al. proposed the Energy Roofline model to identify the algorithmic conditions needed for traoffs between runtime and energy [5]. Similarly, in previous work we de-veloped the Power Optimised Software Envelope model to assess the scope a code has for power optimisations on any given platform [18].
Some of our objections to existing metrics have been raised before, most
notably by Hsu et al. [14]. They point out that Etn and related metrics are
unfairly biased towards massive parallelism and argue that there is a need for the development of new metrics.
We believe our work is timely and interesting because it offers a rigorous assessment of energy-aware software optimisation metrics. We show the flaws in current approaches and propose novel metrics which can be used as fitness functions to guide energy-aware software optimisation. We believe this work will be useful to practitioners in this nascent area of performance engineering.
3
Foundations
In this section we provide formal definitions which underpin later discussions and outline the desirable properties an optimisation metric should exhibit. We begin by formalising the notion of a code as a repeatable sequence of instructions which, when executed by a processor, incurs energy and runtime costs.
Definition 1. All processors consume non-zero amounts of time and energy to
run programs. The cost of a codeθis the pair (Eθ, tθ)∈R+×R+ corresponding
to the energy and runtime costs incurred by running it on a given platform.
Definition 2. Codes can be composed by concatenating their instruction
se-quences. The composition of codes θandλyields the following cost:
The goal of energy-aware software optimisation is to minimise the runtime and energy costs of a given application. Energy-aware optimisation metrics are func-tions of energy and time which capture the utility of a code.
Definition 3. An energy-aware optimisation metric is an element-wise
mono-tonic function M which combines energy and runtime costs into a scalar FoM:
M: (E, t)∈R+×R+→R+
Element-wise monotonicity means that for all fixed E0, t0 ∈ R+, the functions M(E0, t)andM(E, t0)are monotonic. In other words, increasing one cost with-out a corresponding reduction in the other leads to a worse FoM.
Software optimisation can be modelled as a hill-climbing problem. Starting from
an initial codeθ, performance engineers make incremental changes and measure
their impact using a FoM metric. Changes which improve performance against this metric are kept while those which reduce it are discarded. Whether a given code change represents an optimisation depends on the metric chosen.
Definition 4. For logically equivalent codesθ andλ, the transformationθ→λ
is an optimisation with respect to metric M iffM(λ)strictly dominates M(θ).
By Definition 3, all valid metrics identify code changes which reduce both energy and time costs as optimisations. Similarly, all code changes leading to strictly worse performance will be disregarded. Energy-aware optimisation metrics only differ in cases where energy-time trade-offs are possible.
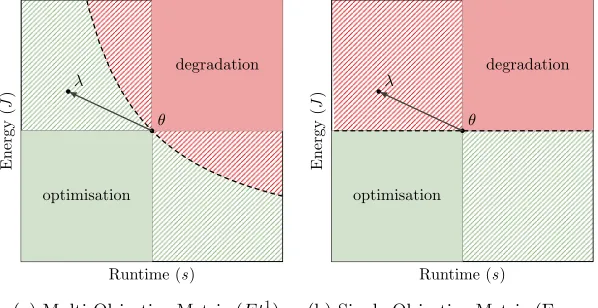
Fig. 2 shows how two valid metrics can disagree on whether the same code
change θ→λ is an optimisation. Lighter green areas correspond to
optimisa-tions and darker red areas to performance degradaoptimisa-tions. They are separated
by a dashed Isometric line that connects all points with FoM values equal to
M(θ). Both metrics agree on code changes in the solid shaded regions where
costs change in tandem. Energy-time trade-offs are represented by cross-hatched
quadrants. The MOO metric in Fig. 2a identifiesθ→λas a valid energy-time
trade-off, whereas Fig. 2b shows it is not an energy optimisation.
Energy-aware optimisation metrics ascribe a FoM to all (E, t) cost pairs.
Returning to the hill-climbing analogy, we say that an optimisation metric defines a fitness landscape over the energy/time plane. Fig. 3 shows how plots similar to Fig. 2 can be used to visualise the fitness landscape of a metric.
The isometric lines in Fig. 3 connect all points where the FoM is some multiple of a fixed value. Mathematically these lines represent level sets of ourMfunction; intuitively they are contours in our fitness landscape. The closeness of these lines corresponds to the gradient of the fitness landscape.
Isotopic lines run perpendicular to isometric lines, and correspond to the path of fastest decent (steepest gradient) within the fitness landscape. Mathe-matically, these lines are orthogonal trajectories of a metric function M. Con-ceptually, they show the direction in which a metric drives optimisation.
θ λ
optimisation
degradation
Runtime (s)
Energy
(
J
)
(a) Multi-Objective Metric (Et1)
θ λ
optimisation
degradation
Runtime (s)
Energy
(
J
)
[image:7.612.157.456.116.270.2](b) Single Objective Metric (Energy)
Fig. 2: Metric Optimisation Regions
The goal of an optimisation metric is to condense the utility of an application into a single, meaningful FoM. We have identified the following properties which an idealised optimisation metric should possess:
1. Bounded:A metric should bound regions of the optimisation space;
2. Directed:drive optimisation efforts in a sensible direction;
3. Additive:remain additive (linear) under code composition;
4. Stable:provide a stable definition of optimisation under code composition;
5. Tunable:be tunable to different application domains; and
6. Intuitive:correspond to a tangible and intuitive property of the system.
We explore these properties in more detail in the next section.
4
Et
nEvaluation
In the previous section we listed several desirable criteria for energy-aware op-timisation metrics. We now use these criteria to evaluate the suitability ofEtn metrics for guiding software optimisation.
4.1 Analysis of Etn
Bounded: Our first criteria states that energy-aware optimisation metrics should
bound regions of the optimisation space. By this we mean that a metric should place upper limits on how much energy or runtime can be consumed under a given FoM. This requirement is met if the isometric lines described by a metric intercept both the energy and runtime axes.
Runtime (s)
Energy
(
J
)
(a)Et1
Runtime (s)
Energy
(
J
)
[image:8.612.162.461.111.279.2](b)Et2
Fig. 3:Etn Metric Fitness Landscapes
flaw and assert that such changes should not count as optimisations. Another benefit of bounded metrics is that they limit the space in which to search for
optimisations; something whichEtn cannot do.
Directed: Our second criteria requires metrics to guide optimisation in sensible
directions. Intuitively, we wish to speed up slow codes and reduce the power
consumption of energy intensive ones. On the contrary,Etn disproportionately
rewards speeding up fast codes and saving energy in frugal ones. As energy
consumption increases, Etn gives higher priority to runtime optimisation and
vice versa. This fault was encountered by Hsu et al. when they noted thatEtn
metrics are unfairly biased towards massive parallelism in HPC systems [14]. Our first two criteria are linked. It is necessary (but not sufficient) for a metric to be bounded in order for it to guide optimisation in a sensible direction. The isometric lines of an unbounded metric never touch either axis, meaning the corresponding isotopic lines must intersect the axes at right angles. As the energy or time cost of a code approaches zero, the path of fastest decent therefore tends exclusively towards further reductions in this already close-to-zero cost.
Additive: Our third criteria states that FoM metrics should be additive under
code composition. Performance engineers focus their attention on expensive pro-cedures within a code. This involves profiling the code to identify areas causing poor performance, based on the assumption that the cost of a code is the sum of the costs of its constituent parts. While true for simple metrics like energy and time, this is not generally the case for compound metrics.
Definition 5. A metric is additive iff for code segments θ andλ:
Metric functions must be linear in terms of both time and energy in order to fulfil this requirement. This is not the case forEtn, where the cost of a code tends to be much greater than the costs of its constituent parts. Profilers cannot be relied upon to identify targets forEtnoptimisation. Furthermore, this additional
non-local cost depends on total application runtime and energy consumption. AnEtn FoM is therefore meaningless outside the context of a single fixed application.
Stable: Our fourth criteria requires metrics to provide a stable definition for
optimisation. If the same code change alters the cost of two applications by the
same amount, and it is an optimisation with respect to metricM for one of the
codes, then it should count as an optimisation for both of them.
Definition 6. A metric is stable iff for equivalent code segments λandλ0:
M(λ0)< M(λ) =⇒ M(θ◦λ0)< M(θ◦λ)
It is worth noting that linear metrics automatically fulfil this requirement. Linear metrics are inherently stable, however stable non-linear metrics also exist.
Etn is an unstable metric as it does not provide a consistent definition of
optimisation. Whether or not a code change counts as an optimisation under Etn is context sensitive. Code changes can be counted as optimisations only when evaluated in the context of the full application. Targeted optimisation of particular subroutines is impossible, and all past optimisations must be re-evaluated every time a change is made to the application.
This failure ofEtnis best illustrated with an example. Suppose an application contains a procedure which consumes 10 J over 10 s to produce some result. This
corresponds to an Et1 FoM of 10
×10 = 100. We then modify our procedure
to produce the same result in 11 J and 9 s. This is a valid optimisation because
although it increases energy consumption it reducesEtn to 11
×9 = 99.
Once the procedure completes we are given the option to output results at a cost of (5 J, 10 s). Our un-optimised application could execute its tasks and
output the results with an EDP of (10 + 5)×(10 + 10) = 300. The same
sequence of actions in the ‘optimised’ application results in a higher (worse)
EDP of (11 + 5)×(9 + 10) = 304. Under Etn, choosing to save the results of
our procedure retroactively invalidates our optimisation.
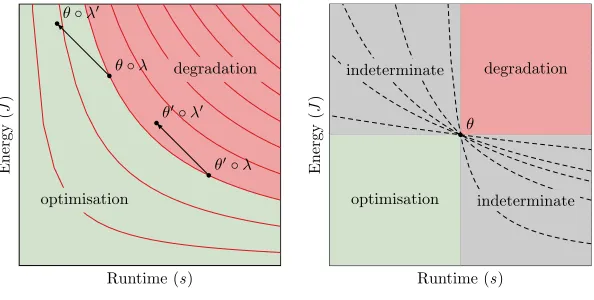
Fig. 4a shows how the same cost change applied to two codes with the same
starting Etn FoM may be considered either an optimisation or a performance
degradation. Furthermore, Fig. 4b shows how any energy-time trade-off can be made to appear as an optimisation or a performance degradation depending on the context. Different ratios ofEθandtθcan shift the optimisation/degradation boundary to any point within the indeterminate quadrants.
θ◦λ θ◦λ0
θ0◦λ
θ0◦λ0
optimisation
degradation
Runtime (s)
Energy
(
J
)
(a) Context Sensitive Optimisation
θ
optimisation
degradation
indeterminate indeterminate
Runtime (s)
Energy
(
J
)
[image:10.612.158.455.114.264.2](b) Indeterminate Optimisations
Fig. 4:Etn Optimisation Instability
optimisations which work at small scale will fail to improve the production ap-plication, signalling a discrepancy between the mini and production applications.
UsingEtnmetrics, however, optimisations to the mini-app may not count as
op-timisations to the production code even when they yield identical cost changes in both cases. This is further proof thatEtnmetrics are incompatible with modern performance engineering techniques.
Tunable: Our penultimate criteria is that it should be possible to tune a metric
to reflect the energy and time constraints of different domains. TheEtn metric meets this criteria via itsnparameter. This parameter sets the ‘exchange rate’ at which small changes in runtime and energy can be traded against each other. This can be shown by equating the partial derivatives ofEtnas shown in Equation 1:
∂ ∂E(Et
n) =tn and ∂
∂t(Et
n) =nEtn−1
tn·∂E=nEtn−1·∂t ∂E
E =n ∂t
t (1)
Intuitive: Our final and most subjective criteria is that a metric should be
intuitive. In practice, this means it should correspond to some tangible property of a system, ideally with values measured in meaningful units.Etndoes not meet this requirement.
we refer to as Pmax andPmin. Given thatPmin·t < E < Pmax·t, the growth rate of Etn is Θ(tn+1). The FoM cost of an additional second or Joule grows polynomially, hindering comparison between different scales.
4.2 Justification of Etn
The continued use ofEtn metrics despite their flaws is a testament to the need for standardised energy-aware optimisation metrics. In the absence of better alternatives, software engineers rely onEtnbecause of its popularity and relative
ease of use.Etn metrics remain the de-facto standard technique for combining
energy and runtime costs into a single FoM.
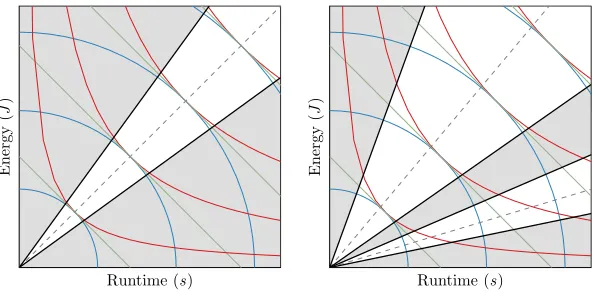
One factor which hides the problems withEtn metrics is the small range of
power consumption exhibited by modern hardware running HPC workloads as a result of high base power consumption and marginal differences under load [10].
Fig. 5a shows isometric lines for Et1 and our proposed metrics. It shows how
a small [Pmin, Pmax] range confines (Eθ, tθ) costs to a narrow envelope within the energy/time plane. This envelope limits the scope for divergence between different metrics. In the extreme case, whenPmin=Pmax,Eθis a scalar multiple
oftθand all energy-aware metrics become functions of time.
The scarcity of power-instrumented hardware means energy-aware optimi-sation is typically carried out at the level of individual nodes. Although single nodes exhibit narrow [Pmin, Pmax] ranges, multi-node and system-level power draw is much less constrained. Fig. 5b shows two performance envelopes, with
the larger having Pmin and Pmax values three times those of the smaller one.
This models the effect of running the same code on a single node and over three nodes in parallel. Similar discrepancies would occur when running code on al-ternative architectures with significantly differing power characteristics, such as GPUs and FPGAs, that are emerging as candidate platforms for improved
ef-ficiency [7]. Even at this small scale the discrepancies between Etn and other
metrics become readily apparent.
5
Proposed Metrics
In this section we propose two new FoM metrics for energy-aware software opti-misation. These metrics have slightly different properties and the choice of which to use is left to the performance engineer. That said, they both significantly
out-performEtn metrics according to our assessment criteria.
Our first metric is a weighted sum of energy and runtime costs. Our second metric measures the cost of an application in terms of Euclidean distance from an ‘optimal’ point at the energy/time origin. The fitness landscapes for both metrics are shown in Fig. 6a and Fig. 6b respectively.
5.1 Proposed Metric 1: Energy Delay Summation (EDS)
Runtime (s)
Energy
(
J
)
(a) Narrow Range Equivalence
Runtime (s)
Energy
(
J
)
[image:12.612.158.455.113.264.2](b) Discrepancies at Scale
Fig. 5: Power-Limited Isometric Lines
of electricity. Environmental impact and other concerns can also be included. Runtime also has a monetary cost – the purchase costs of the machine amortised
over its limited lifespan. Energy and runtime costs are captured by theαandβ
parameters in Equation 2.
M(θ) =αEθ+βtθ = (α, β)·(Eθ, tθ)
(2)
Bounded: Our first criteria requires metrics to bound regions of the energy/time
space. The isometric lines in Fig. 6a intercept both axes, satisfying this criteria. An EDS FoM therefore places upper limits on energy and runtime costs. The runtime contribution to a metric is maximised when energy is minimised and vice versa, allowing us to deduce cost limits under a given FoM:
M(θ) =α·Emax+β·0
∴ Emax= M(θ)
α
M(θ) =α·0 +β·tmax
∴ tmax= M(θ)
β
Performance engineers need not evaluate code changes with energy costs greater
than Emax, or runtime costs greater than tmax. This is in stark contrast to
the Etn case, where any given energy or runtime cost could be considered an
optimisation under the right circumstances.
Directed: Our second criteria requires metrics to guide optimisation in
Runtime (s)
Energy
(
J
)
(a) EDS
Runtime (s)
Energy
(
J
)
[image:13.612.157.457.112.279.2](b) EDD
Fig. 6: Proposed Metrics Fitness Landscapes
differentiate between these cases; the isotopic lines in Fig. 6a all run in parallel. Our metric still outperformsEtnin this regard however as it does not introduce perverse optimisation incentives.
Additive and Stable: Our third and fourth criteria require metrics to be
linear functions of time and energy and to provide stable definitions of
optimi-sation. The function αE+βtis linear in both parameters. Linear functions are
automatically stable; meaning this metric fulfils both criteria, providing stable definitions for optimisation and allowing for meaningful code profiling.
Tunable: Our penultimate criteria is that metrics be tunable to different
ap-plication domains. Different energy and runtime costs can be specified via theα andβ parameters. Unlike the exponential formulation of Etn, it is immediately apparent how different values will alter the balance between energy and runtime. A single scalar parameter would be enough to express any ratio of energy and time components. One property of this metric is that with appropriate tuning factors it can be used as a proxy for the monetary cost of running a code. This use-case is why we include two tuning parameters within this metric, to allow us to provide notional value results.
Intuitive: Our final criteria requires metrics to correspond to some meaningful
property of the system. Given appropriate coefficients this metric can report results in terms of monetary cost. Monetary cost has meaningful units, allows for fair comparisons to be made between different platforms and architectures, and is useful during procurement.
5.2 Proposed Metric 2: Energy Delay Distance (EDD)
Our first metric measured code performance in terms of separable energy and time costs. This definition fulfilled all but one of our criteria; as a linear function it was not able to direct the optimisation of codes according to their starting costs. Our second metric remedies this by defining the cost of a code as its distance from the most optimal point on our fitness landscape – the origin.
M(θ) =
q
Eθ2+ (βtθ) 2
EDD can also be expressed as the magnitude of a weighted cost vector:
M(θ) =k(Eθ, β·tθ)k
Bounded: The isometric lines in Fig. 6b follow semi-circular trajectories which
intercept the axes. This satisfies our first criteria, meaning this metric also limits
Emax andtmax for a given FoM. We can derive these limits as follows:
M(θ) =
q
Emax2+β·0
∴ Emax=M(θ)
M(θ) =
q
0 +β·tmax2
∴ tmax= M(θ)
β
Directed: The isometric lines for this metric form concentric ellipse segments
centred about the origin. As a result, the corresponding isotopic lines converge on the origin. Fig. 6b makes it clear that as a result this metric prioritises optimisations which minimise whichever cost is greater.
Additive: The formula for EDD is non-linear, meaning the overall FoM of a
code is not equivalent to the sum of its parts. This is an unavoidable consequence of being a directed metric, and means that EDD is not well suited for accurate
code profiling. UnlikeEtn, the discrepancy between the sum of component FoMs
and the overall code FoM for EDD is bounded. As EDD is defined in terms of vector magnitude it obeys the triangle inequality. As energy and time costs are always positive, we have:
p
M(θ)2+M(λ)2< M(θ◦λ)≤M(θ) +M(λ)
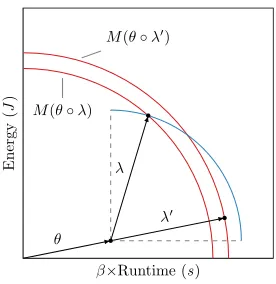
Stable: EDD does not meet our stability criteria. Fig. 7 shows a case where
M(λ0)< M(λ), yet M(θ◦λ0)> M(θ◦λ). The runtime axis is scaled so that isometric lines remain concentric for all values ofβ. That said, EDD instability is bounded byM(θ)+M(λ)−M(θ◦λ) as this metric obeys the following inequality:
θ λ
λ0 M(θ◦λ0)
M(θ◦λ)
β×Runtime (s)
Energy
(
J
[image:15.612.240.378.112.254.2])
Fig. 7: EDD Instability
Tunable: This metric is tunable via the β parameter. A single parameter is
sufficient to achieve any ratio of energy to runtime contribution.
Intuitive: This metric has a direct geometric interpretation as the Euclidean
distance to the origin. It does not treat energy and runtime as separate and distinct costs; in reality they are inseparable. In general, reducing the runtime of a code will also reduce its energy consumption. EDD defines the cost of a code in terms of how far away it is from being perfectly optimal.
6
Case Study
In this section we investigate the energy-efficiency characteristics of codes in the Mantevo [13] mini-application benchmark suite. Our results show that the issues
withEtn become more evident at larger scales.
We carried out our experiments on the Taurus system at TU Dresden, which is equipped with High Density Energy Efficiency Monitoring (HDEEM) instru-mentation [11]. Taurus is a heterogeneous cluster with several classes of node. This work was carried out on the largest of these classes, with each node featuring two 12-core Intel Xeon E5-2680 v3 CPUs and 64 GB of memory.
All codes were compiled with ICC version 15.0.3. Application parameters were based on default values, with problem sizes tuned where necessary to ensure reasonable run times on single nodes. Results were averaged over 5 runs to minimise the impact of random variations in runtime and energy.
We useEt3in these experiments because Laros et al. found that this strikes the right balance between runtime and energy for high performance computing [16]. This implies that a 1% reduction in runtime is approximately three times more valuable than the same reduction in energy consumption.
fashion, however, EDS and EDD parameters are based on absolute costs of
con-sumption. The power drawn by active Taurus nodes ranges between 207.68 W
and 345.33 W [18], meaning the magnitude of energy costs will be around 300
times greater than that of runtime. In order to compensate for this effect we scale the runtime cost by a factor of 300 before applying the 3:1 ratio, resulting
in the parametersα= 1 and β= 3×300 = 900.
In practice we would prefer to adopt a more fine-grained parameterisation which reflects real-world costs incurred by HPC systems. That said, exact cost figures are seldom made available in the public domain.
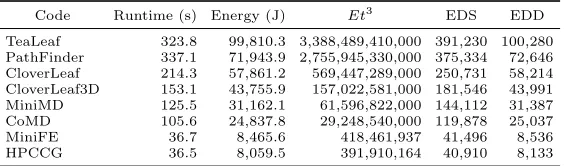
[image:16.612.168.452.271.354.2]For our first test we measured the runtime and energy consumption of various codes running on a single node. The results for this test are presented in Table 1.
Table 1: Single Node Code Costs
Code Runtime (s) Energy (J) Et3 EDS EDD
TeaLeaf 323.8 99,810.3 3,388,489,410,000 391,230 100,280 PathFinder 337.1 71,943.9 2,755,945,330,000 375,334 72,646 CloverLeaf 214.3 57,861.2 569,447,289,000 250,731 58,214 CloverLeaf3D 153.1 43,755.9 157,022,581,000 181,546 43,991 MiniMD 125.5 31,162.1 61,596,822,000 144,112 31,387 CoMD 105.6 24,837.8 29,248,540,000 119,878 25,037 MiniFE 36.7 8,465.6 418,461,937 41,496 8,536 HPCCG 36.5 8,059.5 391,910,164 40,910 8,133
The first thing to note is that Etn results rapidly become unwieldy even for
relatively short runtimes and low node counts. The runtime of HPCCG is around 11.4% that of TeaLeaf, and it also exhibits a slightly lower rate of power draw.
This translates to a four orders of magnitude difference in their Etn values.
Adding a single second to the runtime of TeaLeaf would further increase its
FoM by 8613 times the totalEtn of HPCCG.
Another thing to note is that despite large variations in values, all metrics assign the same efficiency ordering to these codes. As previously mentioned, the limits of single-node power draw limit the scope for metrics to disagree.
For our second test we measured the runtime and energy consumption of MiniMD running at scale. The results for this test are presented in Table 2.
These results show how biased Etn metrics are in favour of massive
paral-lelism. The efficiency of MiniMD according toEtn improves as the node count
increases to 18. It is only at the point when adding nodes delivers little or no reduction in runtime that this trend reverses.
EDS identifies 4 nodes as the optimal node count. This configuration delivers roughly twice the runtime performance of a single node at the cost of doubling the energy consumption. Adding nodes beyond this point results in energy costs increasing faster than runtime performance improves.
EDD identifies 1 node as the optimal node count. This corresponds to the intuition that parallelism introduces overhead. As the parallel overhead grows, so too does inefficiency as measured by this metric.
Et3 gives the impression that below-linear speed-ups coupled with
Table 2: MiniMD Multi-Node Costs
Nodes Runtime (s) Energy (J) Et3 EDS EDD
1 125.5 31,162.4 61,597,424,000 144,112 31,388 2 94.2 44,999.0 37,614,512,300 129,779 45,086 4 66.8 63,166.0 18,828,375,900 123,286 63,190 6 55.2 76,400.0 12,850,216,400 126,080 76,412 8 54.0 99,032.6 15,594,067,100 147,633 99,043 12 44.0 119,008.9 10,137,658,200 158,609 119,011 16 39.8 145,198.3 9,154,006,200 181,018 145,197 18 37.8 152,380.5 8,230,099,000 186,401 152,376 24 36.0 191,056.9 8,913,951,100 223,457 191,046 28 37.2 231,525.5 11,918,663,500 265,006 231,516 32 37.5 258,054.5 13,608,342,900 291,805 258,041 64 39.4 518,748.6 31,728,187,600 554,209 518,713 128 46.2 1,203,476.1 118,676,068,000 1,245,056 1,203,410
EDS and EDD metrics conform to a more conventional understanding of energy efficiency. They identify optimal configurations which can be justified intiutively.
7
Conclusion
In this paper we argue that the Etn family of metrics are not appropriate for
energy-aware software engineering. We propose alternative metrics which can be used to measure the cost of applications and guide their optimisation. Finally, we compare the performance of our metrics against established techniques by studying codes taken from the Mantevo mini-application suite.
We began by showing how Etn metrics are unable to provide meaningful
values for individual experiments, cannot be compared between experiments
and do not support optimisation efforts. Improving theEtn FoM of a section of
code can degrade overall performance.Etn metrics drive optimisation efforts in counterproductive directions, encouraging developers to speed up already fast code and seek energy efficiency gains in energy efficient codes. Finally, these
metrics provide no meaningful definition of an optimisation. In total, Etn was
able to fulfil only one of our seven criteria for software optimisation metrics.
We then proposed EDS and EDD, novel metrics which outperform Etn
against all of our assessment criteria. EDS is appropriate for measuring the cost of applications, while EDD is well suited to guiding application optimisa-tion. Both our metrics fulfil the majority of our criteria, and EDS fulfils the maximum number possible.
Our paper finishes with a study into the energy-efficiency costs of several
popular applications. This study shows how the flaws of Etn have managed
to remain hidden in small-scale optimisation studies. It also demonstrates that
these flaws will prevent Etn from being employed at scale. As a result, new
7.1 Future Work
The properties of our metrics makes them particularly well suited to compar-ing codes runncompar-ing at different scales and on different architectures. We intend to use EDS and EDD to investigate the power optimisation characteristics of various codes running on accelerator-based technologies. Our ultimate aim is to demonstrate how the correct metric can facilitate the discovery of energy-aware software optimisations. In our ongoing work we focus our search towards GPU and FPGA platforms as promising candidates for energy optimisation.
Acknowledgements
The authors would like to thank Thomas Ilsche and the Center of Information Services and High Performance Computing (ZIH) at TU Dresden. This research is funded in part by research grants from AWE, ATOS and Allinea. Professor Stephen Jarvis is an AWE William Penney Fellow.
References
1. Balaprakash, P., Gomez, L.A., Bouguerra, M., Wild, S.M., Cappello, F., Hov-land, P.D.: Analysis of the Tradeoffs Between Energy and Run Time for Multilevel Checkpointing. In: International Workshop on Performance Modeling, Benchmark-ing and Simulation of High Performance Computer Systems. pp. 249–263 (2014) 2. Balaprakash, P., Tiwari, A., Wild, S.M.: Multi Objective Optimization of HPC
Kernels for Performance, Power, and Energy. In: International Workshop on Per-formance Modeling, Benchmarking and Simulation of High PerPer-formance Computer Systems. pp. 239–260 (2013)
3. Bekas, C.and Curioni, A.: A New Energy Aware Performance Metric. Computer Science-Research and Development 25(3-4), 187–195 (2010)
4. Bingham, B.D., Greenstreet, M.R.: Computation with Energy-Time Trade-Offs: Models, Algorithms and Lower Bounds. In: IEEE International Symposium on Parallel and Distributed Processing with Applications. pp. 143–152 (2008) 5. Choi, J.W., Bedard, D., Fowler, R., Vuduc, R.: A Roofline Model of Energy. In:
Proceedings of the IEEE International Symposium on Parallel & Distributed Pro-cessing (IPDPS). pp. 661–672 (May 2013)
6. Esmaeilzadeh, H., Blem, E., St. Amant, R., Sankaralingam, K., Burger, D.: Dark Silicon and the End of Multicore Scaling. In: Proceedings of the International Symposium on Computer Architecture (ISCA). pp. 365–376. ACM, New York, NY (June 2011)
7. Fahmy, S.A., Vipin, K., Shreejith, S.: Virtualized FPGA accelerators for efficient cloud computing. In: Proceedings of the IEEE International Conference on Cloud Computing Technology and Science. pp. 430–435 (2015)
8. Freeh, V.W., Lowenthal, D.K., Pan, F., Kappiah, N., Springer, R., Rountree, B.L., Femal, M.E.: Analyzing the Energy-Time trade-off in High-Performance Comput-ing Applications. IEEE Transactions on Parallel and Distributed Systems 18(6), 835–848 (2007)
10. Hackenberg, D., Ilsche, T., Sch¨one, R., Molka, D., Schmidt, M., Nagel, W.E.: Power Measurement Techniques on Standard Compute Nodes: A Quantitative Compari-son. Proceedings of the IEEE International Symposium on Performance Analysis of Systems and Software (ISPASS) pp. 194–204 (March 2013)
11. Hackenberg, D., Ilsche, T., Schuchart, J., Sch¨one, R., Nagel, W.E., Simon, M., Georgiou, Y.: HDEEM: High Definition Energy Efficiency Monitoring. In: Energy Efficient Supercomputing Workshop (E2SC), 2014. pp. 1–10 (November 2014) 12. Harman, M. and Clark, J.: Metrics are Fitness Functions Too. In: Proceedings of
the International Symposium on Software Metrics. pp. 58–69 (September 2004) 13. Heroux, M.A., Doerfler, D.W., Crozier, P.S., Willenbring, J.M., Edwards, H.C.,
Williams, A., Rajan, M., Keiter, E.R., Thornquist, H.K., Numrich, R.W.: Improv-ing Performance via Mini-Applications. SNL Tech. Rep SAND2009-5574 (2009) 14. Hsu, C.H., Feng, W.C., Archuleta, J.S.: Towards Efficient Supercomputing: A
Quest for the Right Metric. In: Proceedings of the IEEE International Parallel and Distributed Processing Symposium (2005)
15. Kurd, N., Chowdhury, M., Burton, E., Thomas, T.P., Mozak, C., Boswell, B., Lal, M., Deval, A., Douglas, J., Elassal, M., Nalamalpu, A., Wilson, T.M., Merten, M., Chennupaty, S., Gomes, W., Kumar, R.: 5.9 Haswell: A Family of IA 22nm Pro-cessors. In: IEEE International Solid-State Circuits Conference Digest of Technical Papers (ISSCC). pp. 112–113. IEEE (February 2014)
16. Laros, J. H. and Pedretti, K. and Kelly, S. M. and Shu, Wei and Ferreira, K. and Vandyke, J. and Vaughan, C.: Energy delay product. In: Energy-Efficient High Performance Computing: Measurement and Tuning, pp. 51–55. Springer (2013) 17. Martin, A.J., Nystr¨om, M., P´enzes, P.:ET2: A Metric for Time and Energy
Effi-ciency of Computation. In: Power Aware Computing, pp. 293–315. Springer (2002) 18. Roberts, S., Wright, S., Lecomber, D., January, C., Byrd, J., Or´o, X., Jarvis, S.: POSE: A Mathematical and Visual Modelling Tool to Guide Energy Aware Code Optimisation. In: Proceedings of the 6th International Green and Sustainable Computing Conference (IGSC ’15) (December 2015)
19. Rodero, I., Viswanathan, H., Lee, E.K., Gamell, M., Pompili, D., Parashar, M.: Energy-Efficient Thermal-Aware Autonomic Management of Virtualized HPC Cloud Infrastructure. Journal of Grid Computing 10(3), 447–473 (2012)
20. Shalf, J., Dosanjh, S., Morrison, J.: Exascale Computing Technology Challenges. In: High Performance Computing for Computational Science (VECPAR 2010), LNCS, vol. 6449, pp. 1–25. Springer Berlin Heidelberg (June 2011)
21. Shao, Y.S., Brooks, D.: Energy Characterization and Instruction-Level Energy Model of Intel’s Xeon Phi Processor. In: Proceedings of the IEEE Interna-tional Symposium on Low Power Electronics and Design (ISLPED). pp. 389–394 (September 2013)
22. Srinivasan, V., Brooks, D., Gschwind, M., Bose, P., Zyuban, V., Strenski, P.N., Emma, P.G.: Optimizing Pipelines for Power and Performance. In: Proceedings of the International Symposium on Microarchitecture (MICRO). pp. 333–344 (2002) 23. Sutter, H.: The Free Lunch is Over: A Fundamental Turn Toward Concurrency in
Software. Dr. Dobb’s Journal 30(3), 202–210 (March 2005)