University of Warwick institutional repository: http://go.warwick.ac.uk/wrap
A Thesis Submitted for the Degree of PhD at the University of Warwick
http://go.warwick.ac.uk/wrap/65033
This thesis is made available online and is protected by original copyright. Please scroll down to view the document itself.
i
INVESTIGATING THE POTENTIAL USE OF VIRUS TECHNOLOGY TO
FURTHER OUR UNDERSTANDING OF FLORAL INDUCTION AND ITS
APPLICATION IN PLANT BREEDING PROGRAMMES.
by
Akande Femi David
A thesis submitted to
The University of Warwick for the degree of
DOCTOR OF PHILOSOPHY
The University of Warwick, School of Life Sciences
March 2014
ii
Table of contents
Page
List of figures---vii-ix
Acknowledgements---x
Declaration--- xi
Summary---xii
Abbreviations--- xiii- xv Chapter 1: General Introduction ---1
1.1The regulation of flowering 1.1.1 Pathways involved in the promotion of flowering---2-5 1.1.1.1The Photoperiodic Pathway--- 6-8 1.1.1.2The microRNA Pathways---9
1.1.1.3 Ambient Temperature and Light Quality Pathway---10
1.1.1.4The Vernalization Pathway---11-12 1.1.1.5The Gibberellin Pathway ---13
1.1.1.6The Autonomous Pathway ---14
1.1.1.7Floral integrators---15
1.2 Florigen –The flowering time regulator FT---15
1.2.1 The Florigen hypothesis---15
1.2.2 The physiology of FT protein and its homologues ---16
1.2.3 Conservation of Arabidopsis flowering genes in crop species---16-18
iii
1.3 Utilization of Plant virus-based toolbox to investigate protein function and---21
RNA movement 1.3.1 Potato Virus X (PVX)andPVX-based viral expression system--- 21-22 1.4 Project aims and Objectives ---22
Chapter 2 : General materials and methods---23
2.1 General materials 2.1.1 Plant materials---24
2.1.2 Bacteria material and media---24
2.1.3 Plant virus –based vectors---25
2.2 General methods 2.2.1 Plant inoculation with Tissue Sap---26
2.2.2 Plant growing conditions---26
2.2.3 Tissue culturing and Shoot induction media ---26
2.2.4 Tissue culture of potato and tobacco plants ---27
2.2.5 Seed Sowing (Filter paper and Soil)---27
2.2.6 High fidelity KOD-PCR ---27-28 2.2.7 Purification of PCR products from gels ---28
2.2.8 Reverse transcriptase PCR (RT-PCR)---28-29 2.2.9 Digestion of KOD –PCR products with restriction endonucleases---30
2.2.10 Preparation of cloning vectors---30
iv
2.2.12 Transformation of E.coli (EC100) by electroporation---31
2.2.13 DNA transformation of Agrobacterium tumefaciens---32
2.2.14 Tobacco Leaf disc transformation---32-33 2.2.15 Colony PCR screening---34
2.2.16 Extraction of plasmid DNA---34
2.2.17 Quantification of RNA and DNA samples---34
2.2.18 DNA sequencing---34-35 2.2.19 Linearization and extraction of recombinant plant virus vectors---35
2.2.20 In vitro transcription for synthesis of infectious recombinant viral RNAs ---35
2.2.21 Plant inoculation and maintenance---35
2.2.22 RNA extraction from plant leaves---35
2.2.23 Software Tools---36
Chapter 3 : The Expression of FT, fused FT and FT orthologues in plants---38
3.1 Introduction---38-39 3.2 Materials and Methods---40
3.2.1 In vitro transcription and inoculation of N. benthamiana---40
3.2.2 Virus-based flowering assay ---41
3.3 Experimental Results and Discussion
3.3.1 Construction of RNA mobility Assay (RMA) vectors---41-42
3.3.2 Expression of Arabidopsis FT in Maryland Mammoth tobacco---43-45
v
3.3.3 Expression of ArabidopsisFT in potato under non-inductive LD condition---46-47
3.3.4 Expression of ArabidopsisFT and FT orthologues in tomato---48-52 3.3.4.1 Effect of ArabidopsisFT and FT orthologues on lateral side shoot ---53-54 development in tomato
3.3.5 Expression of ArabidopsisFT in brassica---55-61
Chapter 4: The Expression and Functionality of tagged FT---62
4.1 Introduction---63-64
4.2 Experimental results and Discussion ---64
4.2.1 Expression of tagged ArabidopsisFT in Maryland Mammoth---65-72
tobacco under non-inductive LD condition.
Chapter 5: Coat protein transgenic plant complementation of---73
Movement deficient virus
5.1 Introduction---74-76
5.2 Materials and Methods---77
5.2.1 Gateway cloning of CP gene into binary vector and transformation of ---78-79
Agrobacterium tumefaciens
5.2.2 Tobacco transformation and Homozygosity test---79-80
5.3 Results and Discussion---81
5.3.1 Does the virally- expressed Arabidopsis FT and coat protein RNA get ---81-84 transmitted into the germline/seeds of inoculated plants?
5.3.2 Expression of ArabidopsisFT and PVX/FTΔCP in CP transgenic Maryland---85-91 Mammoth- tobacco (CP.MM) under non-inductive LD condition.
vi
6.1 General Discussion ---93
6.1.1 FT, a mobile floral stimulus---93
6.1.2 FT mRNA acts as a long–distance mobile molecule ---93-94
6.1.3 FT plays different roles in plant growth and development---94-95 6.1.4 Potential Commercial application of plant virus vector systems---95-96
6.2. Further work---96-97
References ---98-113
Appendix 1 ---114-115
Appendix II---116-119
VII
List of Figures
Chapter 1
Fig.1.1 : Circadian expression of key components in floral regulation---4
Fig.1.2 : The main pathways involved in the control of flowering in Arabidopsis thaliana---5
Fig. 1.3 : A schematic diagram of the photoperiodic pathway in Arabidopsis thaliana---8
Fig. 1.4 : A schematic diagram of the microRNA pathway in Arabidopsis thaliana---9
Fig. 1.5 : A schematic diagram of the Light quality pathway in Arabidopsis thaliana---10
Fig. 1.6: A schematic diagram of the Vernalization pathway in Arabidopsis thaliana----12
Fig. 1.7 : A schematic diagram of the Gibberellin pathway in Arabidopsis thaliana---13
Fig. 1.8: A schematic diagram of the Autonomous pathway---14
Fig. 1.9: A schematic representation of the constructs used for experiment---19
Fig. 1.10: The role FT in long-distance transport and flowering induction---20
Chapter 2 Fig.2.1 : A schematic representation of the plasmid vector (PVX)---25
Fig 2.2: Tobacco leaf disc transformation---33
Chapter 3 Fig. 3.1: PVX/FT infected N. benthamiana plant exhibiting viral infection symptoms---41
Fig. 3.2: PCR amplification of DNA---43
Fig.3.3 : A schematic representation of the expression constructs---43
VIII
Fig. 3.5: Young SD N. tabacum Maryland Mammothplants at 23 days post inoculation-45
Fig. 3.6: N. tabacum Maryland Mammoth plants 44 days post inoculation---45
Fig. 3.7: The average stem length (cm) for each test plant group 44 days post inoculation-46 Fig. 3.8: Young potato plants---47
Fig. 3.9 : RT-PCR detection of Arabidopsis FT RNA in potato tissue samples---47
Fig. 3.10: Underground parts of Andigena 7540---48
Fig.3.11: 14 days post inoculated young Ailsa Craigtomato plants---50
Fig. 3.12: RT-PCR detection of Arabidopsis FT, mFT , FT C4 and FT-FLAG and SP6 50-51 RNA Fig.3.13: Effect of expression of FT and FT orthologues on tomato---52-53 Fig. 3.14: Effect of FT and FT orthologues on tomato lateral side shoot development---55
Fig.3.15: Arabidopsis FT RNA in Brassica oleracea var.italica young leaf tissue samples-56 Fig. 3.16: Brassica oleracea var.italica Marathon at 94 days post inoculation---57
Fig. 3.17: The phylogenetic relationship of FT orthologues---59
Fig. 3.18: Brassica oleracea var.italica at 66, 90 and 115 days days post inoculation---60
Fig. 3.19:RT-PCR detection of virally expressed FT genes in Brassica ---61
young leaf tissue samples Chapter 4 Fig. 4.1: Schematic representation of designed expression constructs ---66
Fig. 4.2: 9 days post inoculated young N. tabacum Maryland Mammoth plants---67
Fig. 4.3: 21 days post inoculated young N. tabacum Maryland Mammothplants---68
Fig. 4.4: RT-PCR detection of virally expressed Arabidopsis FT, ---69
FT-His, His-FT and FT -FLAG RNA. Fig. 4.5: 52 days post inoculated N. tabacum Maryland Mammothplants---70
IX Chapter 5
Fig. 5.1: Anoverview of the cloning of CP into 35S vector via Gateway cloning---79
Fig. 5.2: Gene construct: PB2GW-35S-CP used for Agrobacterium–mediated ---80
Transformation of tobacco Fig. 5.3: Tobacco Homozygosity test---81
Fig. 5.4: RT-PCR detection of virally expressed Arabidopsis FT RNA in systemic leaf- 82 tissue samples. Fig. 5.5: 70 days post germination. PVX/FT harvested seed (grown plant) and control---84
(mock) plant. Fig. 5.6: The mean leaf number of PVX/FT harvested seed (grown plant) and control----85
(mock) plant. Fig. 5.7: RT-PCR detection of CP transgene in young leaf tissue samples---87
Fig.5.8: 21 days post inoculation of CP. MM plants---87
Fig. 5.9: RT-PCR detection of virally expressed Arabidopsis---87
Fig. 5.10: 65 days post inoculation of CP.MM plants---88
Fig.5.11: Repeat experiment - 9 days post inoculation of CP. MM plants---89
Fig. 5.12: 18 days post inoculation of CP. MM plants---90
Fig. 5.13:RT-PCR detection of virally expressed Arabidopsis FT and---90
X Acknowledgements
A special thanks to my supervisor Dr Stephen Jackson and Prof Yiguo Hong for giving me the privilege to undertake this project. I would also like to thank them for their professional guidance throughout the duration of my research. A vote of thanks to my fellow laboratory colleagues at the University of Warwick especially Jemma, Tiziana, Piyatida, Andrea, Sarah and John.
I would also like to thank Laura, my parents and brothers for their unconditional love and encouragement.
Finally I would like to thank God for his help and support.
XI
Declaration
This thesis is the result of my own work which was performed during the period of my PhD registration. None of this work has been presented for another degree.
XII
Summary
Flowering Locus T (FT )plays a pivotal role in floral induction. It integrates the inputs from a complex network of flowering signalling pathways. Flowering is an efficiently orchestrated event that occurs in a plant at a particular time to ensure maximum reproductive success. It has been suggested that the FT protein is a long- distance mobile floral stimulus. In this report studies with a mutant version of FT (mFT) which had the start codon replaced with a stop codon to generate a non-translatable FT indicated that the mRNA was also capable of long distance movement although its physiological function as a floral stimulus was inhibited.
Gene function study of FT and FT orthologues on brassica, tobacco, tomato and potato using the plant virus expression vector Potato Virus X (PVX) generated some interesting findings. In Short day Maryland Mammoth tobacco plants the overexpression of the
Arabidopsis FT under non-inductive Long day condition induced early flowering while the
mFT and mock control remained in the vegetative stage. In short day potato, it did not seem to have an effect on tuberization as only one from five of the inoculated plants tuberized. In brassica (broccoli) the effect on flowering time was inhibited due to Virus-induced Gene Silencing (VIGS) but the tomato FT (SP6A) had an effect on flowering time.
XIII
Abbreviations
Aa Amino acid AP1 APETALA 1 bp Base pair
CCA1 CIRCADIAN CLOCK ASSOCIATED 1 CCs Companion cells
cDNA Complementary deoxyribonucleic acid cm Centimetre
CO CONSTANS Col Columbia CP Coat protein DTT Dithiothreitol CRY Cryptochromes DNA Deoxyribonucleic acid
dNTP Deoxyribonucleotide triphospahte dpi Days post –inoculation
dsDNA Double-stranded DNA dsRNA Double-stranded RNA
EDTA ethylenediaminetetraacetic acid EF1 Elongation factor 1 alpha FD Flowering Locus D FLC Flowering Locus C FT Flowering Locus T FUL Fruitful
XIV g Relative centrifuge force
GFP Green Fluorescent Protein GI Gigantea
GUS β-glucuronidase HD1 Heading date 1 Hd3a Heading date 3a LB Luria-Bertani LD Long days LFY LEAFY M Molar
MFT MOTHER OF FT and TFL1 MM Maryland Mammoth MgCl2 Magnesium Chloride
Mins Minutes
MiR156 MicroRNA 156 MiR159 MicroRNA 159 MiR172 MicroRNA 172 MiRNAs MicroRNA mM Milimolar
NaCl Sodium chloride ORF Open reading Frame PCR Polymerase chain reaction
PEBP Phosphatidylethanolamine binding protein PHY Phytochromes
PVX Potato virus X
RdRP RNA- dependent RNA Polymerase R Red light
XV RMA RNA Mobility Assay
RNA ribonucleic acid rpm revolutions per minute s seconds
SAM Shoot Apical Meristem SD Short Days
SEs Sieve Elements
SFT SINGLE-FLOWER TRUSS
SOC1 SUPPRESSOR OF OVEREXPRESSION OF CONSTANS 1 SP SELF PRUNING
SPEC spectinomycin
TSF TWIN SISTER OF FT VIGS Virus-induced Gene Silencing Vir Virulence
1
Chapter 1
2
Chapter 1: General Introduction
1.1The regulation of flowering
Flowering is the transition of a plant from the vegetative to the reproductive phase and is one of the major phase changes during a plant’s life cycle. It has been established that multiple interconnected signalling pathways are involved in the regulation of flowering times in response to environmental and endogenous factors (Bernier et al., 2005). Flowering is influenced by seven distinct pathways. These are the photoperiodic, autonomous, vernalization, GA, light quality, ambient temperature and microRNA pathways (Wigge 2011) ; Aukerman et al., 2003). The majority of these pathways are integrated by the floral integrator gene FLOWERING LOCUS T (FT) which is a key inducer of flowering. The FT protein has been shown to be a component of the mobile florigen and it is important in inducing flowering in many plant species (Wigge 2011). Movement of the FT protein has been well researched and documented in recent years. The accepted theory for the induction of flowering is that after induction of FT gene expression by CONSTANS (CO) protein in the leaf, the FT protein moves from the leaf to the shoot apical meristem (SAM) via the phloem and induces flowering (Corbesier et al., 2007).
3
SUPRESSOR OF PHYA-105- 1 (SPA1), SPA3 and SPA4 (Fig1.1b).FT mRNA transcription
is induced by the direct accumulation of CO protein and regulation of FT by CO has been suggested to occur through an interaction of CO and the CCAAT-box binding protein factor with the 5’ UTR region of FT (Ben-Naim et al., 2006).
FT protein moves through the phloem’s sieve plates and sieve elements and on getting to the cells within the SAM, FT protein interacts with the FD bZIP transcription factor forming a complex which results in direct upregulation of SOC1 mRNA (Corbesier et al., 2007); (Jackson 2009; Wigge et al., 2005; Wigge 2011). The SOC1 protein forms a complex with AGAMOUS-LIKE 24 (AGL24) which translocates to the nucleus where it binds the LFY
4
CO mRNA
SD SD
SD
LD LD
LD CO protein
FT mRNA
LD SD
LD SD
LD SD
PhyB PhyA
Cry1
Cry2
SPA1
SPA3
SPA4
A B
[image:20.595.86.570.99.593.2]C
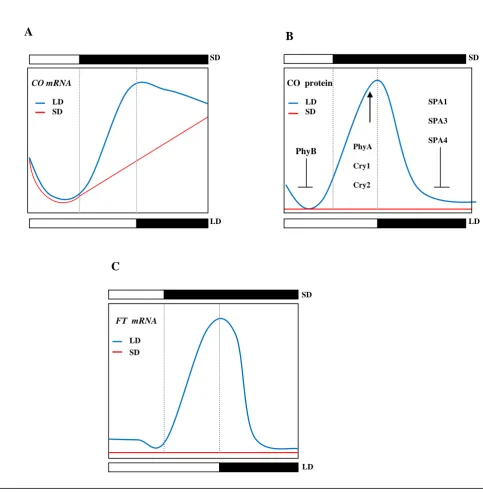
Fig 1.1 Circadian expression of key components in floral regulation. (a) CO mRNA expression exhibits a biphasic curve pattern under
LDs. (b) Accumulated CO protein is dependent on both mRNA expression and light. Quantitative level of CO protein is stabilized by
CRY1, CRY2 and PhyA towards the end of LDs. It is negatively regulated by PhyB in the early morning and at night CO degradation
is mediated by the presence of SPA1, SPA3 and SPA4. This also counteracts early peak in CO which could have been caused by high
CO mRNA levels towards the end of the night. (c) FT mRNA expression under LDs is triggered by the direct action of accumulated
CO protein. FT mRNA / FT protein move from the leaf to the shoot apical meristem (SAM) through the phloem’s sieve plates and
sieve elements. At the SAM the FT protein interacts with the FD bZIP transcription factor forming a complex which results in the
direct upregulation of SUPPRESSOR OF CONSTANS 1 (SOC1) mRNA. SOC1 in turn forms a complex with AGAMOUS-LIKE 24
(AGL24) which translocates to the nucleus where it binds the LEAFY (LFY) promoter to induce LFY expression which ultimately
5
1.1.1 Pathways involved in the promotion and regulation of flowering
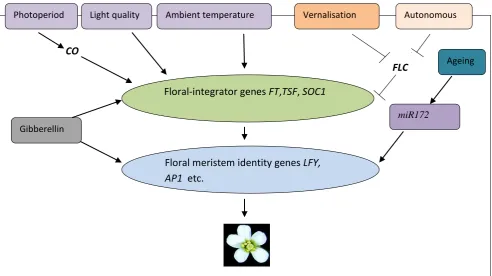
The transition to the reproductive phase in plants is regulated by an interconnected network of signalling pathways. In the model plant Arabidopsis thaliana many molecular and genetic approaches have been applied to study pathways involved in the regulation of flowering (Boss et al., 2004). The pathways involved in flowering regulation are shown in
Fig 1.2 below. The key genes involved in these pathways include FT, FLOWERING LOCUS
C (FLC), CONSTANTS (CO), GIGANTEA (GI), LEAFY (LFY), F-BOX PROTEIN1 (FKF1), TERMINAL FLOWER1 (TFL1), FRUITFUL(FUL), SUPPRESSOR OF OVEREXPRESSION OF CONSTANS1 (SOC1), LATE ELONGATED HYPOCOTYL (LHY), CIRCADIAN CLOCK ASSOCIATED 1(CCA1), GIBBERELLIN INSENISTIVE DWARF 1(GIDI), TWIN SISTER OF FT (TSF) and APETALA1 (AP1 ) (Wigge 2011; Hirano et al., 2008; Turck et al., 2008).
FLC plays a pivotal role in the regulation of flowering (Yant et al., 2009). The repression of FLC by the vernalization and autonomous pathways promote flowering by relieving the inhibition of FT and SOC1 by FLC (Lee et al., 2010; Moon et al., 2005). The flowering network pathway acts as a complex control system in the sense that the repressor and integrator genes coordinate the flowering response to changes in both endogenous and environmental cue (Boss et al., 2004).
Photoperiod Light quality Ambient temperature Vernalisation Autonomous
Floral-integrator genes FT,TSF, SOC1
Floral meristem identity genes LFY, AP1 etc.
[image:21.595.52.545.478.754.2]FLC CO
Fig 1.2 The main pathways involved in the control of flowering in Arabidopsis thaliana. Arrows indicate activation and T-bars represents inhibition. CO represents CONSTANS, GI represents Gigantea, FT represents FLOWERING LOCUS T, TSF represents TWIN SISTER OF FT, SOC1 represents SUPPRESSOR OF OVEREXPRESSION OF CONSTANS1, LFY represents LEAFY, AP1 represents APETALA1, miR172 represents microRNA172 and FLC represents
FLOWERING LOCUSC. Gibberellin
miR172
6
1.1.1.1 The Photoperiodic Pathway
The photoperiodic control of floral induction is important because the perception of changes in day length is the major way for plants to sense the ever changing season.
Arabidopsis thaliana shows a strong photoperiodic response in the onset of flowering. Flowering occurs much earlier under LD of 16h light than under SD of 10hr (Searle et al., 2004). In the model plant Arabidopsis thaliana, numerous flowering regulators involved in the photoperiodic pathways have been identified. They include ZEITLUPE (ZTL) which is a blue light receptor, the red and far-red light absorbing phytochromes (PHYA-E), UV/ blue light absorbing cryptochromes (CRY1,2) and components of the circadian clock which include LHY, CCA1, TOC1, GI. Key regulatory factors include FT, CO, TSF, FKF1, CDF1, FWA and DAY NEUTRAL FLOWERING (DNF) (Morris et al., 2010); (Thornber et al., 2006); (Jackson 2009; Mockler et al., 2003; Mas et al., 2009). The photoperiodic pathway is initiated in the leaves with the perception of light by the red/far-red light-receptors phytochromes (PHYA-E) and the blue/UV-A light receptors cryptochromes (CRY1 and 2) (Clack et al., 1994; Lin et al., 2005; Quail 2002). These photoreceptors are involved in mediating light input to the circadian clock (Guo et al., 1998). Photoreceptors interact to entrain the circadian clock to a 24h period. In plants, the circadian clock regulates a diverse range of biological processes and it is the plant’s endogenous time keeper (Halliday et al., 2003). Several genes have been identified as components of the circadian clock and they show high levels of similarity and functional redundancy (Nakamichi 2011). PHYB binds to PHYTOCHROME-INTERACTING FACTOR 3 (PIF3) and causes the up-regulation of both CCA1 and LHY expression which peak early in the morning shortly after dawn. ZTL interacts with TOC1 by targeting the protein for degradation via the 26S proteosome (Mas
et al., 2003).
The clock regulates CO transcription positively through the GI/FKF1 complex which promotes the degradation of the repressor CDF1. CDF1 down regulates the expression of
CO by binding to its promoter region (Imaizumi et al., 2003). The transcription level of GI
and FKF1 peaks much later in the day which leads to the degradation of CDF1 at that time of the day thus allowing the induction of CO transcription towards the end of a LD(Sawa
7
CO is stabilized by blue and far red light through PHYA and CRY1/2 and the accumulation of CO protein induces the transcription of floral integrator gene FT (Samach et al., 2000; Turck
et al., 2008; Cerdan et al., 2003; Suarez-Lopez et al., 2001; Valverde et al., 2004). Regulation of FT by CO has been suggested to occur through an interaction of CO and the CCAAT-box binding protein factor with the 5’ UTR region of FT (Ben-Naim et al., 2006).
8
PHYB
CO
CRY2
LHY/CCAI
TOC1 1 Degradation
FKF1
GI
CDF1
FT SOC1
[image:24.595.48.539.66.719.2]Floral Meristem identity
Genes
Fig 1.3 A schematic diagram of the photoperiodic pathway in Arabidopsis thaliana. Arrows indicate activation and T-bars represents inhibition.CRY2 represents cryptochrome 2, PIF3 represents PHYTOCHROME-INTERACTING FACTOR 3,PHY represents Phytochromes,CCAI represents CIRCADIAN CLOCK ASSOCIATED 1, LHY represents LEAFY, TOC1 represents
TIMING OF CAB EXPRESSION 1, FKF1 represents F-Box protein 1,CDF1 represents Cycling DOF factor 1, ZTL represents ZEITLUPE, SOC1 represents SUPPRESSOR OF OVEREXPRESSION OF CONSTANS1, FT represents FLOWERING LOCUS T
and GI represents Gigantea.
ZTL
PHYA
PIF3
+
9
1.1.1.2 microRNA pathways affecting flowering
It has recently been discovered that miRNAs play an important role in developmental transition. MicroRNAs are non- coding endogenous small RNAs that have a role in the regulation of flowering (Bartel 2004). The transition from juvenile to adult phase is mediated by miR156 with decreasing quantitative levels over time (Fig 1.4). miR156 is also involved in the down-regulation of SPL expression in the phloem companion cells which ultimately causes a repression of flowering (Fornara et al., 2009; Jung et al., 2009). The SPL family members SPL3, SPL4 and SPL5 directly induce the expression of floral promoters LFY, FUL, AP1 (Yamaguchi et al., 2009).SPL9 and SPL10 regulate flowering by inducing the transcription of miR172 (Wu et al., 2009). miR172 mediates the expression of AP2-like genes such as TOE1, TOE2, SCHNARCHZAPFEN (SNZ) which in turn represses FT (Aukerman et al., 2003;Jung et al., 2007; Zhu et al., 2011; Jarillo et al., 2011).
Age
miR156
SPLs
FUL AP1 LFY SOC1
SPL9 SPL10
miR172
GI
SNZ TOE1 TOE2 TOE3 AP2
[image:25.595.63.535.350.690.2]FT
10
1.1.1.3The Ambient Temperature and Light quality Pathway
Temperature is one of the most important factors affecting plant growth and development. Temperature also plays a vital role in the induction of flowering. Studies have shown that higher temperature triggers early flowering in Arabidopsis via inactivation of the
FLOWERING LOCUS M (FLM) gene, the FLM protein represses FT activity (Balasubramanian et al., 2006).
Light quality is another important factor affecting plant growth and development. Plants can detect changes in R/FR ratio and adequately respond by altering their developmental process. To date, Five types of photoreceptors have been identified in plants they include; Zeitlupe/FKF1/LKP2 photoreceptors, blue light absorbing cryptochromes (CRYs), R/FR light absorbing phytochromes (PHYs) and phototrophins (PHOTs) and the UV photoreceptor UVR8 (Onodera et al., 2005). Light quality can affect FT expression in a CO-independent manner (Cerdan et al., 2003). At a low R/FR ratio, PHYTOCHROME
AND FLOWERING TIME 1 (PFT1) induces the expression of FT and promotes flowering
while at a high R/FR ratio its action is repressed by PHYB (Fig 1.5).
PHYB
PFT1
FT
[image:26.595.109.452.445.674.2]R:FR
11
1.1.1.4 The Vernalization Pathway
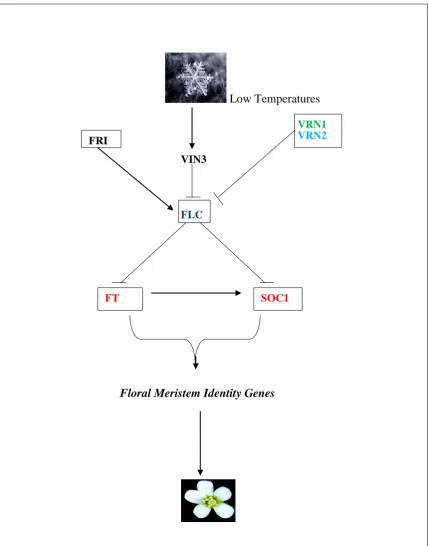
During extended cold periods e.g. winter, some plants adapt their growth habits to ensure maximal reproductive success (Massiah et al., 2007; Kim et al., 2009). A vernalisation period can range from as little as four weeks to several months with temperatures ranging between 4-8oC. It has been documented that some plants do require vernalization for early flowering. Various genes are known to exhibit changes in their expression levels during vernalization (Michaels et al., 2000). The two key genes involved in this process are
FRIGIDA(FRI ) and FLC (Fig 1.6).
FLC encodes a MADS-box domain transcription factor. It inhibits flowering by repressing
FT, FLOWERING LOCUS D (FD) and SOC1 (Boss et al., 2004;Searle et al., 2006; Kim et al., 2009). FRI inhibits flowering by inducing the expression of FLC. VERNALIZATION INSENSITIVE 3 (VIN3) which is expressed after a cold treatment represses the expression of FLC mRNA by causing a histone modification of FLC chromatin (Boss et al., 2004; Kim
et al., 2009; (Sung et al., 2004; Geraldo et al., 2009; Kim et al., 2009).
12
Low Temperatures
VIN3
FLC FRI
FT
VRN1 VRN2
SOC1
[image:28.595.79.508.83.630.2]Floral Meristem Identity Genes
Fig 1.6 A schematic diagram of the Vernalizationpathway in Arabidopsis thaliana. Arrows indicate activation and T-bars represents inhibition. FRI represents FRIGIDA,VIN3 represents VERNALIZATION INSENSITIVE 3, FLC
13
1.1.1.5The Gibberellin Pathway
Gibberellins are classified as plant hormones. GA promotes flowering in Arabidopsis. It also plays a role in cell elongation and seed germination. Previous studies showed that
Arabidopsis mutants defective in either GA biosynthesis or signalling exhibited delayed flowering under SD (Blazquez et al., 1998; Wilson et al., 1992). Other studies showed that plants which overexpressed GA-20 oxidase flowered early in both LD and SDs (Huang et al., 1998; Coles et al., 1999). These findings buttressed the theory of the role of GAs in inducing flowering. GAs promotes flowering via indirect activation of SOC1 and LFY (Lee
et al., 2010; Gocal et al., 2001) (Fig 1.7).
In addition it is also involved in the indirect repression of miRI59 expression via down-regulation of DELLA protein levels (Fig 1.7). The repression and down down-regulation of
miR159/DELLA protein levels ultimately promotes flowering through the upregulation of
LFY and SOC1 expression (Achard et al., 2004).
Gibberellins
LFY
DELLAs SOC1
miR159
[image:29.595.85.488.406.740.2]Floral Meristem Identity Genes
14
1.1.1.6The Autonomous Pathway
The genes involved in this pathway include; FCA, LUMINIDEPENDENS (LD), FY, FPA,
FVE, RELATIVE OF EARLY FLOWERING 6 (REF6), FLD, and FLOWERING LOCUS K (FLK) (Fig 1.8) These genes act to promote flowering by repressing the expression of the floral repressor FLC (Koornneef et al., 1991; Marquardt et al., 2006). FVE and FLD regulate
FLC by chromatin modification while FPA, FLK interact with FLC mRNA (Simpson 2004). The autonomous pathway acts independent of environment factors (Srikanth et al., 2011; Massiah et al., 2007; Yan et al., 2010).
Much research has been carried out studying genes involved in the autonomous pathway for example mutants fca, fy, fve and fpa were reported to flower later than WT in both LD and SD photoperiods (Koornneef et al., 1998). These responses were similar to those seen in other late flowering mutants ld (Lee et al., 1994; fld (Sanda et al., 1996and flk (Lim et al., 2004).
FCA FLD FPA FLK FVE FY REF6
FLC
FT
[image:30.595.74.522.377.699.2]Floral Meristem Identity Genes
Fig 1.8 A schematic diagram of the Autonomous pathway . Arrows indicate activation and T-bars represents inhibition.
FLK represents FLOWERING LOCUS K, REF6 represents RELATIVE OF EARLY FLOWERING6, FLC represents
15
1.1.1.7Floral Integrators
The vernalization, autonomous, photoperiodic, microRNA, ambient temperature and light quality with the exception of GA pathway all converge on the floral integrator genes FT and
SOC1 which in turn activate the floral meristemic identity genes AP1, LFY and FUL. The genes induce the transition to floral induction in the developing primordia (Boss et al., 2004).
1.2Florigen –The flowering time regulator FT
1.2.1 The Florigen hypothesis
A vast majority of plant species exhibit accelerated flowering when grown and maintained under specific photoperiod. This was demonstrated by Garner and Allard in the 1920’s.
They reported that late flowering tobacco strain, Maryland Mammoth exhibited early flowering when the photoperiod was reduced (Garner et al., 1922). Other classical experiments demonstrated that flowering was triggered in plants that were maintained under LD conditions even though the apex of the plants in which flowering occur was exposed to non-inductive SD condition (Knott 1932). These discoveries led to the conclusion that leaves were the site of signal perception.
16
1.2.2 The physiology of FT and its homologues
FT encodes a small globular protein with a molecular weight of 20kDa which is known to be structurally similar to the Raf Kinase Inhibitory Protein (RKIP) family of mammals (Kardailsky et al., 1999). It is also homologous to the phosphatidyl ethanolamine binding protein (PEBP) (Imaizumi et al., 2006). It is known that PEBPs play a vital role in signalling and also growth and differentiation in plants and animals (Hanzawa et al., 2005; Kardailsky et al., 1999). There are six genes in the PEBP gene family of Arabidopsis. They
include FT, TSF, ARABIDOPSIS CENTRORADIALIS HOMOLOGUE (ATC), TFL1,
BROTHER OF FT (BFT), TFL I and MOTHER OF FT (MFT). The six genes are sub classified into three groups. They include TFL-like subfamily, FT-like subfamily and MFT -like subfamily. TFL1 and BFT belong to the TFL-like subfamily. The genes in this group are involved in flowering repression while FT and TSF belong to the FT-like subfamily and the genes in this group are involved in flowering induction.
TSF is structurally identical to FT. In 2005, Hanzawa reported that with just a single amino acid change on FT it is possible to convert it into a TFL1-like molecule (Hanzawa et al., 2005). Structural molecular analysis showed that key residues that confer FT or TFL1-like behaviour exist on an exposed loop of these proteins which suggests that the two proteins act through a common mechanism (Ahn et al., 2006). MFT promotes embryo growth of seeds by interacting with the GA pathway (Xi et al., 2010). It also induces early flowering as reported by Dr Yoo, Arabidopsis lines that had over expressed MFT exhibited early flowering phenotype compared to WT plants (Yoo et al., 2004).
1.2.3 Conservation of Arabidopsis flowering genes in crop species
The knowledge of FT in Arabidopsis has pioneered the discovery and understanding of other FT orthologues in crop species. Comparative genome analysis with rice sequence revealed that a majority of the Arabidopsis key flowering genes were conserved (Izawa et al., 2003). Orthologues of FT (Hd3a), GI (OsGI) and CO ( HD1) have been identified in rice a SD plant. In rice, OsGI promotes the expression of HD1 as seen in Arabidopsis with GI and
17 HD1 plays a crucial role in mediating the photoperiodic signal. It activates Hd3a expression in rice under SDs whereas in LDs it inhibits Hd3a (Izawa et al., 2002; Hayama et al., 2003; Kojima et al., 2002).
In Tomato, a DNP, flowering is not affected by photoperiod (Lifschitz et al., 2006). However tomato plants exhibit processes that are regulated by the circadian clock, although floral induction is not one of these (Jarillo et al., 2008). The tomato FT orthologue SINGLE FLOWER TRUSS (SFT) has been reported to play a role in the promotion of flowering (Lifschitz et al., 2006). The SFT gene has also been proposed to have a role in floral induction through the autonomous pathway (Molinero-Rosales et al., 1999). Other tomato
FT-like genes include SELF PRUNING (SP), SP2I, SP3D, SP5G, SP6A and SP9D (Carmel-Goren et al., 2003). These genes control the regularity of the vegetative –reproductive switch in tomato (Carmel-Goren et al., 2003). Over expression of SP resulted in an increased number of leaves between inflorescences and an increased leafiness of the inflorescence shoot itself (Pnueli et al., 1998). Divergence expression studies in the SELF PRUNING (SP) family indicated various expression levels in vegetative and reproductive organs (Carmel-Goren et al., 2003), e.g. SP3D was expressed mainly in floral organs while SP5G was expressed only in the cotyledon and leaves. SP2I was quite unique because it was discovered to be expressed in all the vegetative and reproductive organs. Perhaps the SP2I gene has a role in both the vegetative and reproductive phase transition in tomato.
In barley, a LD plant, 5 highly conserved genes homologous to FT have been identified.
HVFT1 was discovered to be barley FT-like gene involved in flowering regulation (Faure et al., 2007). Two CO( HvCOI and HvCO2) and a barley GI (HvGI) gene was also reported (Dunford et al., 2005). PHOTOPERIOD-HI (Ppd-HI) which is a pseudo-response regulator has been reported to be the major component of flowering in LD photoperiods in barley (Decousset et al., 2000). Ppd-h1 mutants exhibit reduced photoperiod which was as a result of an altered circadian expression of CO and a reduced expression of FT (Turner et al., 2005).
In the potato Solanum tuberosum ssp. andigena which is qualitative SD plant homologues of
18
rice (Rodriguez-Falcon et al., 2006). Under LDs PHYB interacts with StCOL3 causing a repression in the expression of StFT whereas in SDs, StCOL3 induces the expression of StFT. Phytochrome B had previously been shown to have a role in the photoperiodic control of tuberisation (Jackson et al., 1996). In mutant phyB lines in which PHYB activity was repressed, the plants tuberized in LDs while WT plants did not tuberize. Potentially of interest to this project is the work carried out on tuberisation in potato. We will investigate the role that FT plays in the induction of tuberization in potato.
In 2011, FT-like paralogues; StSP6A and StSP3D were reported to have been discovered in potato. These genes had key roles in tuberization and floral induction respectively (Navarro et al., 2011). Transgenic Andigena lines that over-expressed StSP6Aox tuberized under non-inductive LDs while lines in which the target gene was silenced did not tuberize under the same conditions. Andigena lines in which the StSP3D was down-regulated exhibited a late flowering response. Flowering was reported to be completely suppressed in lines that had strong silence levels. This showed that different FT-like genes had different roles in potato.
1.2.4 The Role ofFT protein in long-distance transport and flowering induction
Over the years much work has been carried out to elucidate the transport of FT protein and its role in floral induction. The subject of FT protein transportation in plants proved to be a controversial topic. FT protein alone was initially thought to be able to move from the vasculature to the apex and induce flowering. In 2005, Huang et al reported that FT mRNA was a mobile signal in Arabidopsis. They expressed FT fused with a GUS reporter gene driven by a heat shock-inducible promoter. Elevated levels of FT transcripts were detected in the vasculature after induction. In addition the transcripts were also detected in the shoot apex several hours later. This result indicated that the FT mRNA could move from an induced leaf to the apex of the plant. The paper was retracted due to the fact that the experiment could not be reproduced (Bohlenius et al., 2007). Jaeger et al.,2007 reported that FT protein could travel from the vasculature to its site of action at the SAM where it interacts with FD to initiate floral induction in the plant. They demonstrated this by generating immobile FT proteins. A nuclear localisation signal (NLS) was attached to the FT protein to inhibit its movement out of the cell. When the fusion protein was expressed in ft
19
NLS tag was removed flowering occurred. This led to the conclusion that FT protein was a mobile signal that is capable of long distance transportation. This finding was consistent with other findings reported at that time. For instance, in Brassica napus, FT protein was identified in the soluble fraction of sieve-tube exudates of brassica phloem sap (Giavalisco
et al., 2006).
Although it is widely acknowledged that FT protein is a mobile floral stimulus which could move from the vasculature to the SAM, the question of whether FT mRNA could also move is still under debate. In recent years, Li et al (2009) demonstrated that FT mRNA was capable of long distance movement. They used a RNA mobility assay based on movement defective viruses; Potato Virus X and Turnip crinkle virus, and mutant and WT Arabidopsis FT genes were independently cloned into these movement defective viruses. The mutant FT (mFT) clone contained a non-translatable version of FT in which the start codon (ATG) had been replaced with a stop codon (TAG) (Fig 1.9). They reported that the non- translatable FT
mRNA (mutant) could move throughout Nicotina benthamina, Maryland Mammoth and ft
mutant Arabidopsis plants and thus the movement was independent of FT protein (Li et al., 2009).
.
CP
12K
25k 8k
RDRP (166k) Insert site
FT mFT
PVX/FT
PVX/mFT
Figure 1.9. A schematic representation of the constructs used for experiment. The PVX/mFT construct contains a non-translatable mutant version of FT in which the start codon (ATG) has been replaced with a stop codon (TAG), and there is also an additional adenine to thymine mutation at codon 4.
20
CO
FT FT mRNA
SOC1
FT/ FD FT+FD
Figure 1.10 The role FT in long-distance transport and flowering induction. Light drives the rhythm of CO expression. CO activates the FT gene. FT mRNA / FT protein move from the leaf to the shoot apical meristem (SAM) through the phloem’s
sieve plates and sieve elements. At the SAM the FT protein interacts with the FD bZIP transcription factor forming a
complex which results in the direct upregulation of SUPPRESSOR OF CONSTANS 1 (SOC1) mRNA. SOC1 in turn forms
a complex with AGAMOUS-LIKE 24 (AGL24) which translocates to the nucleus where it binds the LEAFY (LFY)
promoter to induce LFY expression which ultimately induces the development of floral primordia. The FT/FD complex could also induce the expression of floral meristem identity genes such as APETALA1( AP1) as indicated above.
SAM
AP1
FT protein
AP1
Stem
Phloem companion cell and sieve element
Young leaf Sun
21
1.3 Utilization of Plant virus-based toolbox to investigate protein function and
RNA movement
1.3.1 Potato Virus X (PVX) andPVX-based viral expression system
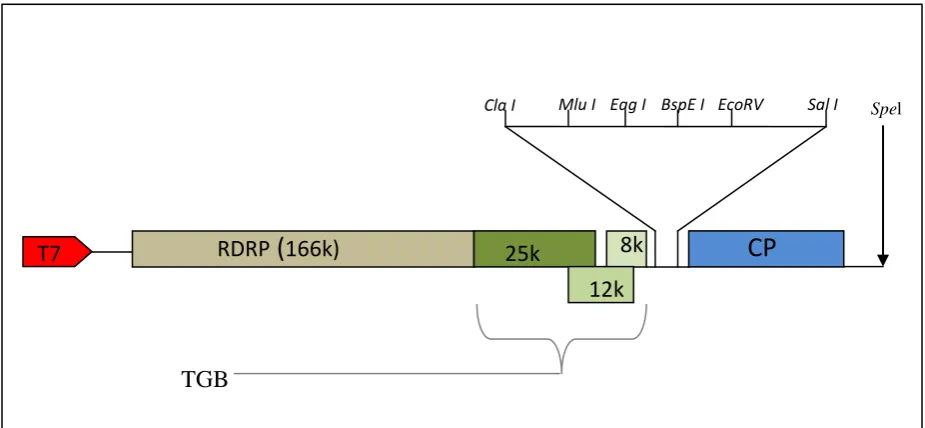
In recent years, the PVX vector has become a tool of interest to plant biologists because of its relative stability, ease of host infection and genomic manipulation, high titers in infected plants and its mechanical transmissibility to a number of Solanaceous hosts e.g. tobacco, tomato, potato, eggplant, pepper etc. (Angell et al., 1997).
PVX is a potexvirus. It is also a filamentous rod-shaped virus which contains a single plus
sense RNA molecule. The 5’ end of PVX RNA has an m7
GpppG cap and the 3’ end has a polyadenylated tail. The PVX genome encodes 5 open reading frames that include
RNA-dependent RNA polymerase (RdRp), Triple gene block (TGB); TGBp1, TGBp2 and TGBp3,
and coat protein (CP) (Huisman et al., 1988). The ORFs holds the key factors responsible for virus survival and mobility. The RNA-dependent RNA polymerase (RdRp) gene is located at the 5’end of the PVX genome. The RdRp is solely involved in interacting with host factors to
promote PVX replication (Angell et al., 1997). The three encoded TGB proteins TGBp1 (25kDa), TGBp2 (12kDa), and TGBp3 (8kDa) have roles in virus transport. They are known to be conserved among members of the Potexvirus, Furovirus, Hordeivirus and Carlavirus
genera (Angell et al., 1997; Wodnarfilipowicz et al., 1980). TGBp is also able to move intercellularly through expanding plasmodesmata (Kalinina et al., 1996; Krishnamurthy et al., 2002). Coat protein (CP) is involved in cell to cell movement and systemic spread in host and it is also an important structural protein for assembling virus particles (Chapman et al., 1992; Scholthof et al., 1996; Angell et al., 1999).
The PVX vector used in this project was derived from pPC2S. The modified viral cDNA was positioned 3’ to the T7 RNA polymerase promoter (Baulcombe et al., 1995). The cloning sites within the PVX plasmid are between the Cla I and Sal I sites. There is also an EcoRV
22
mRNA and Arabidopsis FT were also both shown to move from the leaf tissue to the apex providing evidence that FT RNA is involved in long distance movement (Li et al., 2009). The mutant FT construct possessed a premature stop codon at the start of the sequence, hence a non translatable FT mRNA is produced and no FT protein is made.
1.4 Project aims
The principal aim of this project was to utilize viral vectors expressing FT and FT
orthologues to further our understanding of floral induction and to investigate their commercial potential in plant breeding programmes. The specific objectives were:
Investigate whether viral expression of FT can induce rapid flowering in a range of crops including Brassica, tomato, tobacco and potato.
Investigate whether the viral expression of FT can induce tuberisation in potato.
Address issues related to the potential use of PVX/FT in commercial breeding
23
Chapter 2
24
Chapter 2: General Material and Methods
2.1 General materials
2.1.1 Plant materials
Plant species used in this project were; SD-requiring potato (S. Tuberosum L. subsp.
Andigena 7540)(Jackson et al., 1996), SD Maryland Mammoth tobacco (Nicotiana tabacum)(Garner et al., 1922), day- neutral tobacco (Nicotiana benthamiana), tomato (Lycopersicon esculentum) Ailsa Craig kindly provided by Dr Andrew Thompson (Warwick ) and broccoli (Brassica oleracea var.italica) kindly provided by Prof. Brian Thomas (Warwick). The potato plants were obtained by subculturing plants into fresh 2xMS media and then maintained in a sterile environment. Mature potato plants were transplanted into soil for subsequent experiments. Seeds of tomato, tobacco and broccoli were sown into F2S compost (Levingtons). Young seedlings were transferred into separate pots containing M2 compost (Levingtons) and maintained in an insect free containment glasshouse under LD condition.
2.1.2 Bacterial material and media
Bacterial strains used included electrocompetent E.coli EC100 (Cambio Ltd., Cat No. EC10005) and Agrobacterium tumefaciens (AGC58PGV3101). E.coli EC100strain; F-mcrA Δ(mrr-hsdRMS-mcrBC) Φ80dlacZΔM15 ΔlacX74 recA1 endA1 araD139 Δ(ara, leu)7697 galU galK λ
-rpsL (StrR) nupG) was used in the generation of recombinant virus constructs and Agrobacterium tumefaciens (AGC58PGV3101) strain; pMP90RK ΔT-DNA- pTiC58+
25
TGB
After cooling, separately autoclaved 400µl of 5M NaCl, 2ml of 1M MgSO4, 4ml of 1M Glucose and 500µl of 1M KCl were added in a sterile environment to make up the volume to 200ml.
2.1.3 Plant virus –based vectors
RNA mobility assay (RMA) vector used in this project was based on Potato Virus X (PVX Fig 2.1)(van Wezel et al., 2001) which was kindly provided by Prof Yiguo Hong (Warwick).
Figure 2.1. A Schematic representation of the plasmid vector (PVX) used for cloning. The RNA dependent RNA polymerase (RDRP) (166K) is involved in promoting PVX replication while the Triple gene block (TGB) subunits (25K, 12K and 8K) are involved in PVX transportation. The restriction sites within PVX include ClaI, MluI, EagI, BspEI, EcoRV and SalI. The PVX vector is a modified version of pP2C2S (Baulcombe et al., 1995). The modified vector contains a T7 promoter and a unique Spel site for plasmid linearization.
CP
RDRP
(
166k) 25k12k
8k
Cla I
Mlu I
Eag I
BspE I
EcoRV
Sal I
T7
[image:41.595.68.531.252.466.2]
26
2.2 General methods
2.2.1 Plant inoculation with Tissue Sap
Young SD N.tabacum Maryland Mammoth, day- neutral tobacco (Nicotiana
Benthamiana), tomato (Lycopersicon esculentum) Ailsa Craig, broccoli (Brassica oleracea var.italica) and SD-requiring potato (S. tuberosum L. subsp. Andigena 7540) plants were inoculated at the 5-6 leaf stage. Inoculation was carried out on 5 plants per construct. The plant’s leaves were initially dusted with carborundum powder in order to cause abrasion on
the leaf surface (Fisher Scientific) and then inoculated with sap from PVX/FT, PVX/FTC4, PVX/FT-HIS, PVX/FT-FLAG, PVX/mFT infected tobacco plants. Two young leaves were inoculated for each plant subject. After inoculation, plants were maintained in an insect-free containment glasshouse in a LD (16hr) photoperiod.
2.2.2 Plant growing conditions
Seeds of Nicotiana tabacum Maryland Mammoth CP-transgenic line 1C and WT Nicotiana
tabacum, tomato (Lycopersicon esculentum) Ailsa Craig, broccoli (Brassica oleracea var.italica) and SD-requiring potato (S. tuberosum L. subsp. Andigena 7540) were sown in F2S compost (Levingtons). After the seeds had germinated, seedlings were transplanted into new separate pots containing M2 compost (Levingtons) and grown at 25oC under LD condition.
2.2.3 Tissue culturing and Shoot induction media
For the preparation of 1L of tissue culture media, 8.1g Murashige and Skoog (MS) powder (Duchefa Biochemie) was dissolved in 800ml of sterile water. 40g of sucrose (Sigma) was also added to the mixture. pH was adjusted to 5.8 with 1M NaOH or 1M HCl as necessary
while stirring the mixture. Sterile water was added to make up a total volume of 1L. 7g of
agar (Sigma) was added to the mixture and autoclaved. Molten MS media was aseptically
poured into tissue culture pots and allowed to solidify. The MS media was used for
subsequent tissue culturing. For the preparation of Shoot induction media (MG), MS media
was prepared as mentioned above with the exception of sucrose which was replaced with
27
Benzylamino purine (BAP), 0.2mg/l alpha-naphthalenacetic acid (NAA) (Sigma) dissolved in
DMSO, 100mg/l ampicillin and 50mg/l spectinomycin were added into the mixture. Molten
MG media was aseptically poured into tissue culture pots and allowed to solidify. The MG
media was used for subsequent tissue culturing.
2.2.4 Tissue culture of potato and tobacco plants
Solid 2xMS media was melted in the microwave and aseptically poured into sterile pots. Working in a flow hood and with the aid of sterile forceps and scalpels plant tissue material was excised from parent plant and subcultured into new properly labelled media pots. The plants were nurtured and allowed to mature. This took between 4-5 weeks. When the plants were mature enough they were transplanted into M2 compost (Levingtons).
2.2.5 Seed Sowing (Filter paper and Soil)
In the experiment investigating whether the virally expressed FT and CP could move into the germline of PVX/FT inoculated plants, seeds were harvested from the seed pods of PVX/FT inoculated N. tabacum and L. esculentum plants and sterilised in 10% bleach (domestos). The seeds were air dried and sown on wet filter paper in sterile petri-dishes (Thermo Fisher). Germination occurred between 2-3 weeks. Young seedlings were harvested after which RNA extraction was carried out with the aid of an RNAeasy Kit (QIAGEN) as suggested by manufacturer’s protocol.
2.2.6 High fidelity KOD-PCR
High fidelity KOD DNA polymerase (Merck Chemicals, Cat No 71086) together with
28
94oC for 2mins, followed by 30cycles (if not specified otherwise) of denaturation at 94oC for 15 sec, annealing (specific primer temperature) for 30sec, and extension at 72oC for 1min per kb of expected product. A further 10 minutes of extension at 72oC was carried out at the end of the cycles. Lists of primer sequences and target genes are shown in the appendix Table 1. PCR products were analysed by agarose gel electrophoresis. 1kb plus DNA ladder (Invitrogen Ltd., Cat No 107787) was run alongside the samples used to assess the fragment sizes of PCR products. 2 µl Orange G (Sigma-Aldrich, Cat No 03756) loading buffer and 6µl of samples were loaded on 1% agarose gel (Invitrogen Ltd cat No 15510,USA) and electrophoresed in 1 X TAE buffer containing 40mM Tris-acetate and 1mM of EDTA (Fisher BioReagents) at 150V for 40mins. Agarose gels were stained with GelRedTMNucleic
Acid gel stain (Biotium). Gel Images and records were taken using a G:BOX gel documentation system (Syngene, UK).
2.2.7 Purification of PCR products from gels
Nucleic acids containing bands were excised from the gel and products were isolated using a QIAquick Gel Extraction Kit (QIAGEN, Cat. No. 28704) following the manufacturer’s suggested guidelines. The purified products were eluted in 20µl of SDW.
2.2.8 Reverse transcriptase PCR (RT-PCR)
Total RNA was extracted from leaf and plant tissue material (see 2.2.22). The extracted RNA was dissolved with RNAse–free water (Promega). cDNA was synthesised by setting up the following: reaction volume was set up in 12 µl which contained 1 µl of random primers (Invitrogen), 1µl of 10mM dNTP mixture and 50ng of total RNA treated with DNase (Promega). Nuclease-free water (Promega) was added to make up the final total volume to 12 µl. Using a thermocycler, the mixture was heated to 65oC for 5 minutes after which the mixture was quickly chilled on ice for 5 seconds. 4µl of 5x First-Strand buffer (250mM Tris-HCl, pH 8.3 at 25oC; 15mM MgCl2; 375mM KCl) and 2µl of 0.1M DTT was added to the
29
Superscript®
II reverse transcriptase (Invitrogen) was added to the reaction mixture and incubated at 25oC for 10 minutes, then at 42oC for 50 minutes. Reaction mixture was inactivated at 70oC for 15 minutes. Synthesised cDNA was used as a template for subsequent PCR reaction. Standard PCR was carried out for 30 cycles (see 2.2.6). The primers PP82 and
PP356, TCPF and TCPR, EFNBF and EFNBR were used to detect ArabidopsisFT, mFT, CP,
PVX cDNA and Elongation factor 1-alpha (housekeeping gene). List of all primers used is shown in (Table 1).
2.2.9 Digestion of KOD –PCR products with restriction endonucleases
Purified KOD-PCR products were digested with EagI and SalI restriction endonucleases (New England Biolabs). The digestion reaction was typically set up in 50µl containing 30 units of each restriction enzymes, 5µl of 10 x BSA (10mg/ml), 5µl 10 x NEBuffer ( see Appendix 11), 28µl of purified PCR products. A final volume of 50µl was acquired by adding sterile distilled water. The digestion reaction was carried out at 37oC for 3 hours. After the duration had elapsed, the digested DNA fragments were purified using QIAquick PCR purification kit (Qiagen) and DNA was eluted with 25µl EB buffer (Qiagen).
2.2.10 Preparation of cloning vectors
30
alcohol:24:1 (Sigma) (40µl) was added then the tube was gently vortexed for 20-30seconds and centrifuged for 3 minutes at 15000 rpm. The supernatant was immediately transferred to a fresh 1.5ml tube. 8µl of 3M sodium acetate and 100µl of 100% ethanol was added to the tube. The resulting mixture was temporarily stored at -20oC for an hour and centrifuged at 15000 rpm at 4oC for 18 minutes. Following washing in 70% Ethanol, the pellet was air-dried and dissolved in 40µl of water. The final concentration of linearised DNA vectors was 25ng/ µl.
2.2.11 Ligation reaction preparation
Ligation reaction was carried out in 30µl containing 3µl of 10 x T4 Ligase reaction buffer
(500mM Tris-HCl; 100mM MgCl2; 10mM ATP; 100mM DTT; pH 7.5 at 25oC), 1 µl of T4
DNA ligase (New England Biolabs), 5µl of vector (10ng/µl) and 21µl of KOD –PCR products (approx. 2.5 µg DNA) digested with EagI and SalI restriction endonucleases (New England Biolabs). Ligation was typically carried out at room temperature overnight. Purification of ligation mixture was carried out using Phenol:chloroform extraction (see 2.2.19). Pellet was dissolved in 20µl sterile distilled water. The purified recombinant plasmid was then used for transformation.
2.2.12 Transformation of E.coli (EC100) by electroporation
Recombinant plasmids were transformed into E.coli (EC100) competent cells. 2µl of plasmid DNA(2.5 µg) was added to a 0.5ml tube containing 10µl of electro-competent cells and gently mixed by resuspension with a pipette at room temperature. The mixture was transferred into an electroporation cuvette (1mm Gap width, BioRad) and placed into Electroporator (BioRad Gene PulserTM) for electrical pulsing applying 1.5KV, 25µF
31
2.2.13 DNA transformation of Agrobacterium tumefaciens
Recombinant Binary vector pB2GW7/CP was transformed into A. tumefaciens competent cells by electroporation. 4µl of binary vector was added to a 0.5ml tube containing 40µl of A. tumefaciens competent cells (AGC58PGV3101) and gently mixed by resuspension with a pipette at room temperature. The mixture was transferred into an electroporation cuvette (1mm Gap width, BioRad) and gently placed into Electroporator (BioRad Gene PulserTM) for
electrical pulsing applying 1.8KV for 5ms. After electrical pulse had been applied, 0.5ml of room temperature SOC media was added to the transformation mixture and plated out unto LB and incubated overnight at 28oC. 25µg/ml Gentamicin (GENT), 100µg/ml Spectinomycin (SPEC) and 50µg/ml Rifampicin (RIF) (Sigma) was used for selection of transformants.
2.2.14 Tobacco Leaf disc transformation
A.tumefaciens (AGC58PGV3101) harbouring the pB2GW7/CP plasmid was grown overnight in a 10ml LB culture containing 25µg/ml Gentamicin, 100µg/ml Spectinomycin and 50µg/ml Rifampicin. The bacteria culture was centrifuged at 6500rpm for 4 minutes and then resuspended in antibiotic – free LB broth. Small pieces of leaf disc were cut from young WT N. tabacum plants and immersed into the bacterial suspension containing 3ml of A. tumefaciens and 7ml MS liquid (see 2.2.3). The leaf disc was left in the bacteria suspension for 10 minutes with occasional gentle shakes every 2 minutes. After this, the leaf discs were placed in solid 2MS media plates and incubated in the dark for 2 days at 28oC. After incubation, the leaves were placed on a MG media (see 2.2.3) with periodical media replacement every 7-10 days. Shoot tissue (1-2 cm long) were excised from calli and placed in fresh MG media that contained the appropriate antibiotics (Fig 2.2B). Young transformed
32
Figure 2.2Tobacco leaf disc transformation. A shows CP recombinant Agrobacterium tumefaciens transformed N.tabacum leaf discs in shoot induction media; B shows calli development on transformed leaf discs in selective medium containing spectinomycin and ampicillin antibiotics; C shows young shoots sprouting from callus tissue; D shows young shoot tissue growing in MG media containing spectinomycin and ampicillin antibiotics; E and F shows a young transgenic plant growing in soil at different developmental stages; G shows a mature CP transgenic N tabacum plant in glasshouse.
A
B
D
E
F
33
2.2.15 Colony PCR screening
Individual colonies were picked and resuspended in 30 µl sterile distilled water. 1 µl of the resuspended colony was added to a preprepared PCR mixture. Standard PCR reaction (see section 2.2.6) was carried out using gene specific primers (see section appendix 1). The primers used for screening of colonies transformed with PVX-based constructs were PP82, PP356 and gene specific reverse primers (see appendix 1).
2.2.16 Extraction of plasmid DNA
Positively transformed colonies were used to inoculate 10ml of LB broth containing 100µg/ml ampicillin. The culture was propagated in a rotating incubator at 37oC overnight. The culture was then centrifuged at 4000rpm (5810R, Eppendorf ) for 20 minutes. Plasmid DNA was extracted using Qiaprep miniprep kit (Qiagen). DNA was eluted with 200 µl EB buffer (10mM Tris-HCl, pH 8.5).
2.2.17 Quantification of RNA and DNA samples
NanoDropTM ND-100 spectrophotometer (Thermo Scientific) was used to measure the
concentration of both DNA and RNA samples. 4µl of the RNA or DNA sample was loaded on the spectrophotometer’s pedestal. The 260nm/230nm and 260nm/280nm ratios were measured. Typically pure DNA and RNA nucleic acids recorded 260/280 ratio of ~ 1.8 or a 260/280 ratio of ~ 2.0, respectively.
2.2.18 DNA sequencing
The Dye® terminator V.3.1 cycle sequencing kit (Applied Biosystems) was used to
sequence DNA products. The manufacturer’s protocol was followed as instructed. Template
34
The sequencing reaction was carried out for 25 cycles at 96oC for 10sec, 50oC for 5 sec and 60oC for 4mins. The samples were sent to Warwick Life science Genomic Resource centre for sequencing. Results were viewed with the aid of Chromas V2.11 (Technelysium Pty Ltd) and the sequences were analysed in detail with the aid of DNASTAR Lasergene 11 software suit.
2.2.19 Linearization and extraction of recombinant plant virus vectors
Recombinant PVX vectors were first linearized by digestion with SpecI (New England Biolabs). The reaction was carried out in 100µl containing 30 Units of SpecI, 10µl of 10 x NEBuffer 4, 10µl of 10 x BSA (10 mg/ml ), 10µg of miniprep DNA. The reaction was carried out at 37oC for 3hours. An equal volume of phenol:chloroform:isoamyl alcohol 25:24:1 (100µl) was added to the digestion mixture and gently vortexed for 20-30seconds. The mixture was then centrifuged for 3 minutes at 15000 rpm and 100µl of upper phase was transferred to a new 1.5ml Eppendorf tube. An equal volume of chloroform:isoamyl alcohol 24:1 (Sigma) (100µl) was added. The tube was gently vortexed for 20-30seconds and centrifuged for 3minutes at 15000rpm. The supernatant was immediately transferred to a fresh 1.5ml tube. 10µl of 3M sodium acetate and 250µl of 100% ethanol was added to the tube. The resulting mixture was temporarily stored at -20oC for an hour and then centrifuged at 15000 rpm at 4oC for 18 minutes. Following washing in 70% ethanol, the pellet was air-dried and dissolved in 40µl of water. The final concentration of linearised DNA vector was 250ng/µl.