‘Alexa, how can we increase trust in you?’: An
Investigation of Trust in Smart Home Voice
Assistants
Author: Rabea Jasmin Adams
University of Twente
P.O. Box 217, 7500AE Enschede
The Netherlands
ABSTRACT,
With the emerging rise of Voice Assistants that are transforming households into
Smart Homes, these IoT devices become relevant marketing tools that represent
crucial opportunities for business intelligence. However, user adoption is limited due
to consumers’ mistrust. In this paper, trust in Smart Home Voice Assistants is
investigated using an identification of trusting bases provided by literature and
testing their effect on Willingness to pay (WTP) using a consumer survey. Moreover,
the role of demographic variables in this context is researched. The findings display
the cognitive trusting base, particularly the trust factor Perceived Usefulness to have
a positive effect on WTP. No significant variables moderating the PU – WTP effect
have been found. However, differences in trust among age group, education and
gender could be observed. When evaluating priorities set by the respondents, Data
Security is a major concern. Thus, in order to exploit the potential this technology
has for marketing, it is necessary to tackle the Perceived Usefulness by adding new,
innovative application fields and productive features to Smart Home Voice Assistants
that provide transparency in terms of Data Security.
Graduation Committee members:
First supervisor: Dr. Agata Leszkiewicz
Second supervisor: Dr. Efthymios Constantinides
Keywords
Voice Assistants, Trust, Smart Home, Willingness-to-pay, Internet of Things, Artificial Intelligence
This is an open access article under the terms of the Creative Commons Attribution License, which permits use, distribution and reproduction in any medium, provided
1.
INTRODUCTION
Nowadays, consumer preferences shift towards a more digitalized world, including the usage of voice as an interaction channel (Buvat et al., 2018). Especially voice assistants or so called Intelligent Virtual Assistants (IVA) as a smart home device are gaining rapid popularity among consumers and are increasingly integrated into their daily lives (Purington et al., 2017). Globally, the IVA market size estimation in 2016 rounded up to USD 1005.2 million with a growth rate of 36.7% (Grand View Research, 2018). The connected devices become progressively more available and affordable (Zheng et al., 2018). By 2021, “customer adoption of voice assistants globally is expected to reach 1.83 billion” (Buvat et al., 2018, p. 3).
The underlying functioning of these virtual assistants is enabled by Artificial Intelligence, the Internet of Things, Machine Learning and Natural Language Processing techniques (Liao et al., 2019) that facilitate Human-Computer interaction (Hoy, 2018). This way, devices such as Amazon Alexa, Google Assistant or Microsoft Cortana can perform numerous functions, including entertainment features and assistant functions like playing music, managing appointments, playing games and providing information about a variety of topics, e.g. weather and traffic (Purington et al., 2017).
However, the use of voice assistants is not yet extensively adopted. Due to a lack of trust in these new devices, less people are using it, resulting in a slow diffusion of this technology (Soronen et al., 2008).
1.1. Academic Relevance
Previous papers provide extensive scientific evidence about the acceptance of Artificial Intelligence (AI) and new (disruptive) technologies in general. An Example of this is the Technology Acceptance Model by Davis (1985), that serves as a basis for the research of technology adoption and examines the factors that are having an influence on technology diffusion among a population. This framework has been applied by various researchers, also in the context of voice assistants. Examples of prior studies in the sector of voice assistant adoption are Chowdhury (2018), who applied the theory of planned behaviour (Ajzen, 1991) into the context of non-human interactions and avoidance attitudes towards voice assistants, as well as Nasirian et al. (2017) who evaluated and tested the interaction and trust perspectives of AI-based voice assistants using a conceptual model.
However, even though the factor trust is considered as relevant for the adoption of Smart Home devices as well as voice assistants in general (Liao et al., 2019), this topic has only limitedly been researched. There is neither a conceptual framework model combining dimensions of trust based on trusting bases that refers to voice assistants, nor evidence about correlations between trust and demographic variables. Moreover, previous research has shown that in various business sectors, trust is positively affecting the WTP (Bakaki & Bernauer, 2016). For the AI sector and the voice assistant field, this effect is not yet investigated. Therefore, by closing this research gap, this paper is of academic relevance.
1.2. Practical Relevance
Current research highlights that customers’ use of Artificial Intelligence-based platforms enable a technology that provides value for both, the company and
the consumer (Brill, 2018). Next to this, AI based voice assistants also improve operational efficiency while the used Natural Language Processes (NLP) can improve customer service through users’ activity tracking (Zheng et al., 2018).
Especially Smart Home Voice Assistants provide useful insights for personalized marketing as well as possibilities such as voice search which enhances Search Engine Optimization for companies (Ramamurty et al., 2017). In terms of Business Intelligence, companies can use the collected data as an innovation tool to identify customer needs (Spoor, 2016) by utilizing “embedded sensors and the Internet to collect and communicate data with each other and their users” (Zheng et al., 2018, p. 200). Saffarizadeh et al. (2017) states that, the higher the amount of information a voice assistant user discloses, the higher the value he receives from using these devices. Nonetheless, consumers disclose less personal information due to mistrust, which hinders (marketing) personalization (Saffarizadeh et al., 2017).
1.3. Research Scope
The first contribution this paper aims at is setting up a framework based on the literature and a resulting trust model. Furthermore, the trusting bases and sub-dimensions of trust in voice assistants are investigated and operationalized to quantify them. Moreover, using existing trust scales derived from the literature, a questionnaire is created. Finally, the paper aims at providing consumer insights on the impact of the sub dimensions (trusting bases) of trust on the willingness to pay (WTP) for voice assistants (with a focus on smart home voice assistants). Moreover, correlations of these trusting bases with demographic variables such as age or gender are investigated, as well as how to mitigate the most influencing dimensions in order to exploit voice assistants as a marketing tool. It is important to note that this paper will focus on the variable trust in voice assistants and its relation to WTP, as well as correlating demographic variables and implications. Therefore, the WTP itself, further affection on intention to use and optimized marketing are not part of the research scope and will thus not be investigated in this paper.
In the end, this paper will provide valuable insights for companies to address trust issues that hinder them from executing marketing opportunities facilitated by voice assistants. These trust issues can be tackled effectively to increase the WTP and to exploit the potential AI-based Voice Assistants have for business intelligence. Hence, consumers can be addressed using data-driven, personalized marketing that is optimized through their use of voice assistants as Smart Home devices.
1.3.1. Research Question
The resulting research question is:How can a company increase trust in ‘smart home’ voice assistants with the objective of increasing the willingness-to-pay (WTP)?
Subquestions:
1. What are the trusting bases of trust in voice assistants?
2. Which trusting base(s) contribute most towards WTP?
4. How can a company mitigate the mistrust by effectively tackling the most influencing trusting base(s)?
2.
CONCEPTUAL FRAMEWORK
The overall framework that serves as a foundation for the assessment of trust dimensions is adapted from the conceptual model of Li et al. (2008). For assessing the components of trust, trust definitions are investigated and trusting bases are elaborated upon. To provide a comprehensive picture, various literature sources will be integrated that lead to the creation of a reliable conceptual model for trust in a Smart Home Voice Assistants context.
2.1. Trust
Trust is defined as “a psychological state comprising the intention to accept vulnerability based upon positive expectations of the intentions or behavior of another” (Rousseau et al., 1998). Another widely adopted definition by Mayer et al. (1995) describes trust as “the willingness of a party to be vulnerable to the actions of another party based on the expectation that the other will perform a particular action important to the trustor, irrespective of the ability to monitor or control that other part” (Mayer et al., 1995, p. 712). By having trust in technology, users face the risk of unfulfilled expectations and responsibilities (McKnight, 2011).
Moreover, it is seen as “one of the currencies that humans use to accept a technology in their everyday lives” (Dağlı, 2018, p. 9). Li et al. (2008) even determines trust as a “primary predictor” of technology use (Li et al., 2008, p. 39). Previous research has shown that trust affects the users’ intention to use a new technology and that the technology adoption is related to trust concerns (De Kruijff, 2018).
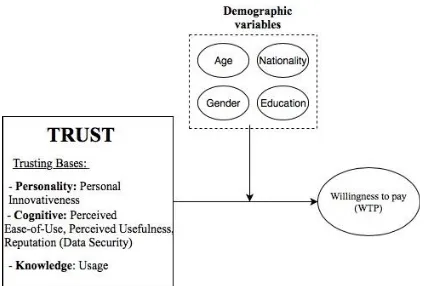
The basis of the trust model that forms the conceptual framework is adapted from Li et al. (2008). The trust model is based on four trusting bases, namely personality base, cognitive base, calculative base and institutional base. These trusting bases form the external determinants that set up the trusting technology construct (Li et al., 2008). In the paper of Li et al., the trust model is tested in the context of new technology. However, in this paper, the framework will be adapted and shifted towards the examination of trust factors in a voice assistant context. This involves the replacement and adjustments of trusting bases and (sub-)dimensions. For instance, ‘institutional base’ is excluded as this is only relevant in an organizational context (Li et al., 2008). Moreover, due to the focus on WTP, the calculative base is not considered. A visualization of the model used in this paper can be seen in Fig.1.
2.2. Personality Trusting Base
The variable ‘Personal Innovativeness’ can be categorized into the personality base (Li et al., 2008). Li et al. explains the trusting base ‘Personality Base’ by psychological research findings that reveal differences between individuals in their willingness to depend on others “across a broad spectrum of situations … and objects” that remains stable in its intensity and longevity (Li et al., 2008, p. 43). Nasirian et al. defined ‘Personal Innovativeness’ as the “willingness to try out any new technology” (Nasirian et al., 2017, p.5). This willingness/innovativeness is influencing the variable trust (Li et al., 2008). More
[image:3.595.314.526.141.284.2]specifically, it enhances users’ trust in technology (Nasirian et al., 2018). Moreover, Rosen (2005) explained that ‘Personal Innovativeness’ predicts the intention to use technology (Rosen, 2005, p.62). The resulting hypothesis is H1: There is a significant positive effect of Personal Innovativeness on Willingness to pay.
Fig. 1: Trust Model adapted from Li et al. (2008)
2.3. Cognitive Trusting Base
According to Li et al. (2008), the cognitive trusting base is suggested to affect trust in the form of “various cognitive cues and impressions” (Li et al., 2008, p.45). Huang (2017) considered the variables ‘Perceived Usefulness’ and ‘Perceived Ease of Use’ to be cognitive factors in predicting continued use of information systems (Huang, 2017). These two components were first defined by Davis (1989) and gained wide popularity as part of the Technology Acceptance Model (TAM). The definition by Davis points out ‘Perceived Usefulness’ as the extent of the belief that the use of a certain technology leads to job performance enhancements (Davis, 1985). Moreover, the factor ‘Perceived Ease-of-Use’ is defined as "the degree to which an individual believes that using a particular system would be free of physical and mental effort." (Davis, 1985, p.26). Resulting, these two factors are assumed to have a positive effect on Willingness to pay, i.e. H2: There is a significant positive effect of Perceived Ease-of-Use on Willingness to pay and H3: There is a significant positive effect of Perceived Usefulness on Willingness to pay.
When using innovative devices, users are exposed to risk as well as uncertainty related to the storage and transmission of data (McKnight et al., 2011), more particularly the interconnection with central cloud services that allow easy usage and global access of data collected by IoT devices (Daubert et al., 2015, p.1). This data is derived from the two user-side components, the companion applications and the voice assistant-enabled devices (Chung et al., 2017, p.4).
2.4. Knowledge Trusting Base
This (last) trusting base is also referred to as experiential trust (McKnight et al., 2011). It assumes “a history of trustor-trustee interactions” (McKnight et al., 2011, p. 3). Concluding, the knowledge trusting base is affecting trust in the form of either previous usage or a lack of experience in dealing with voice assistants. Sabater & Sierra indicated direct experiences with virtual agents in the form of ‘Usage’ to be “the most relevant and reliable information source for a trust model” that is positively contributing towards trust (Sabater & Sierra, 2005, p.4).
This trusting base has been excluded from the research model of Li et al. (2008), as their research was focused on initial trust, e.g. trust that is characterized by no prior interaction of the trustor with the trustee. However, for this paper, this scientifically proven trusting base is considered in the conceptual framework and the study to facilitate comparisons between Users and Non-Users of voice assistants and the role of usage in trust. The resulting hypothesis is H5: There is a positive effect of Usage on WTP.
2.5. Willingness to pay (WTP)
Willingness to pay (WTP) is defined as “the maximum price a given consumer accepts to pay for a product or service” (Le Gall-Ely, 2009, p. 3). Li et al. (2008) assumes the price-benefit ratio to be correlated with trust. In case the benefit exceeds the price, the user tends to have more trust and vice versa (Li et al., 2008). However, when critically evaluating this relationship, it becomes apparent that Li et al. proved this relationship to be significant under the condition of initial trusting beliefs, e.g. no prior experience and are driven by self-interest and rationality (Li et al., 2008). Under these circumstances, WTP serves as a rational factor that is crucial in technology purchasing decisions.
There is evidence that, across various business sectors, trust generally has a positive relationship to WTP. This means higher trust results in a higher WTP. Bakaki & Bernauer (2016) argue that their results suggest “low levels of trust in public institutions have a strong negative impact on the public’s willingness to pay for forest conservation” (Bakaki & Bernauer, 2016, p.1). Furthermore, Nocella et al. (2010) state that “the role of trust in consumer willingness-to-pay (WTP)...is paramount” (Nocella et al., 2010, p.275). In his research, consumers’ trust appears to have a positive influence on WTP (Nocella et al., 2010). In Social Network Sites (SNS) Han & Windsor (2011) also proved user’s trust as a variable influencing WTP (Han & Windsor, 2011). In addition, Ba (n.d.) investigated a model that hypothesizes buyers’ trust significantly affects their WTP (Ba, n.d.). The results indicate that this is true for expensive products (Ba, n.d.).
3. METHODOLOGY
3.1. Research Design
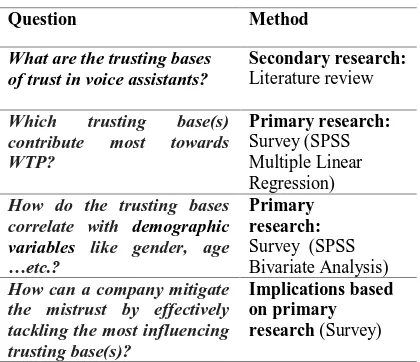
In order to fulfill the research objective of answering the overall research question and the operationalized subquestions, an adequate research design needs to be chosen. For this, considerations regarding the appropriateness of a method for answering the research questions are essential. In the table below (Fig.2), the methods applied to investigate trust in voice assistants can be seen (Fig. 2).
Question Method
What are thetrusting bases of trust in voiceassistants?
Secondary research: Literature review
Which trusting base(s) contribute most towards WTP?
Primary research: Survey (SPSS Multiple Linear Regression)
How do the trusting bases correlate with demographic variables like gender, age …etc.?
Primary research: Survey (SPSS Bivariate Analysis)
How can a company mitigate the mistrust by effectively tackling the most influencing trusting base(s)?
[image:4.595.316.526.188.369.2]Implications based on primary research (Survey)
Fig. 2: Methods used in relation to research questions
For this purpose, a combination of a primary research
model, e.g. utilizing primary data that is “collected directly from researchers for the purposes of their research objectives”, enabling me to have full control over the data collection (Chrysochou, 2017, p. 411) and a secondary research model, e.g. including “sources and data that are
already available” has been used (Chrysochou, 2017, p.411).
The secondary research was done in the ‘Conceptual Framework’ part of this paper and includes various literature sources. Keywords that were used for the sourcing of adequate literature are Smart Home Voice Assistants, Trust, Artificial Intelligence, Amazon Alexa, Google Assistant and Willingness-to-pay. By implementing this secondary research approach, a trust framework is being adapted. By these means,. the first research question of this paper, the identification of trusting bases, can be resolved.
The primary data of this paper is the data that is obtained from the sample using a quantitative data collection approach. A survey is preferred in case “the aim is more to get an overview and not explore in-depth the phenomenon” of consumer behaviour (Chrysochou, 2017, p. 412). Moreover, there is a strive for a generalization of the results. Surveys are commonly used as the provide the possibility of a detailed operationalization and interpretation of data. They allow for effective measurements of pre-set variables (Chryschou, 2017). Using the primary survey data, the trusting base that has the strongest impact on WTP is identified using a Multiple Linear Regression analysis in SPSS that provides a regression equation with coefficients that show the impact of each base on the variable WTP. Thus, the question
third research sub-question target of identifying correlations between trusting bases and demographic variables can be studied. The final research (sub-) question is concerned with the mitigation of trust issues, this can also be tackled by the insights derived through the primary data (survey) analysis. By these means, the main research question of the paper, i.e. How can a company increase trust in ‘smart home’ voice assistants with the objective of increasing the willingness-to-pay (WTP)?, can be answered. The further methodology process needed for conducting a survey can be categorized into the sub-processes Sampling, Designing Questions and Data Collection (Chryschou, 2017).
3.2. Sampling
In the sampling stage of a research, the researcher is determining the sample of participants that will be involved in the search, in this case in the survey. This also includes considerations about approaching possible respondents and defining the population the sample is drawn from. To achieve a high validity, the sample should be large and representative (Chrysochou, 2017).
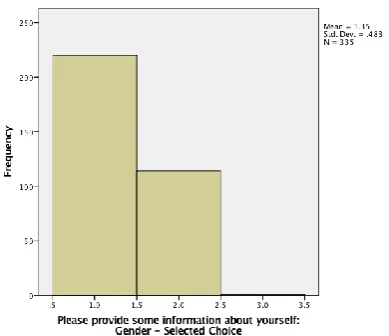
A total of 421 participants responded to the survey. This constitutes a representative sample size that yields the advantage of an increased validity of findings and the comparison of sub-groups (Hartley, 2013), in this case specifically the comparison between cases in different geographical areas, educational levels, gender and age group. To allow for this sample diversity, apart from an internet connection to fill in the online survey, no exclusion criteria were set.
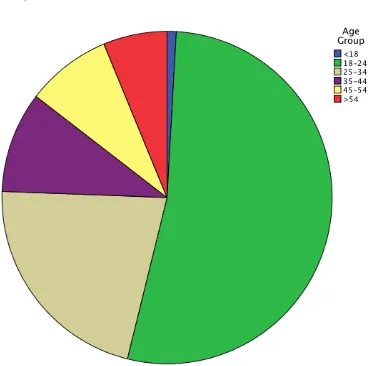
However, due to incomplete surveys (9%) and not utilizable answers, some responses had to be removed from the data analysis. In particular, all responses that were not completed and are marked with less than two minutes duration were excluded from the analysis. Moreover, careful considerations about the usefulness of incomplete surveys were made on a case-by-case basis, judging their potential insights for the research question. Finally, out of the 421 responses, only 370 responses are considered in the data analysis and are processed further. The sample varies in age groups from 18-54+, the majority (65.7%) being female. Of the 370 valid respondents, 206 (55,67%) are users of voice assistants. Apple’s Siri (26.5%) being the most used one. The proportions of Google Assistant and Amazon Echo (Alexa) users are relatively similar with 21.6% of all respondents using Google Assistant and 21.4% using Alexa. Only 3.5% indicated the use of other voice assistant devices, such as Microsoft Cortana or Samsung Bixby. In total, 33 different nationalities from Europe, Asia, America and Africa are included and grouped into continents/geographical areas. Hereby, due to the enormous fraction of 63.2% of all respondents being from Germany, Germany was treated as an own geographical area in the analysis. The age distribution is skewed to the right as 53.1% of the respondents are in age group 18-24. The majority (54,2%) are students, followed by Full-Time employees (28.4%), Part-Time employees (9.9%), Self-Employed participants (4.5%), Retired (2.7%) and respondents with an inability to work (0.3%). This distribution is also reflected in the marital status of the respondents as well as the level of education. 67% indicated that they are single, 19.7% being married and 3.8% are divorced or widowed. When analyzing the level of education of the participants, it becomes apparent that
only a small fraction (0.6%) attended High School without a degree. 34.3% of all respondents obtained a High School degree. Besides, 20.6% obtained an Apprenticeship Degree. In the tertiary education field, most respondents have a Bachelor Degree or equivalent, with a total percentage of 25.4% of all respondents. 17.3% completed a Master Degree or equivalent and 1.8% followed and completed a PhD program. A detailed overview of the sample characteristics can be found in the appendix (Appendix, Part 1).
3.3. Designing Questions
The questions that were used in the survey questionnaire are based on the operationalization (see Fig. 3 below) and were adapted from existing frameworks. The questionnaire used can be found in the appendix (Appendix, Part 2).
Trusting Base
Variable Source Questions
Personality Personal Innovative- ness
Rosen et al. (2005)
9 Likert Scale Questions
Cognitive Perceived
Ease-of-Use Davis (1989)
4 Likert Scale Questions
Cognitive Perceived
Usefulness
/ Existing features + General
Cognitive Reputation
(Data Security)
Liao et al. (2019)
5 Likert Scale Questions
Knowledge Experiences / Usage
WTP Price Le-Gall-Ely (2009) Max. Price Potential Correlations Age, Gender, Nationality, Education etc.
/ Demographic Data Weighting Trusting Bases’ Impact on WTP All trusting bases variables
/ Ranking; Multiple Linear Regression
Willingness to pay (WTP)
[image:5.595.314.526.261.537.2]Max. Price / Max. Price WTP in €
Fig. 3: Operationalization of trusting bases, WTP and weighting of trusting bases
In the second half of the survey, the respondent was asked to choose for the most trustworthy company offering voice assistants and indicate their level of concern regarding data security, storage and access through third parties in the process of voice assistant usage (Reputation, Cognitive Base). Furthermore, the WTP was elaborated upon asking for the maximum price respondents are willing to pay, either for a device providing all functions, a device providing all functions that were marked as useful in the previous step, and a device only offering the basic functions (music and information function). These results were combined into a single variable “WTP” to get a more comprehensive impression and measure relationships between WTP and trust. Lastly, the respondents were requested to prioritise the factors Price, Ease-of-Use, Usefulness based on functions, Data Security and Novelty. This way, next to (possible) extreme choices in the Likert Scales and the statistical analyses using Multiple Linear Regression, findings about the importance and weight of the different trusting bases can be analysed.
To keep the respondents’ attention, the demographic data such as gender, age group, nationality and highest level of education concluded the survey.
To simplify the data for the quantitative analysis, open questions were avoided. Furthermore, as a measurement tool for the response to the statement-related questions, a Five-Point Likert Scale was used. This scale included options for the respondents to choose between the items ‘Strongly Agree – Agree – Neither Agree nor Disagree – Disagree – Strongly Disagree’. The Likert Scale is described as “one of the most fundamental and frequently used psychometric tools” in research (Joshi et al., 2015, p. 396). In terms of neutrality, the option of a symmetric scale to provide the respondent the possibility of choosing “any response in a balanced and symmetric way in either directions” (Joshi et al., 2015, p. 397) which should prevent distortion of results. Nevertheless, in the context of Data Security, the neutral option has not been offered due to the nature of the question (‘Are you concerned…?’ with the options Not at all concerned – Not concerned – Concerned – Very concerned) which implies a binary variable with distinct intensity.
In total, the questionnaire encompasses 17 questions (16 for Non-Users), each representing either a specific question or a question block of similar questions, whereas question blocks were exclusively used in the context of Likert-Scales. The time used to complete the survey is approximately five minutes and can be done online at any moment in the period of three weeks, using any display device that has an internet connection (Computer, Tablet, Smartphone etc.).
3.4. Data Collection
An online survey is considered to be the most appropriate survey type as the survey is about trust in Smart Home Voice Assistants which are internet-based devices. Thus, the target group of users and potential users are mostly current users of the internet. Moreover, in order to investigate potential moderator and/or correlating variables relating to differences in nationality, an online survey was useful to facilitate time-efficient and effective participation around the globe.
The focus on an international sample was also supported by the original instruction language, English. As a second option, the survey could also be conducted in German to enable a diversified sample in terms of age groups and facilitate participation for the age groups 45+ that possibly do not speak English fluently (anymore).
Distribution channels used were the test pool platform SONA of the Behavioural, Management and Social Sciences (BMS) Faculty of the University of Twente, as well as Social Media (Facebook) and a circle of friends and acquaintances. However, the survey was conducted anonymously to ensure confidentiality. All respondents in the survey participated on a voluntary basis with the possibility to interrupt and continue at a later moment in time.
4. ANALYSIS
The questionnaire is being evaluated using SPSS. The Likert-Scale based responses of each question will be analysed to identify overall impressions of the personality, cognitive and knowledge trusting bases. The difference in relevance and the differing impact of the trusting bases on WTP will be researched 1. using the prioritization ranking to obtain an impression about what consumers perceive to be the most crucial trusting base and 2. Performing a Multiple Linear Regression to detect statistical significance for the influence of the trusting bases on WTP. Moreover, associations (correlations) between the demographic variables Age Group, Gender, Education, Geographical Areas and the trusting bases are investigated as well as potential moderating effects on the trust-WTP relationship. A detailed summary of the Likert-Scale analysis can be found in the Appendix (Appendix, Part 3).
4.1. Analysis of the trusting bases
4.1.1. Personality Trusting Base
In the analysis, it becomes apparent that the sample values the ability to find any information only whenever they want, 93% either agreed or strongly agreed to this statement. Another crucial factor is the ability to access the internet anytime and anywhere they would like to (90.4%). For both statements, ‘Strongly agree’ is the most chosen option (56.9% respectively 56.1%). When looking at their attitude towards the persuasion of the newest technology trends, its potential to provide far-reaching solutions and endless possibilities, the respondents on average have a rather neutral opinion with a median of 3 (=Neither agree nor disagree).
However, ‘Agree’ was the most chosen option when reflecting about the positive influence of technology on their personal accomplishments (49%). Another 15.2% strongly agreed, leading to 64.2% agreement to this statement.
4.1.2. Cognitive Trusting Base
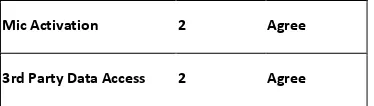
Both Users and Non-Users of Smart Home Voice Assistants agreed that voice assistants have an extensive perceived ease-of-use with a median of 2 (=’Agree’) for each question. These agreements were represented in all aspects of ease-of-use. The general impression is that the usage is easy to learn, clear and understandable and that dealing with a voice assistant is easy (or seems easy for Non-Users) to become skillful at.
In the second sub-dimension of the cognitive trusting base, perceived usefulness, the general usefulness as well as the usefulness of different functions provided by voice assistants in a Smart Home context were investigated.
In general, Smart Home Voice Assistants such as Amazon Echo (Alexa) or Google Home are perceived as useful or very useful by 72.3% of the respondents. According to the results, the most useful Smart Home Voice Assistants functions for the sample are the calendar function (considered to be useful or very useful by 89%), which includes setting up and reminding about appointments, and the function to provide information about several topics, such as traffic information, weather forecasts and/or news (90.1%). Other features relevant for the respondents when using a Smart Home device are the music function (86.5%) which consists of the usage of music streaming services such as Apple Music or Spotify and radio streaming, as well as the call function (80%) to communicate in telephone calls via the Voice Assistant. Functions verified as ‘Useful’ but not of major relevance are the recipe function (68.7%) and the connection with thermostats (65.4%), lights (75.5%), robot vacuum cleaners (52.1%), other Smart Home Speakers (64.4%) and the use of these devices as a dictionary and/or a calculator (74%).
In the survey, the gaming function was considered to be of least importance, least marked with the options ‘Useful’ or ‘Very Useful’ (24%). Other functions that does not provide usefulness for the respondents are the order function with only 34,7% indicating it as either useful or very useful (purchasing products that are linked to Google or Amazon by voice ordering), operating the coffee machine (46.7%) through Smart Home Voice Assistants and the connection of cameras with these devices (47.6%). Regarding the last sub-dimension of the cognitive trusting base, namely ‘Reputation’, as described in the literature review, the data security issue arises. The participants indicated that they are concerned about the security of their data and privacy. In particular, significant concerns about the continuous listening of the device and unauthorized purchases through third parties, that make use of the ordering function, arise. Another consideration is the encrypting of data collected by the device and transferred to the cloud that evokes users’ concerns. Moreover, third parties accessing the data is also a major concern. Lastly, the microphone activation without direct interaction is feared. Across the analysis of this dimension, lower means in answers have been identified. This represents higher significance for the relevance of this aspect influencing trust. The sample is to a high extent concerned about their data being collected, processed and stored by the multi-national companies such as Google, Microsoft or Amazon. This is further displayed in the answers when asking for the most trustworthy company. There is not a single company offering Smart Home Speakers that seems to be very trustworthy for the participants, all results (30% Google, 22.1% Amazon, 24.1% Microsoft and 6.4%
Apple, which was mentioned upon request) are very close by and represent a similar level of trustworthiness.
A fraction of 14% of all respondents indicated that they do not trust any of these companies with some stating that this is due to the fact that all of the mentioned companies have their servers located in the United States of America (USA).
4.1.3. Knowledge Trusting Base
Of the 370 respondents, 206 (55.67%) indicated that they are current users of voice assistants. The voice assistant with the highest number of users is Apple’s Siri (36.29%), followed by Google Assistant (29.62%) and Amazon’s Alexa (29.26%). Microsoft Cortana is a less used IoT device (3.33%). Lastly, other voice assistants used (1.48%) are Bixby and Homey. Most users of voice assistants use their device daily (35%) or 2-3 times a week (25.7%). 8.3% described their usage frequency as ‘once a week’, whereas 8.7% use a VA every two weeks. The percentage of total users that use a voice assistant only once a month or less is 22.3%.
It becomes apparent that Amazon Echo (Alexa) is the device that has the highest usage frequency. 62.18% of the Alexa users mentioned that they are using the assistant on a daily basis. The voice assistant that is used the less (in terms of frequency) is Apple’s Siri (23.7%). Thus, Apple’s Siri is the device with the highest numbers of users but the lowest usage frequency.
4.1.4. Self-perceived Relevance of Trusting
Bases
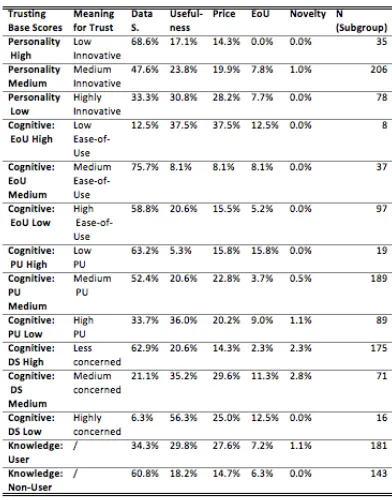
In the ranking of purchasing factors, the respondents were requested to prioritise multiple factors, each being related to a certain sub-dimension of a trusting base. The analysis supports the idea of data security being a relevant actor in a purchasing decision. The ranking indicates that Data Security (46%) is the number 1 priority, followed by Usefulness (24.7%). In the table (Fig.4), ranking results according to the scores given in each trusting base dimension are seen (e.g. Personality Base: Personal Innovativeness, Cognitive Base: Ease-of-Use, Perceived Usefulness, Data Security Concerns, Knowledge Base: Users, Non-Users).
From these results, it is apparent that Data Security as a purchasing factor is highly valued by low innovative respondents (68.6% of this group), respondents with a medium perceived ease-of-use (75.5%) and respondents with a low perceived usefulness of these devices (33.7%). The majority of Non-Users (60.8%) placed this factor as a priority.
Usefulness is prioritised by respondents that are highly concerned about Data Security (56.3%), respondents that perceive the usefulness to be high (36.0%), the Ease-of-use to be low (37.5%) and are highly innovative (30.8%). Users generally place usefulness higher than Non-Users (29.8%).
Ease-of-Use is emphasized as the key purchasing factor for medium innovative respondents (7.8% of this group placed it as their priority), perceive the Ease-of-Use to be low (12.5%), the Perceived Usefulness to be low (15.8%) and are highly concerned about their data (12.5%). Users highlighted Ease-of-Use to be a priority more often than Non-Users, 7.2% of the Users chose Ease-of-Use as the most relevant factor for a purchasing decision.
The factor Novelty has been identified to play a minor role in purchasing decisions as most groups did not prioritise this factor, leading to a maximum value of 2.8% of the data medium concerned respondents.
Fig. 4: Number 1 priority purchasing factors within subgroups of trusting bases
4.2. Willingness to Pay (WTP)
In order to measure willingness to pay for a Smart Home Voice Assistant in Euro (€), the respondents were asked to indicate maximum prices that they would pay for a stand-alone Smart Home device that (1) provides all functions mentioned in the ‘Usefulness’ part (2) provides all functions you consider to be useful and (3) provides only very basic function, e.g. music streaming service/radio function and information function.
The means of the max. price are (1) €139.12 with a standard deviation (SD) of €96.757, (2) €118.86 with a SD of €66.86 and (3) €78.6 with a SD of €73.734. It can be seen that there is a very high price range of €244 for a level 1 device, €247 for a level 2 device and €242 for a level 3 device, with the lowest WTP price being €0 and the highest WTP price being €500.
4.3. Correlations between Demographic
Variables and Trusting Bases
To assess the impact of the demographic variables on the model, correlations between the demographics and the trusting bases will be identified. This allows for a deeper insight of trust and helps to set implications for the objective of increasing trust. A comprehensive overview about the analysis including all correlation coefficients can be found in the appendix (Appendix, Part 5).
4.3.1. Age Group and Trust in Voice Assistants
The SPSS bivariate correlation analysis (Spearman’s Rho correlation) made apparent that age and perceived ease-of-use are correlated. The responses to three of the four Likert-Scale questions suggest a significant correlation with the variable age group. Younger people in this sample assume the ease-of-use to be higher than the perceived ease-of-use from older respondents. Another weak to moderate correlation has been found between age and usefulness for the functions calendar, call and lights. Younger age groups show lower means, reflecting higher perceived usefulness of these functions than older age group perceive them to be (see Appendix, Fig. 5.4 for a comparison of means between age groups and trust factors across significant correlations).4.3.2. Gender and Trust in Voice Assistants
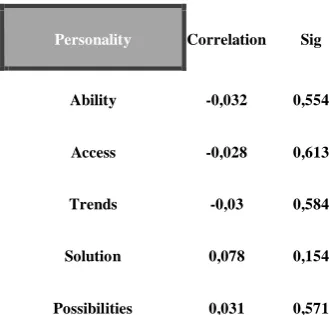
It appears that Gender affects the personality trusting base (personal innovativeness dimension) in six out of nine statements. The agreement of the desire of internet access, technology trends, technology as an efficiency tool to achieve more accomplishments as well as the solutions are more present in responses of men. Regarding the technology drawbacks, time waste and isolation issues are perceived to be stronger by women. Concluding, women of this sample do have a more negative attitude towards technology and are less personal innovative. Concerning the effect of Gender on the cognitive trusting base, correlations between Gender and the dimensions Perceived Usefulness and Reputation (Data Security) could be verified. The general usefulness of Smart Home Voice Assistants is perceived to be higher by men. A comparison of the mean values of male and female can be found in the Appendix (Fig.5.5). Interestingly, the trusting (sub-)dimension with the most correlation is Data Security. All 4 statement show correlations with the variable Gender. It can be seen that men are generally more concerned about data and privacy issues relating to technology than women. This can be proven by the higher means of females, which in this case represent less concerns.4.3.3. Education and Trust in Voice Assistants
When looking at the correlation between education and the trusting bases, education seems to affect the perceived ease-of-use (cognitive trusting base), as well as the perceived usefulness in terms of the call and camera functions.Moreover, the personality base, more specifically personal innovativeness correlates with education. Technology trends, the attitude towards new possibilities Technology provides and the belief in new technology to increase personal accomplishments are more agreed to by lower educational groups. Moreover, the higher the educational group, the lower the perceived ease-of-use (see Appendix, Fig. 5.6).
4.3.4. Geographical Area (Nationality) and
Trust in Voice Assistants
[image:8.595.76.272.219.469.2]4.4. Identifying the most relevant
trusting
base(s):
Multiple
Linear
Regression
The identification of the most crucial trusting base(s) affecting the willingness to pay (WTP) for a voice assistant was done using a Multiple Linear Regression in SPSS. Hereby, the scores of the questions related to each trusting base sub-dimension (e.g. Personality Base: Personal Innovativeness, Cognitive Base: Perceived Ease-of-Use, Perceived Usefulness and Reputation/Data Security) were thought to be independent variables affecting the dependent variable WTP. When running the analysis, the knowledge base factor Usage has been excluded from SPSS, resulting in no support for hypothesis H5.
The resulting regression equation equals to:
WTP = 581.862-3.374*D+3.493*PE+8.586*PU+3.013*PI
Whereas:
D = Data Security Concerns (Cognitive trusting base) PE = Perceived Ease-of-use (Cognitive trusting base)
PU = Perceived Usefulness (Cognitive trusting base) PI = Personal Innovativeness (Personality trusting base)
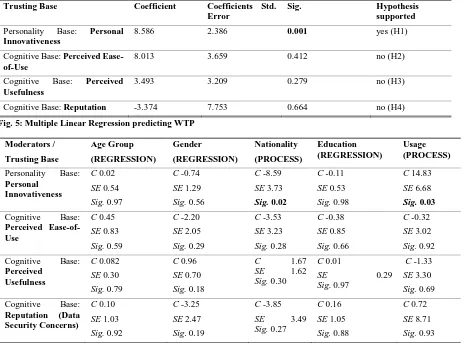
The model is statistically significant with p<0.01, thus p<Alpha (see Appendix, Part 6, Fig. 6.1), this means that, taking into account the positive coefficients, there is a significant positive relationship between trust and WTP. However, only the variable Perceived Usefulness is independently affecting WTP with a significance level being lower than Alpha = 0.05 (0.001), supporting H1 to be true.
The findings suggest that some variables are not affecting the WTP independently, however they might be significant in combination with other variables, therefore it is necessary to check for multicollinearity. As can be seen in the appendix (Appendix, Part 6, Fig. 6.2), multicollinearity can be excluded as all variance inflation factors (VIF) are ranged between 1.040 and 1.389. This means that it is not possible to predict any of the trusting base variables from the others.
Trusting Base Coefficient Coefficients Std.
Error
Sig. Hypothesis
supported
Personality Base: Personal Innovativeness
8.586 2.386 0.001 yes (H1)
Cognitive Base: Perceived Ease-of-Use
8.013 3.659 0.412 no (H2)
Cognitive Base: Perceived Usefulness
3.493 3.209 0.279 no (H3)
[image:9.595.73.537.314.657.2]Cognitive Base: Reputation -3.374 7.753 0.664 no (H4)
Fig. 5: Multiple Linear Regression predicting WTP
Fig. 6: Identification of Moderators
4.5. Demographic Variables moderating
the Trust - WTP Effect
When identifying demographic variables potentially moderating the effect between the trusting bases and WTP, multiple linear regressions with interaction variables as well as the Hayes’ PROCESS function in SPSS has been used. Whereas no significant moderator has been identified for the significant Perceived Usefulness effect on WTP, two findings should be noted.
It becomes apparent that Nationality, allocated along various geographical areas, moderates the Personal Innovativeness – WTP relationship. Particularly, the European Area Nationalities (excluding Germany) significantly moderate this effect (<0.02).
Moreover, another significant moderator in the Personal Innovativeness – WTP relationship is Usage (p<0.03). When analyzing other potential moderators, no significance emerged (see Fig. 6 for coefficients, standard error of the estimate and significance levels).
Moderators / Trusting Base Age Group (REGRESSION) Gender (REGRESSION) Nationality (PROCESS) Education (REGRESSION) Usage (PROCESS)
Personality Base: Personal
Innovativeness
C 0.02
SE 0.54
Sig. 0.97
C -0.74
SE 1.29
Sig. 0.56
C -8.59
SE 3.73
Sig. 0.02
C -0.11
SE 0.53
Sig. 0.98
C 14.83
SE 6.68
Sig. 0.03
Cognitive Base: Perceived Ease-of-Use
C 0.45
SE 0.83
Sig. 0.59
C -2.20
SE 2.05
Sig. 0.29
C -3.53
SE 3.23
Sig. 0.28
C -0.38
SE 0.85
Sig. 0.66
C -0.32
SE 3.02
Sig. 0.92
Cognitive Base: Perceived
Usefulness
C 0.082
SE 0.30
Sig. 0.79
C 0.96
SE 0.70
Sig. 0.18
C 1.67
SE 1.62
Sig. 0.30
C 0.01
SE 0.29
Sig. 0.97
C -1.33
SE 3.30
Sig. 0.69
Cognitive Base: Reputation (Data Security Concerns)
C 0.10
SE 1.03
Sig. 0.92
C -3.25
SE 2.47
Sig. 0.19
C -3.85
SE 3.49
Sig. 0.27
C 0.16
SE 1.05
Sig. 0.88
C 0.72
SE 8.71
5. DISCUSSION AND IMPLICATIONS
In the first part of the discussion, findings derived from the analysis are evaluated with the objective of identifying the most relevant trusting base. Subsequently, implications are drawn based on the analysis, resulting in responding to the main research question of this paper, namely how to increase trust in voice assistants for increasing consumers’ willingness-to-pay (WTP).5.1. Findings based on the Correlations
and Multiple Linear Regression
The findings resulting out of the evaluation of the Likert-Scales, the bivariate correlation analysis and the Multiple Linear Regression suggest that the trusting model is basically valid. All trusting bases were thought to be relevant by the respondents and play a major role in the trust of voice assistants. The most useful functions are the calendar and information function, followed by music and call functions. Game Apps on Smart Home Voice Assistants are generally perceived to be of least importance.
Correlations found suggest perceived ease-of-use to be higher for younger age groups and indicate a higher perceived usefulness for these ages in terms of call, light and camera function. Men generally perceive voice assistants to have a higher usefulness but simultaneously have more doubt when it comes to data security issues. The findings provide evidence that women have less personal innovativeness. Relating to education, less educated groups are identified to have a more positive attitude towards technology.
Concerning the most relevant trusting base for WTP, the cognitive trusting base appears to have a major relevance for the respondents. Not only in the Likert-Scale more extreme answers (resulting in lower/higher means) emerged, but also the fact that two sub-dimensions of the cognitive trusting base (Perceived Usefulness and Data Security Concerns) are listed in the top 3 prioritization ranking. To verify this subjective judgement, a significant (positive) effect of Perceived Usefulness on WTP has been found in the Multiple Linear Regression, thus a positive relationship between Perceived Usefulness and WTP can be assumed, which in turn supports hypothesis H3 to be true. Therefore, the cognitive trusting base, more precisely the variable Perceived Usefulness can be proven to have the most relevance for the Trust-WTP relation.
5.2. Implications: How to increase Trust
in Smart Home Voice Assistants
Resulting from the findings obtained in the analysis, some general implications can be drawn. The main focus for voice assistant providers should be on the perceived usefulness trust dimension, as this is identified to be the most crucial one having an effect on consumers’ willingness-to-pay (WTP).
Answering the main research question, the usefulness can be increased by adding various new application fields and providing new functions that highlight productivity rather than entertainment. These include e.g. security features, connection to TVs and the use of voice assistants in cars. Moreover, elderly care might also be an innovative application field. In order to embrace this opportunity, more detailed explanations are necessary to advice also less educated people. This field is especially interesting
with regard to the findings that older people do not necessarily have less personal innovativeness and Non-Users generally perceive Smart Home Voice Assistants to have a high ease-of-use and are easy to learn.
To exploit the potential voice assistants (especially Smart Home devices) have for a company’s marketing, potential future users should be targeted using the data security topic. As the results suggest major safety concerns, more transparency should be provided and also advertised in the pre-purchase marketing, in particular related to men as they have higher degree of doubts.
7. CONCLUSION
In this paper, the topic trust in Smart Home Voice Assistants was dealt with. More specifically, an answer of the research question of how to increase trust in these devices with the objective of increasing the willingness to pay was aimed at. Next to the literature review that provided components of trust (trusting bases), a quantitative approach was used. In the analysis of the survey with a sample size of 370 respondents, major findings suggested the relevance of the cognitive trusting base, including perceived usefulness, to be the most relevant trusting base/dimension for WTP as this has been the only trusting dimension marked as statistically significant. No moderators impacting the Perceived Usefulness - WTP effect have been found. However, the findings yield correlations between the trusting bases and the demographic variables Age, Gender and Education. Concluding, the perceived usefulness trusting dimension should be tackled by focusing on the development of innovative, productive features for Smart Home Voice Assistants that will increase customer value and their trust in these IoT-devices.
6. LIMITATIONS AND FUTURE
RESEARCH
Due to a restriction in resources, the study conducted in this paper has some limitations. First of all, most respondents in the survey are students with an age ranging from 18-34 and a High School or Bachelor Degree which might decrease the representation of this sample as a whole population. Moreover, cross-cultural differences could not be observed due to a limited number of participants from other countries than Germany. This provides an interesting starting point for further research in the field of trust in voice assistants. Moreover, as identified in this paper, usefulness and new application fields play a major role to promote the trust in Smart Home Devices. Options for elderly care and their consequences for trust could be investigated especially in regard to the lack of caregivers. Lastly, data security focused marketing is a subject to look further into.
8. ACKNOWLEDGMENTS
REFERENCES
Ajzen, I. (1991). The Theory of Planned Behavior.
Organizational Behavior and Human Decision Processes 50, 179-211. Online. Accessed 10.05.2019 via http://citeseerx.ist.psu.edu/viewdoc/download?doi=10.1.1 .317.9673&rep=rep1&type=pdf
Ba, S. (n.d.). Evidence of the Effect of Trust Building Technology in Electronic Markets: Price Premiums and Buyer Behavior. MIS Quarterly 26 (3).
Bakaki, Z. & Bernauer, T. (2016). Measuring and explaining the willingness to pay for forest conservation: evidence from a survey experiment in Brazil. Online.
Accessed 02.06.2019 via
https://iopscience.iop.org/article/10.1088/1748-9326/11/11/114001/pdf
Brill, T. M., Munoz, L. & Miller, R. J. (2018). Siri, Alexa, and Other Digital Assistants : A Study of Customer Satisfaction With Artificial Intelligence Applications.
Summer American Marketing Association Proceedings.
Online. Accessed 05.05.2019 via
https://www.mendeley.com/catalogue/siri-alexa-other- digital-assistants-study-customer-satisfaction-artificial-intelligence-applications/
Budzinski, O., Noskova, V. & Zhang, X. (2018). The Brave New World of Digital Personal Assistants: Benefits and Challenges from an Economic Perspective. Ilmenau Economics Discussion Papers 24 (118). Online. Accessed
18.05.2019 via
https://www.db-thueringen.de/servlets/MCRFileNodeServlet/dbt_derivate _00043900/Diskussionspapier_Nr_118.pdf
Buvat, J., Jacobs, K., Taylor, M., Khadikar, A. & Sengupta, A. (2018). Conversational Commerce: Why Consumers Are Embracing Voice Assistants in Their Lives. Online. Accessed 19.03.2019 via
https://www.capgemini.com/consulting/wp-content/uploads/sites/30/2018/01/conversational_commer ce_research_report.pdf
Chowdhury, S. (2018). Avoidance Attitudes towards Virtual Assistants. Online. Accessed 19.03.2019 via https://www.researchgate.net/publication/325195832_Av oidance_Attitudes_towards_Virtual_Assistants
Chrysochou, P. (2017). Consumer behavior Research Methods. Online. Accessed 15.05.2019 via https://www.researchgate.net/publication/315109715_Co nsumer_Behavior_Research_Methods
Chung, H., Iorga, M., Voas, J. & Lee, S. (2017). Alexa, Can I Trust You? Online. Accessed 22.04.2019 via https://ws680.nist.gov/publication/get_pdf.cfm?pub_id=9 23459
Dağlı, M., Lockton, D. & Byrne, D. (2018). Designing for Trust Exploring Trust and Collaboration in Conversational
Agents for E-commerce. Online. Accessed 19.03.2019 via http://mericdagli.com/mdagli_designing-for-trust.pdf
Davis, F. (1989). A Technology Acceptance Model for Empirically Testing New End-User Information Systems: Theory and Results. Doctoral Dissertation Sloan School of Management MIT 1985. Online. Accessed 02.04.2019 via https://dspace.mit.edu/handle/1721.1/15192
Daubert, J., Wiesmaier, A. & Kikiras, P. (2015). A view on privacy & trust in IoT. 2015 IEEE International Conference on Communication Workshop, ICCW 2015, 2665-2670. Online. Accessed 09.05.2019 via https://ieeexplore.ieee.org/document/7247581
De Kruijff, R.W. (2018). Technology Acceptance of the Smart Speaker Exploring factors affecting the Use Intention of an emerging technology. Online. Accessed
01.05.2019 via
http://www.scriptiesonline.uba.uva.nl/document/668183
Google (2017). Google Event, 2017 4 October New Google Home Mini). Video. Accessed 12.05.2019 via https://www.youtube.com/watch?v=Fw6f9v4IkEg
Grand View Research. (2016). Intelligent Virtual Assistant (IVA) Market Size, Industry Report, 2024.
Online. Accessed 04.04.2019 via
http://www.grandviewresearch.com/industry-analysis/intelligent- virtual-assistant-industry.
Han, B. & Windsor, J.C. (2011). User’s Willingness to Pay on Social Network Sites. Journal of Computer Information Systems 51 (4), 31-40. Online. Accessed 02.06.2019 via https://www.researchgate.net/publication/282736797_Us er's_willingness_to_pay_on_social_network_sites
Hartley, J. (2013). Some thoughts on Likert-scales.
International Journal of Clinical and Health Psychology (2013) 13, 83-86. Online. Accessed 10.05.2019 via http://eprints.keele.ac.uk/2688/1/hartley_2014.pdf
Hoy, M. (2018). Alexa, Siri, Cortana, and More: An Introduction to Voice Assistants. Medical Reference Services Quarterly 37 (1) 81-88. Online. Accessed
19.03.2018 via
https://www.mendeley.com/catalogue/alexa-siri-cortana-more-introduction-voice-assistants/
Huang, C. (2017). Cognitive factors in predicting continued use of information systems with technology adoption models. Information Research 22 (2). Online.
Accessed 11.05.2019 via
http://www.informationr.net/ir/22-2/paper748.html
Joshi, A., Kale, S., Chandel, S. & Pal, D.K. (2015). Likert Scale: Explored and Explained. British Journal of Applied Science & Technology 7 (4). 396-403. Online. Accessed
15.05.2019 via
Le Gall-Ely, M. (2009). Definition, Measurement and Determinants of the Consumers’ Willingness to Pay: A Critical Synthesis and Directions for Further Research. Online. Accessed 02.06.2019 via https://hal.archives-ouvertes.fr/hal-00522828/document
Lei, X., Tu, G., Liu, A.X., Li, C. & Xie, T. (2017). The Insecurity of Home Digital Voice Assistants-Vulnerabilities, Attacks and Countermeasures. Online.
Accessed 02.05.2019 via
http://www.cse.msu.edu/~xietian1/paper/HDVA_Securit y-v2.pdf
Li, X., Hess, T.J. & Valacich, J.S. (2008). Why do we trust new technology? A study of initial trust formation with organizational information systems. Online. Accessed
01.04.2019 via
https://www.sciencedirect.com/science/article/abs/pii/S09 63868708000036
Liao, Y., Vitak, J., Kumar, P., Zimmer, M. & Kritikos, K. (2019). Understanding the Role of Privacy and Trust in Intelligent Personal Assistant Adoption. Online. Accessed 18.03.2019 via https://pearl.umd.edu/wp-content/uploads/2019/01/Liao_etal-2019-iconference.pdf
Mayer, R.C., Davis, J.H. & Schoorman, F.D. (1995). An Integrative Model of Organizational Trust. Academy of Management Review 20 (3), 709-734. Online. Accessed
05.05.2019 via
https://www.jstor.org/stable/258792?seq=1#metadata_inf o_tab_contents
McKnight, D.H., Carter, M., Thatcher, J.B. & Clay, P.F. (2011). Trust in a Specific Technology: An Investigation of its Components and Measures. Online. Accessed 05.05.2019 via
https://dl.acm.org/citation.cfm?id=1985353
Nasirian, F., Ahmadian, M. & Lee, O. (2017). AI-Based Voice Assistant Systems: Evaluating from the Interaction and Trust Perspectives. 23rd Americas Conference on Information Systems (AMCIS) 1-10. Online. Accessed
04.04.2019 via
https://aisel.aisnet.org/cgi/viewcontent.cgi?article=1032& context=amcis2017
Nocella, G., Hubbard, L. & Scarpa, R. (2009). Farm Animal Welfare, Consumer Willingness to Pay, and Trust: Results of a Cross-National survey. Online. Accessed
02.06. 2019 via
https://www.researchgate.net/publication/46513345_Far m_Animal_Welfare_Consumer_Willingness_to_Pay_and _Trust_Results_of_a_Cross-National_Survey
Purington, A., Taft, J.G., Sannon, S., Bozarova, N.M. & Hardman Taylor, S. (2017). “Alexa is my new BFF”: Social Roles, User Satisfaction, and Personification of the Amazon Echo. Online. Accessed 28.03.2019 via https://cpb-us
e1.wpmucdn.com/blogs.cornell.edu/dist/c/6136/files/201 3/12/Alexa_CHI_Revise_Submit-22ay4kx.pdf
Ramamurty, R., Morya, A., Karthik, L. Vijay, M. & Gupta, A. (2017). The Coming Intelligent Digital Assistant Era and its Impact on Online Platforms. Online. Accessed
18.03.2019 via
https://www.cognizant.com/whitepapers/the-coming- intelligent-digital-assistant-era-and-its-impact-on-online-platforms-codex2447.pdf
Rosen, P. (2005). The Effect of Personal Innovativeness on Technology Acceptance and Use. Online. Accessed
15.04. via
https://pdfs.semanticscholar.org/72dd/838836a261aae2a2 c0e4dfb1f34ac871ec9d.pdf
Rousseau, D.M., Sitkin, S.B., Burt, R.S. & Camerer, C. (1998). Not so different after all: A cross-discipline view of trust. The Academy of Management Review 23 (3).
Online. Accessed 13.04.2019 via
http://credit.ihmc.ens.fr/documents/trust%20management .pdf
Sabater, J. & Sierra, C. (2003). Review on computational trust and reputation models. Artificial Intelligence Review 24 (1) 33-60. Online. Accessed 03.05.2019 via http://www.iiia.csic.es/~jsabater/Publications/2005-AIR.pdf
Saffarizadeh, K., Boodraj, M. & Alashoor, T.M. (2017). Conversational Assistants: Investigating Privacy Concerns, Trust, and Self-Disclosure. Proceedings of the International Conference on Information Systems (ICIS) 2017, 0-12. Online. Accessed 02.05.2019 via https://www.researchgate.net/publication/320224088_Co nversational_Assistants_Investigating_Privacy_Concerns _Trust_and_Self-Disclosure
Soronen, H., Turunen, M. & Hakulinen, J. (2008). Voice Commands in a Home Environment - A Consumer Survey. Online. Accessed 20.03.2019 via https://tapla.cs.tut.fi/
Spoor, S.M. (2016). How can data generated by smart home devices help identify consumer needs? Online.
Accessed 18.05.2019 via
https://essay.utwente.nl/69990/1/Spoor_BA_BMS.pdf
Zheng, S., Apthorpe, N., Chetty, M. & Feamster, N. (2018). User Perceptions of Smart Home IoT Privacy.
Proc. ACM Hum.-Comput. Interact 2018 (2). Online.
Accessed 01.05.2019 via
APPENDIX
Part 1: Demographic data about respondents
Part 2: Survey
Part 3: Likert-Scale Question Analysis
Part 4: Self-perceived ranking of VA purchasing factors
Part 5: Correlations of trusting bases with demographic variables (5.1. Age Group, 5.2. Gender, 5.3. Education)
Part 6: Assessing the relevance of trusting bases for WTP and moderating effects: Multiple Linear Regression, Univariate Analysis of Variance and Multicollinearity checks
[image:13.595.64.259.257.425.2]PART 1: DEMOGRAPHIC DATA ABOUT RESPONDENTS
Fig. 1.1. : Gender of respondents (1=Female, 2=Male)
[image:13.595.61.261.490.646.2]Fig. 1.3: Age Groups of respondents
Country # RespondentsCountry2 Respondents
Austria 3 Lithuania 1
Brazil 2 Mexico 2
Bulgaria 2 Netherlands16
Canada 3 Pakistan 1
China 5 Poland 4
Congo 1 Portugal 2
Denmark 2 Russia 3
Egypt 2 South Africa2
France 3 Switzerland 2
Germany 234 Syria 1
Greece 2 Taiwan 1
Hungary 3 Turkey 3
India 3 UK 9
Indonesia1 USA 6
Iran 2 Vietnam 1
Latvia 1
Fig. 1.4: Nationalities of respondents
Fig 1.5: Geographical Visuliations of respondents’ nationalities, created via Excel Bing Maps
PART 2: SURVEY
Trust in Smart Home Voice Assistants
Start of Block: Block 5
Q22 Dear participant,
This survey is part of my Bachelor thesis in the study programme International Business Administration (University
of Twente). In my thesis, I aim at investigating different factors that are important for the trust in Smart Home
Voice Assistants like Amazon's Alexa, Google Home etc and how this correlates with age group, gender, nationality
and other variables. More specifically, I aim to assess possible factors that are the main reason of people having
trust/not having trust in voice assistants.
Explanation Smart Home Voice Assistants/Smart Speakers: Internet-based devices that allow you to interact with,
using a codeword (e.g. "Okay, Google" or "Alexa") followed by a command. This way, the devices provide different
functions, including entertainment and productivity features.
The survey will take approximately 5 minutes and is anonymous. All data is treated confidentially.
If you have any questions, please do not hesitate to contact me.
Thank you!
Rabea Adams
r.j.adams@student.utwente.nl
End of Block: Block 5
Start of Block: Default Question Block