A constant concern of all Holstein cattle farmers is to increase herd efficiency with the aim of maxi-mizing overall profit per cow. The achievement of such an objective requires a healthy animal capable of producing high quantities of high-quality milk and showing very good reproduction parameters. These attributes are based on an optimum system of heifer rearing.
The improvement of the overall heifer replace-ment system is a possible strategy how to minimise costs associated with a dairy herd. Growth and de-velopment of animals in the prepubertal period is of particular interest. Rearing heifers is a very impor-tant factor in dairy herd management that can be characterised as a long-term and high-cost period (Zanton and Heinrichs, 2005). In this respect, the growth rate of heifers is one of the most frequently
manipulated traits influencing age at first calving, lifetime productivity, and overall costs (Gabler et al., 2000).
The cost of rearing replacement heifers can be re-duced by accelerating the growth rate and by earlier breeding, thus decreasing the age at first calving (Hoffman et al., 1996). However, the reduction of the cost per production unit must be accompanied by the subsequent achievement of adequate produc-tion and reproducproduc-tion parameters of the animals (Strapák et al., 2005). The economic importance of age at first calving was reported by Šafus et al. (2005), who also pointed out the necessity of good reproduction and longevity parameters.
The management strategy for reducing costs per production unit by increased intensity of rearing and overall shortening of the non-productive
pe-The effect of growth and development intensity
in replacement heifers on economically important
traits of Holstein cattle in the Czech Republic
J. Bouška, M. Štípková, M. Krejčová, L. Bartoň
Institute of Animal Science, Prague-Uhříněves, Czech Republic
ABSTRACT: The objective of the study was to determine the effect of growth and development intensity in Holstein replacement heifers on economically important animal traits. The intensity of growth was assessed by the average live weight gain until 14 months of age. In addition, live weight and height at the sacrum at 14 months of age were analysed as indicators of growth and development when evaluating the length of productive life. The milk yield of first-calvers increased as the average daily live weight gain in the rearing period increased. An opposite tendency was recorded for cows in their second and third lactation and the total production also decreased with a higher growth rate of heifers. The analysis of the relationship between growth rate and the following reproduction traits revealed that the increased average daily live weight gain to 14 months was subsequently associated with reduced reproduction efficiency in cows. The differences between the groups with the lowest and the highest average live weight gains in the number of days open in the first and second calving interval were 26.78 and 17.47 days, respectively. This tendency was also confirmed in the other reproduction traits analysed. Productive life was sig-nificantly longer in animals with the lowest intensity of growth and development compared to the other groups (2.17 to 5.49 months, P < 0.01).
Keywords: Heifer; intensity of growth and development; average daily live weight gain; milk yield; reproduction; Holstein cattle
riod need not be efficient. Abeni et al. (2000) re-ported that a high daily live weight gain of reared heifers associated with earlier calvings resulted in a negative effect on milk yield and milk fat con-tent. Similar conclusions were also drawn by Van Amburgh et al. (1998), Waldo et al. (1998), and Mac- Donald et al. (2005).
Economic efficiency associated with dairy cattle management is a decisive factor in the successful development and operation of dairy farms. Šafus and Přibyl (2005) reported that the high efficiency of cows and achieved genetic gain in commercially important traits were a condition for efficient selec-tion and economically successful herds. The rearing of replacement heifers and especially understanding the relationship between the growth and develop-ment of animals and their subsequent production traits lays the foundation for further improvements in overall farm management strategy.
The objective of this study was to evaluate the relationship between the intensity of rearing and subsequent production and reproduction param-eters of dairy heifers.
MATERIAL AND METHODS
This experiment was performed on seven Holstein dairy farms. A total of 2 576 heifers born between January 1998 and December 2002 were included in the analysis. Pedigree values (breeding values of sire and dam per kg of milk) and subsequent milk yields of all heifers were recorded. The follow-ing growth and development parameters of heifers were collected:
– live weight and height at the sacrum
– average live weight gain from birth to 14 months of age
– age at first insemination – age at first calving
In the subsequent stage, the following characteris-tics of the same animals were determined: – milk, fat, and protein yield in the first, second,
and third lactation – reproduction traits:
heifers: – insemination index = number of in-seminations to conception
– interval from first insemination to conception
– inter-insemination interval = number of days between two consecutive in-seminations
cows: – interval from calving to first insemi-nation
– interval from calving to first concep-tion
– insemination index, first insemination to conception interval, inter-insemi-nation interval
– calving interval – number of days be-tween two consecutive calvings The animals were assigned to different groups according to their average daily live weight gain to 14 months of age as follows:
LWG1 – < 691 g LWG2 – 691–790 g LWG3 – 791–890 g LWG4 – > 890 g
[image:2.595.64.533.597.757.2]To evaluate the relationship between the inten-sity of growth and development of heifers and the length of their productive life, the animals were divided into groups according to live weight and
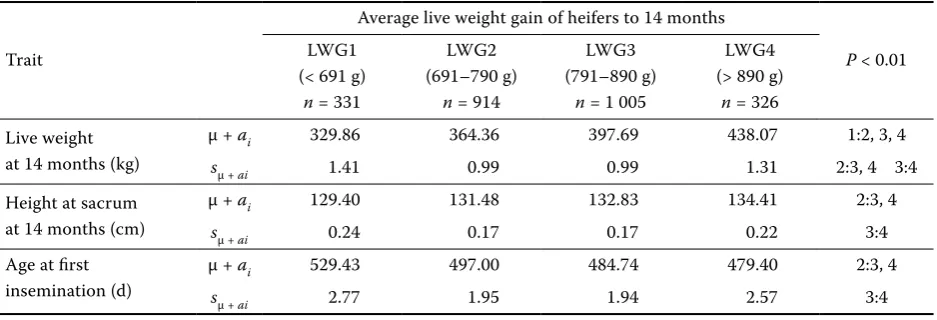
Table 1. The effect of growth intensity of heifers on their live weight, height at sacrum and age at first insemination
Trait
Average live weight gain of heifers to 14 months
P < 0.01 LWG1
(< 691 g)
n = 331
LWG2 (691–790 g)
n = 914
LWG3 (791–890 g)
n = 1 005
LWG4 (> 890 g)
n = 326 Live weight
at 14 months (kg)
μ + ai 329.86 364.36 397.69 438.07 1:2, 3, 4 sμ + ai 1.41 0.99 0.99 1.31 2:3, 4 3:4 Height at sacrum
at 14 months (cm)
μ + ai 129.40 131.48 132.83 134.41 2:3, 4
sμ + ai 0.24 0.17 0.17 0.22 3:4
Age at first insemination (d)
μ + ai 529.43 497.00 484.74 479.40 2:3, 4
height at the sacrum at 14 months of age as fol-lows:
Live weight: LW1 – < 351 kg LW2 – 351–390 kg LW3 – 391–430 kg LW4 – > 430 kg Height at sacrum: HS1 < 128 cm HS2 – 128–131 cm HS3 – 132–135 cm HS4 – > 135 cm
A multi-factorial analysis of variance was em-ployed to evaluate the experimental data. The anal-ysis was conducted using the GLM procedures of SAS (SAS, 2001). The following model with fixed effects was used:
yijkl= µ + SROi + Aj + Bk + eijkl
where:
µ = mean effect
SROi = effect of herd, year and calving season
Aj = effect of growth intensity (alternatively live weight
and height at sacrum)
Bk = effect of pedigree value for milk yield
eijkl = residual error
Duncan’s test was used for multiple comparisons of means and identification of differences. The level of significance was set at 1%.
RESULTS AND DISCUSSION
The effect of growth rate on live weight, height at the sacrum, and age at the first insemination is giv-en in Table 1. The results show that the maximum difference in live weight at 14 months between the
groups with the lowest and the highest growth rate is 108.21 kg. All the differences between the groups were significant (P < 0.01). The differences in height at the sacrum were also significant (P < 0.01) and ranged between 1.35 and 5.01 cm. The average age at the first insemination in heifers from group LWG1 was 529.43 days. Compared to the other groups it was higher by 32.43 to 50.03 days, and these diffe-rences were highly significant (P < 0.01).
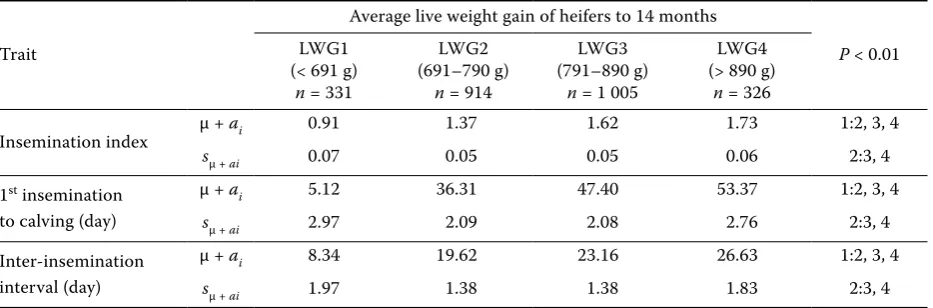
An important part of this study is the evaluation of the relationships between the intensity of growth of heifers up to 14 months of age and their subse-quent reproduction traits before the first calving. It is evident from the results shown in Table 2 that the higher average daily live weights were associ-ated with significantly higher (P < 0.01) insemination indexes and longer intervals from the first insemi-nation to conception. The maximum differences in the average insemination indexes and in the inter-vals from the first insemination to conception were 0.82 inseminations and 48.25 days, respectively.
A generally similar tendency was observed for re-production parameters in the first and second calv-ing interval. Table 3 gives the estimated reproduction parameters of cows in the first calving interval. It appears that the higher growth rate and especially the daily live weight gain exceeding 790 g negatively affect the subsequent reproduction efficiency of ani-mals. The interval from calving to conception as the most important parameter of cow fertility differed significantly (P < 0.01) between LWG1 and the other groups, with the differences ranging from 13.44 to 26.78 days. A similar tendency was also found in the interval from the first insemination to conception and in the insemination index.
[image:3.595.67.534.603.757.2]The effects of the growth rate of heifers on the fertility of cows in the second calving interval are
Table 2. The effect of growth intensity of heifers on reproduction traits before first calving
Trait
Average live weight gain of heifers to 14 months
P < 0.01 LWG1
(< 691 g)
n = 331
LWG2 (691–790 g)
n = 914
LWG3 (791–890 g)
n = 1 005
LWG4 (> 890 g)
n = 326
Insemination index μ + ai 0.91 1.37 1.62 1.73 1:2, 3, 4
sμ + ai 0.07 0.05 0.05 0.06 2:3, 4
1st insemination
to calving (day)
μ + ai 5.12 36.31 47.40 53.37 1:2, 3, 4
sμ + ai 2.97 2.09 2.08 2.76 2:3, 4
Inter-insemination interval (day)
μ + ai 8.34 19.62 23.16 26.63 1:2, 3, 4
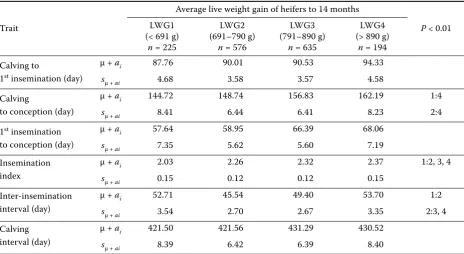
summarised in Table 4. Again, it is evident that the increased growth rate of heifers resulted in their reduced subsequent reproduction efficiency. Calving to conception intervals in animals from groups LWG2, LWG3, and LWG4 increased by 4.02, 12.11, and 17.47, respectively, and differed signifi-cantly (P < 0.01) between LWG4 and both LWG1
[image:4.595.67.531.101.356.2]and LWG2. A similar tendency was observed in the insemination index. No significant differences were found in the remaining traits, and therefore it can be established that the differences in reproduction traits between the groups in the second calving interval were generally lower compared to the first calving interval. The cause might be the intensity
Table 3. The effect of growth intensity of heifers on reproduction traits after first calving (first calving interval)
Trait
Average live weight gain of heifers to 14 months
P < 0.01 LWG1
(< 691 g)
n = 302
LWG2 (691–790 g)
n = 812
LWG3 (791–890 g)
n = 908
LWG4 (> 890 g)
n = 287 Calving to
1st insemination (day)
μ + ai 86.28 90.64 91.05 90.79
sμ + ai 4.25 3.39 3.34 3.97
Calving
to conception (day)
μ + ai 134.29 147.73 160.20 161.07 1:2, 3, 4
sμ + ai 8.01 6.38 6.29 7.48 2:3, 4
1st insemination
to conception (day)
μ + ai 47.96 56.87 68.88 70.53 1:3, 4
sμ + ai 6.97 5.55 5.47 6.50 2:3, 4
Insemination index
μ + ai 2.07 2.16 2.49 2.51 1:3, 4
sμ + ai 0.16 0.12 0.12 0.15 2:3, 4
Inter-insemination interval (day)
μ + ai 47.71 53.15 52.49 52.81 1:2, 3
sμ + ai 3.32 2.61 2.51 3.00
Calving interval (day)
μ + ai 408.53 416.87 424.89 429.52 1:3, 4
sμ + ai 8.31 6.78 6.67 7.85 2:4
Table 4. The effect of growth intensity of heifers on reproduction traits after second calving (second calving interval)
Trait
Average live weight gain of heifers to 14 months
P < 0.01 LWG1
(< 691 g)
n = 225
LWG2 (691–790 g)
n = 576
LWG3 (791–890 g)
n = 635
LWG4 (> 890 g)
n = 194 Calving to
1st insemination (day)
μ + ai 87.76 90.01 90.53 94.33
sμ + ai 4.68 3.58 3.57 4.58
Calving
to conception (day)
μ + ai 144.72 148.74 156.83 162.19 1:4
sμ + ai 8.41 6.44 6.41 8.23 2:4
1st insemination
to conception (day)
μ + ai 57.64 58.95 66.39 68.06
sμ + ai 7.35 5.62 5.60 7.19
Insemination index
μ + ai 2.03 2.26 2.32 2.37 1:2, 3, 4
sμ + ai 0.15 0.12 0.12 0.15
Inter-insemination interval (day)
μ + ai 52.71 45.54 49.40 53.70 1:2
sμ + ai 3.54 2.70 2.67 3.35 2:3, 4
Calving interval (day)
μ + ai 421.50 421.56 431.29 430.52
[image:4.595.67.532.393.647.2]of selection of cows during the second calving in-terval, as in this period 25.5, 29.1, 30.14, and 32.4% of animals were negatively selected from groups LWG1, LWG2, LWG3, and LWG4, respectively.
Our results concerning the effect of growth rate on the insemination index of cows were not sup-ported by the findings of Pirlo et al. (1997), who reported similar levels of this reproduction trait in both groups of heifers (n = 15) reared with
differ-ent growth intensity. A similar response was also observed by Hoffman et al. (1996). On the con-trary, the relationship between the average daily live weight gain and reproduction traits as found in our study was confirmed by Van Amburgh et al. (1998) and Abeni et al. (2000).
The relationship between the live weight gain of replacement heifers and their subsequent milk production is an important factor for the
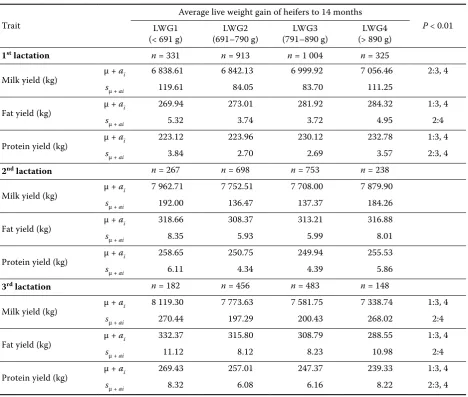
optimi-Table 5. The effect of growth intensity of heifers on their subsequent milk production
Trait
Average live weight gain of heifers to 14 months
P < 0.01 LWG1
(< 691 g) (691–790 g)LWG2 (791–890 g)LWG3 (> 890 g)LWG4
1st lactation n = 331 n = 913 n = 1 004 n = 325
Milk yield (kg) μ + ai 6 838.61 6 842.13 6 999.92 7 056.46 2:3, 4
sμ + ai 119.61 84.05 83.70 111.25
Fat yield (kg) μ + ai 269.94 273.01 281.92 284.32 1:3, 4
sμ + ai 5.32 3.74 3.72 4.95 2:4
Protein yield (kg) μ + ai 223.12 223.96 230.12 232.78 1:3, 4
sμ + ai 3.84 2.70 2.69 3.57 2:3, 4
2nd lactation n = 267 n = 698 n = 753 n = 238
Milk yield (kg) μ + ai 7 962.71 7 752.51 7 708.00 7 879.90
sμ + ai 192.00 136.47 137.37 184.26
Fat yield (kg) μ + ai 318.66 308.37 313.21 316.88
sμ + ai 8.35 5.93 5.99 8.01
Protein yield (kg) μ + ai 258.65 250.75 249.94 255.53
sμ + ai 6.11 4.34 4.39 5.86
3rd lactation n = 182 n = 456 n = 483 n = 148
Milk yield (kg) μ + ai 8 119.30 7 773.63 7 581.75 7 338.74 1:3, 4
sμ + ai 270.44 197.29 200.43 268.02 2:4
Fat yield (kg) μ + ai 332.37 315.80 308.79 288.55 1:3, 4
sμ + ai 11.12 8.12 8.23 10.98 2:4
Protein yield (kg) μ + ai 269.43 257.01 247.37 239.33 1:3, 4
[image:5.595.65.534.98.495.2]sμ + ai 8.32 6.08 6.16 8.22 2:3, 4
Table 6. The effect of growth intensity of heifers on the length of their productive life
Trait
Average live weight gain of heifers to 14 months
P < 0.01 LWG1
(< 691 g)
n = 331
LWG2 (691–790 g)
n = 914
LWG3 (791–890 g)
n = 1 005
LWG4 (> 890 g)
n = 326 Length of productive
life (months)
μ + ai 37.91 35.74 34.36 32.42 1:2, 3, 4
[image:5.595.63.533.527.615.2]zation of the rearing period. As shown in Table 5, heifers with the highest growth rate to 14 months (LWG4) also had the highest average milk yield in the first lactation (7 056.46 kg) and exceeded the other groups by 56.54 to 217.85 kg. Similar results were also observed for fat and protein yields in the first lactation. However, in the second and third lactation the highest milk yield was attained by the cows from group LWG1, with a maximum difference of 2 54.71 and 780.56 kg in the second and third lactation, respectively. The difference in milk yield between first-calvers (in their first lactation) and adult cows (in their third lactation) was 1 280.69, 931.50, 581.83, and only 282.28 kg in groups LWG1, LWG2, LWG3, and LWG4, respec-tively. Reduced milk yield, especially in the first lactation, was associated with increased growth intensity in the rearing period, as reported by Van Amburg et al. (1988) and Waldo et al. (1998). On the contrary, the results of the study of Zanton and Heinrichs (2005) indicate that the average daily weight gain of heifers should not exceed 800 g in order to maximise their milk yield in the first lac-tation, as a higher growth rate is inversely related to the milk yield of first-calvers. Our findings are consistent with the results of Abeni et al. (2000).
The length of cow’s productive life, i.e. the time in months between the first calving and removal from the herd, is an important indicator of herd efficiency. The relationship between the effect of growth inten-sity and the development of replacement heifers to 14 months on productive life is shown in Tables 6, 7, and 8. The effect of live weight gain on the length of
productive life is presented in Table 6. The animals from the groups with lower growth rates in the rear-ing period were found to stay in the herd longer. The average length of productive life in cows from LWG1 is 37.91 months and can be considered as very good and corresponding to the herd management strategy. The differences between LWG1 and the remaining groups ranged from 2.17 to 4.49 months and were statistically significant (P < 0.01).
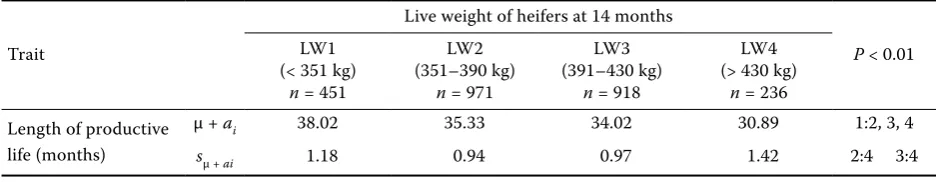
Essentially similar results were revealed by the analysis of the effect of live weight on the length of productive life (Table 7). The cows from LWG1 had an average productive life 2.69 to 7.13 longer (P < 0.01) than the cows from the other groups. Table 8 contains the results of productive life as affected by height at the sacrum at 14 months. The differences between the groups were not signifi-cant. However, the tendency was similar to that in the previously discussed indicators.
As confirmed by the results presented in this study, growth intensity is a decisive factor influencing the overall economic efficiency of the herd. It can be con-cluded that the growth rate in heifers to 14 months of age which exceeds the limit of 700 to 790 g/day negatively affects the indicators of both the produc-tion and reproducproduc-tion efficiency of cows.
REFERENCES
[image:6.595.63.533.102.193.2]Abeni F., Calamari L., Stefanini L., Pirlo G. (2000): Effect of daily gain in pre- and postpubertal replacement dairy heifers on body condition score, body size, metabolic Table 8. The effect of height at the sacrum of heifers at 14 months on the length of their productive life
Trait
Height at sacrum of heifers at 14 months
P < 0.01 HS1
(< 128 cm)
n = 487
HS2 (128–131 cm)
n = 872
HS3 (132–135 cm)
n = 873
HS4 (> 135 cm)
n = 344 Length of productive
life (months)
μ + ai 35.85 35.62 34.82 33.73
sμ + ai 1.21 1.00 0.94 1.26
Table 7. The effect of live weight of heifers at 14 months on the length of their productive life
Trait
Live weight of heifers at 14 months
P < 0.01 LW1
(< 351 kg)
n = 451
LW2 (351–390 kg)
n = 971
LW3 (391–430 kg)
n = 918
LW4 (> 430 kg)
n = 236 Length of productive
life (months)
μ + ai 38.02 35.33 34.02 30.89 1:2, 3, 4
[image:6.595.61.532.228.314.2]profile and future milk production. J. Dairy Sci., 83, 1468–1478.
Gabler H.T., Tozer P.R., Heinrichs A.J. (2000): Develop-ment of cost analysis spreadsheet for calculating the costs to raise a replacement dairy heifer. J. Dairy Sci., 83, 1104–1109.
Hoffman P.C., Brehm N.M., Price S.G., Prill-Adams A. (1996): Effect of accelerated postpubertal growth and early calving on lactation performance of primiparous Holstein heifers. J. Dairy Sci., 79, 2024–2031.
Macdonald K.A., Penno J.W., Bryant A.M., Roche J.R. (2005): Effect of feeding level pre- and post-puberty and body weight at first calving on growth, milk pro-duction and fertility in grazing dairy cows. J. Dairy Sci., 88, 3363–3375.
Pirlo G., Capelleti M., Marchetto G. (1997): Effect of en-ergy and protein allowances in the diets of prepubertal heifers on growth and milk production. J. Dairy Sci., 80, 730–739.
SAS (2001): SAS Institute Inc., Release 8.2. (TS2MO) of
the SAS®. System for Microsoft® Windows®. Cary, NC,
USA.
Strapák P., Candrák J., Aumann J. (2005): Relationship between longevity and selected production, reproduc-tion and type traits. Czech J. Anim. Sci., 50, 1–6.
Corresponding Author
Doc. Ing. Josef Bouška, CSc., Institute of Animal Science, Přátelství 815, 104 01 Prague-Uhříněves, Czech Republic Tel. +420 267 009 563, fax +420 267 711 448, e-mail: [email protected]
Šafus P., Přibyl J. (2005): Comparison of long-term selec-tion responses of breeding policy in dairy herds. Czech J. Anim. Sci., 50, 439–449.
Šafus P., Štípková M., Stádník L., Přibyl J., Čermák V. (2005): Sub-indexes for bulls of Holstein breed in the Czech Republic. Czech J. Anim. Sci., 50, 254–265. Van Amburgh M.E., Galton D.M., Bauman D.E., Everett
R.W., Fox D.G., Chase L.E., Erb H.N. (1998): Effect of three prepubertal body growth rates on performance of Holstein heifers during first lactation. J. Dairy. Sci., 81, 527–538.
Waldo D.R., Capuco A.V., Rexroad Jr. C.E. (1998): Milk production of Holstein heifers fed either alfalfa or corn silage diets at two rates of daily gain. J. Dairy Sci., 81, 756–764.
Zanton G.I., Heinrichs A.J. (2005): Meta-analysis to as-sess effect of prepubertal average daily gain of Holstein heifers on first-lactation production. J. Dairy. Sci., 88, 3860–3867.