Lactation is a critical period in the life of sows. During a relatively short period they have to pro-duce a great amount of milk with a high concen-tration of nutrients, which requires a high supply of energy and amino acids. Mullan et al. (1989), cited by Close and Cole (2000), reported that up to 98% of dietary requirements of lactating sows were intended for milk production in the case of lysine. The total amount of required amino acids in lactation is reduced by a contribution connected with the mobilization of maternal tissues.
The amino acid requirement in lactation is close-ly connected with the composition of sow’s milk. During lactation the milk composition changes continuously, especially immediately after delivery. The obtained values can be influenced by the way of milk sampling, its storage and chemical analysis (Verstegen et al., 1998).
Milk proteins are exploited by piglets very effec-tively and the composition of their amino acids is
very similar to the composition of piglets’ tissues (ARC, 1981). The composition of amino acids in the sow’s milk can therefore be a clue to the opti-mal balance of amino acids required by the piglets (Verstegen et al., 1998).
Even if the milk composition changes during the lactating period, it is possible to use the cor-responding value of 5.6% for the content of crude protein – 7.6% of which is made up by lysine (Elliot et al., 1971; ARC, 1981; Close and Cole, 2000). A high lysine concentration in milk indicates its im-portance in lactation diets. Manifestations of its lack are retardation or inhibition of piglet growth and always deteriorated feed consumption per pro-duction. In sows the reproductive cycle is disturbed and the lactation level decreases. Threonine is usu-ally considered to be the second limiting amino acid. It is one of the important protein components and an indispensable part of many of them (Zeman et al., 2000).
Supported by the Ministry of Agriculture of the Czech Republic (Project No. MZe 0002701403).
Influence of various lysine and threonine levels
in feed mixtures for lactating sows on milk quality
and piglet growth
J. BOJČUKOVÁ, F. KRÁTKÝ
Research Institute of Animal Production, Prague-Uhříněves, Kostelec nad Orlicí Workplace, Czech Republic
ABSTRACT: The quality of produced milk and piglet growth were investigated in three groups of lactating Large White sows fed three mixtures containing different levels of lysine, threonine and crude protein. Piglets were weighed immediately after delivery and then in weekly intervals. At the age of 21 days the litter weight was the highest in group B (67.96 kg; P < 0.05), i.e. in the group with the highest dietary content of amino acids. Milk from lactating sows was sampled and analysed. An increased level of dietary amino acids became evident in milk at the first milk sampling (i.e. three days after delivery), when the content of lysine and threonine in milk was significantly the highest in group B (lysine 11.96 g/16 g N; threonine 6.72 g/16 g N; P < 0.05). The level of amino acids in milk and the differences between groups diminished in the following samplings. The changes of crude protein in milk were similar.
The selection of modern genotypes of pigs aimed at high growth intensity and high fertility resulted in significantly increased demands of lactating sows for the supply of amino acids recently. There is an evident tendency of an increasing demand for lysine (and also for other amino acids) as the lit-ter size and growth intensity of piglets increased in the course of years (Novotný, 1998). Close and Cole (2000) reported that according to some con-temporary requirements (NRC, 1998; Pettigrew, 1999), the lysine requirement in highly lactat-ing sows could exceed 60 g/day of total lysine or 55 g/day of ileal digestible lysine. Dourmad et al. (1998), cited by Novotný (1998), calculated regres-sion equations based on the monitoring of the re-lationship between lysine intake, milk production and nitrogen balance; it resulted from them that lactating sows of the common type needed 45 g of lysine daily while for highly productive sows the lysine consumption was 55 g/day. Differences in the published estimations of lysine requirements may be connected with differences in litter par-ity, intake of dietary energy and abilities of sows to mobilize the body reserves. Nevertheless, the milk production level and consequently the litter growth level have the major effect on the amino acid requirements of lactating sows.
As for the need of other amino acids, the experi-ence is very incomplete so far. Most contemporary recommendations are based on the concept of an ideal protein where the requirement of particu-lar amino acids is calculated from an ideal ratio of lysine and other amino acids. Various literature sources agree that the live weight of sows and the milk production level influence the balance of es-sential amino acids only slightly in the ideal protein for lactating sows (Close and Cole, 2000).
As for the threonine content in the diet, the values of 42–62% of lysine are cited in literature. Paulicks et al. (1998) determined the dietary con-tent of threonine to 0.66% by means of regression equations based on the maximum milk production. Somewhat higher values were given by Kirchgessner et al. (1998) – 0.70% and Westermeier et al. (1998) – 0.71%; the calculation was based on a minimum weight loss of the sow and maximum gain of the litter.
The aim of our study was to verify the influence of different levels of the amino acids lysine and threonine in the feed mixture for lactating sows on the quality of milk produced by them and conse-quently on the growth of suckling piglets.
MATERIAL AND METHODS
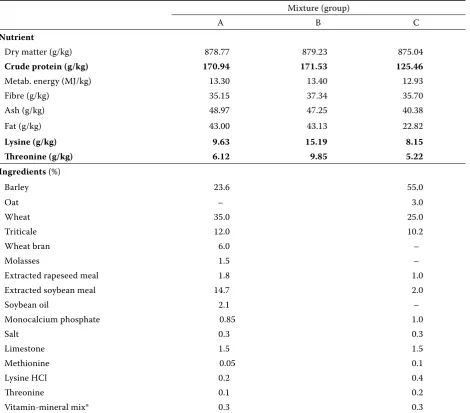
The experiments were performed on sows of the Large White breed that were fed ad lib a complete feed mixture with different levels of crude protein, lysine and threonine in experimental groups. The energy content was on a similar level in all mix-tures. Mixture A (group A, control group) was a standard complete feed mixture for lactating sows (KPK). The declared lysine content was 9 g/kg, which corresponds to the recommendations for the nutrient requirements for lactating sows (Šimeček et al.,2000). In group B the content of the studied amino acids was increased by adding synthetic preparations (produced by the company Biofaktory Praha, s.r.o.), in the case of lysine it was L-lysine HCl up to the value of 15.19 g/kg. Threonine was added in the amount to preserve its ratio to lysine that was approximately 0.64 in the mixture KPK. Mixture C contained 8.15 g/kg of lysine and 5.22 of threonine. It had a lower content of crude protein (CP) – 125.46 g/kg (A – 170.94 g/kg) to check the influence of the dietary level of crude protein. The sows were fed these mixtures approximately 7 days before delivery. The composition of the used feed mixtures is given in Table 1.
In each experimental group there were 10 sows of different parities (1–4); in group B a verifying repetition with other 5 sows was performed. The litters with 9 to 13 piglets were chosen for the ex-periment. The piglet growth was monitored by individual weighing immediately after birth and then in weekly intervals until the age of 21 days. In sows the feed mixture consumption was recorded starting on the day of delivery for single weeks of lactation and weight changes.
pro-gram QC Expert. The data were analysed by one-way ANOVA.
RESULTS AND DISCUSSION
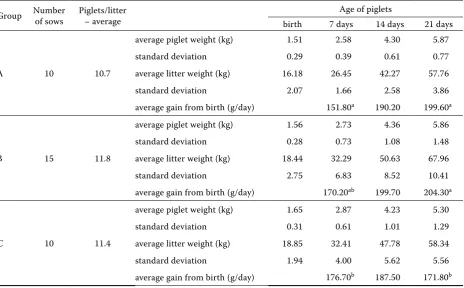
Average weight of piglets in the group was deter-mined after individual weighing of piglets imme-diately after delivery and in individual weeks after birth. At the time of delivery the average weight of piglets was about 1.57 kg and there was no signifi-cant difference between the groups. Similarly, the average weight in groups did not differ very much
in 7 and 14 days after birth. At the age of 21 days the average weights of piglets in individual groups were as follows: A – 5.87; B – 5.86; C – 5.30 kg, therefore also without statistically significant dif-ferences.
[image:3.595.65.536.102.515.2]Furthermore, the average litter weight in particu-lar groups and lactation weeks was determined. The average litter weight was higher in group B and C at the age of 0 and 7 days as a result of the higher average number of piglets per litter in these groups. The values in both groups (B and C) were almost the same. In group A the litter weight was significantly lower in these periods (P < 0.05). After
Table 1. Composition of the used feed mixtures
Mixture (group)
A B C
Nutrient
Dry matter (g/kg) 878.77 879.23 875.04
Crude protein (g/kg) 170.94 171.53 125.46
Metab. energy (MJ/kg) 13.30 13.40 12.93
Fibre (g/kg) 35.15 37.34 35.70
Ash (g/kg) 48.97 47.25 40.38
Fat (g/kg) 43.00 43.13 22.82
Lysine (g/kg) 9.63 15.19 8.15
Threonine (g/kg) 6.12 9.85 5.22
Ingredients (%)
Barley 23.6 55.0
Oat – 3.0
Wheat 35.0 25.0
Triticale 12.0 10.2
Wheat bran 6.0 –
Molasses 1.5 –
Extracted rapeseed meal 1.8 1.0
Extracted soybean meal 14.7 2.0
Soybean oil 2.1 –
Monocalcium phosphate 0.85 1.0
Salt 0.3 0.3
Limestone 1.5 1.5
Methionine 0.05 0.1
Lysine HCl 0.2 0.4
Threonine 0.1 0.2
Vitamin-mineral mix* 0.3 0.3
14 days of lactation there was an evident increase in the average litter weight in group B (50.63 kg) compared to group A (42.27 kg; P < 0.05) and also a statistically non-significant increase compared to group C (47.78 kg). At the age of 21 days the initial difference between groups A and C vanished and their average litter weight was almost on the same level (57.76 kg and 58.34 kg), while in group B this value was significantly higher (67.96 kg; P < 0.01). This means that the litter weight at the age of 21 days was the highest in the group with the highest dietary content of lysine. This is in cor-respondence with the results given by Zhang et al. (2001), namely the litter weight increases in piglets at the age of 20 and 35 days with increasing protein and lysine intake.
Average weight gains of piglets from birth to 7, 14 and 21 days of age were calculated in g per day from obtained results. In the first week after birth the gain was almost the same in group B and C (170.2 g and 176.7 g), in group A it was significantly lower (P < 0.05). In the second week group A came up to group B completely and it was in group C where the lowest gain was found out (187.5 g). Similarly like the litter weight, the weight gainfrom birth to
21 days of age was the highest in group B (204.3 g per day) followed by group A (199.6 g/day) without statistically significant difference. In group C the gain was the lowest (171.8 g/day; P < 0.05). Most au-thors reported that the increased level of proteins or amino acids for lactating sow positively affected the gains of piglets (Richert et al., 1997; Kusina et al., 1999); Jones and Stahly (1999) described a gain reduction after amino acid restriction. On the other hand, Touchette et al. (1998) stated that the lysine amount did not affect the growth of piglets.
All the ascertained parameters of the growth of piglets are given in Table 2.
[image:4.595.67.532.450.738.2]In the course of the experiment the feed con-sumption of sows was monitored and subse-quently the average consumption in the group was calculated for particular lactation weeks. The consumption in the first week was the highest in group A (4.02 kg/day); in group B (3.15 kg/day) and C (3.11 kg/day) it was significantly lower (P < 0.05). It might have been caused by a high level of amino acids in the mixture B, and on the contrary, by a low quality of mixture C. In the second week the feed consumption increased and there was no significant difference between the groups (5.02,
Table 2. Parameters of piglets’ growth
Group Number of sows Piglets/litter – average Age of piglets
birth 7 days 14 days 21 days
A 10 10.7
average piglet weight (kg) 1.51 2.58 4.30 5.87 standard deviation 0.29 0.39 0.61 0.77 average litter weight (kg) 16.18 26.45 42.27 57.76 standard deviation 2.07 1.66 2.58 3.86 average gain from birth (g/day) 151.80a 190.20 199.60a
B 15 11.8
average piglet weight (kg) 1.56 2.73 4.36 5.86 standard deviation 0.28 0.73 1.08 1.48 average litter weight (kg) 18.44 32.29 50.63 67.96 standard deviation 2.75 6.83 8.52 10.41 average gain from birth (g/day) 170.20ab 199.70 204.30a
C 10 11.4
average piglet weight (kg) 1.65 2.87 4.23 5.30 standard deviation 0.31 0.61 1.01 1.29 average litter weight (kg) 18.85 32.41 47.78 58.34 standard deviation 1.94 4.00 5.62 5.56 average gain from birth (g/day) 176.70b 187.50 171.80b
4.36, 4.44 kg/day), in the third week the consump-tion was almost the same in all groups (5.20, 5.33, 5.13 kg/day). The average feed consumption for the whole lactation period was also very similar in all groups, namely on the level of 4.23–4.77 kg/day.
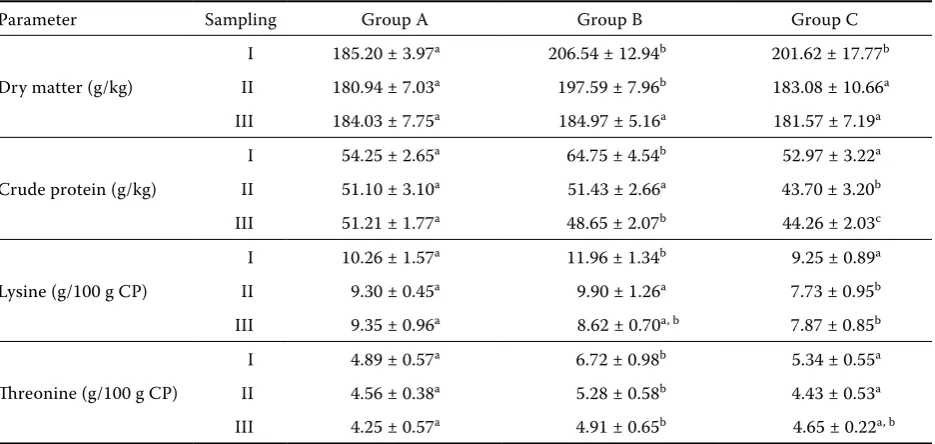
[image:5.595.65.533.514.736.2]The sow’s milk composition was examined using laboratory analyses especially with respect to the content of amino acids and crude protein. The obtained results varied among milk samplings and among particular animals considerably. Average values for particular groups and samplings are in Table 3.The levels of the amino acids lysine and threonine were the highest in all groups always in the first milk sampling (i.e. the third day af-ter delivery). In the second sampling there was a decline and then a stabilization of the level or a slight decline, in some cases also a slight increase in the content of these amino acids at the end of lactation.
At the first milk sampling the lysine level was significantly the highest in group B (11.96 g per 100 g CP; P < 0.05), i.e. in the group with the high-est dietary content of this amino acid, followed by group A and then C, in the same order as the lysine content in the mixture. Despite of the low lysine content in milk, group C had the highest weight gain in this period, probably as a result of higher milk production and higher maternal weight loss. The second milk sampling contained approximately the same amount of lysine in group A and B, while
in group C this amount was significantly lower (P < 0.05 compared to group A; P < 0.01 compared to group B). At the last sampling there was a sta-bilization of the lysine level in group A and C, so that the values here were on the same level as at the second sampling. In group B the lysine level declined again, which caused that group B got to the second position behind group A, the difference was not however statistically significant. At this sampling there was a statistically significant differ-ence only between group A and group C (9.35 g per 100 g CP v. 7.87 g per 100 g CP; P < 0.01).
In the case of threonine its level was the sig-nificantly highest at the beginning of lactation in group B (6.72 g per 100 g CP; P < 0.01), i.e. in the group with the highest dietary content of this amino acid. On the contrary, Paulicks et al. (1998) arrived at the conclusion that the threonine supply did not affect either milk protein or milk amino acids. Group C followed (5.34 g per 100 g CP) and in group A the level was the lowest (4.89 g per 100 g CP), the difference between these two groups was not significant. Like in lysine, there was a decline of the level in all groups at the second sampling. Group B remained on the highest level (P < 0.05), in groups A and C there was almost the same threonine content. At the last sampling the threonine level went on declining slightly in group A and B, while it increased slightly in group C. That almost caused a deletion of differences
be-Table 3. Average sow’s milk composition
Parameter Sampling Group A Group B Group C
Dry matter (g/kg)
I 185.20 ± 3.97a 206.54 ± 12.94b 201.62 ± 17.77b II 180.94 ± 7.03a 197.59 ± 7.96b 183.08 ± 10.66a III 184.03 ± 7.75a 184.97 ± 5.16a 181.57 ± 7.19a
Crude protein (g/kg)
I 54.25 ± 2.65a 64.75 ± 4.54b 52.97 ± 3.22a II 51.10 ± 3.10a 51.43 ± 2.66a 43.70 ± 3.20b III 51.21 ± 1.77a 48.65 ± 2.07b 44.26 ± 2.03c
Lysine (g/100 g CP)
I 10.26 ± 1.57a 11.96 ± 1.34b 9.25 ± 0.89a II 9.30 ± 0.45a 9.90 ± 1.26a 7.73 ± 0.95b III 9.35 ± 0.96a 8.62 ± 0.70a, b 7.87 ± 0.85b
Threonine (g/100 g CP)
I 4.89 ± 0.57a 6.72 ± 0.98b 5.34 ± 0.55a II 4.56 ± 0.38a 5.28 ± 0.58b 4.43 ± 0.53a III 4.25 ± 0.57a 4.91 ± 0.65b 4.65 ± 0.22a, b
tween the groups and the only significant differ-ence was between group A and group B (P < 0.05); in group B the highest threonine level in milk was maintained (P < 0.05). In the course of lactation a similar development was evident in the content of crude protein in milk. Most authors agree that an elevated protein amount in the diet positively af-fects the production of milk and milk protein (King et al., 1993a, b; Zhang et al., 2001). Al-Matubsi et al. (1998) reported that a higher level of dietary protein caused a higher protein production in milk on the 7th to 21st day of lactation, Daza et al. (1999) confirmed that the protein amount in milk did not change significantly from the 7th day of lactation. Our results documented significant changes in the amount and quality of protein in milk between the third and tenth day of lactation. In the following period the levels of amino acids were stabilized and only minor changes occurred.
CONCLUSION
The results given above illustrate that the lysine and threonine level in the diet of lactating sows affects the amount of these amino acids in milk, especially at the beginning of lactation. The level of dietary crude protein has a similar impact. As expected, a reduction in the nutrient levels in the diet results in a lower performance of the sow in the form of reduced milk production and in a change in the content of these nutrients in milk. Subsequently, the performance of piglets is lower, which becomes evident by lowered weight gains of piglets and reduction of litter weight. On the contrary, an increased level of amino acids and crude protein positively affects the composition of produced milk, but it does not always result in a better performance of suckling piglets.
REFERENCES
Al-Matubsi H.Y., Bervanakis G., Tritton S.M., Campbell R.G., Fairclough R.J. (1998): Influence of dietary protein of diets given in late gestation and during lactation on protein content and oestrogen concentrations in the colostrum and milk of gilts. Anim. Sci., 67, 139–145. ARC (Agricultural Research Council) (1981): The
Nutri-ent RequiremNutri-ent of Pigs. Commonwealth Agricultural Bureaux, Farnham Royal, Slough.
Close W.H., Cole D.J.A. (2000): Nutrition of Sows and
Boars. Nottingham University Press, Nottingham, United Kingdom. 71–89.
Daza A., Rioperez J., Centeno C., Ovejero I., Alba C. (1999): Produccion de leche y composicion de la leche de cerdas primiparas Duroc cubiertas precozmente. In: VIII Jornadas Sobre Produccion Animal, 11–13 May 1999. Zaragoza, Spain. Tomo II (1999). ITEA-Prod. Anim., 20, 762–764.
Dourmad J.Y., Noblet J., Etienne M. (1998): Effect of pro-tein and lysine supply on performance, nitrogen bal-ance, and body composition changes of sows during lactation. J. Anim. Sci., 76, 542–550.
Elliot R.F., Van der Noot G.W., Gilbreath R.L., Fisher H. (1971): Effect of dietary protein level on composition changes in sow colostrum and milk. J. Anim. Sci., 32, 1128–1137.
Jones D.B., Stahly T.S. (1999): Impact of amino acid nu-trition during lactation on body nutrient mobilization and milk nutrient output in primiparous sows. J. Anim. Sci., 77, 1513–1522.
King R.H., Rayner C.J., Kerr M. (1993a): A note on the amino acid composition of sow’s milk. Anim. Prod.,
57, 500–502.
King R.H., Toner M.S., Dove H., Atwood C.S., Brown W.G. (1993b): The response of first-litter sows to die-tary protein level during lactation. J. Anim. Sci., 71, 2457–2463.
Kirchgessner M., Paulicks B.R., Westermeier C. (1998): Concentrations of free amino acids and urea in the blood plasma of suckling sows as dependent on dietary threonine supplementation. 3. Contribution concern-ing the threonine requirement of sucklconcern-ing sows. J. Anim. Physiol. Anim. Nutr., 80, 31–39.
Kusina J., Pettigrew J.E., Sower A.F., White M.E., Crooker B.A., Hathaway M.R. (1999): Effect of protein intake dur-ing gestation and lactation on the lactational perform-ance of primiparous sows. J. Anim. Sci., 77, 931–941. Mullan B.P., Close W.H., Cole D.J.A. (1989): Predicting
nutrient responses of the lactating sow. In: Haresign W., Cole D.J.A. (eds.): Recent Advances in Animal Nu-trition. Butterworths, London. 229–243.
Novotný K. (1998): Potřeba aminokyselin pro kojící pras-nice. Krmivářství, 6, 16–18.
NRC (1998): Nutrient Requirements of Swine. 10th re-vised edition. National Academy of Sciences, Wash-ington DC.
Pettigrew J.E. (1999): Feeding the modern sow. In: Lyons T.P., Cole D.J.A. (eds.): Concepts in Pig Science. Not-tingham University Press, NotNot-tingham. 99–104. Richert B.T., Tokach M.D., Goodband R.D., Nelssen J.L.,
Campbell R.G., Kershaw S. (1997): The effect of dietary lysine and valine fed during lactation on sow and litter performance. J. Anim. Sci., 75, 1853–1860.
Šimeček K., Zeman L., Heger J. (2000): Potřeba živin a tabulky výživné hodnoty krmiv pro prasata. Česká akademie zemědělských věd, Brno.
Touchette K.J., Allee G.L., Newcomb M.D., Boyd R.D. (1998): The lysine requirement of lactating primiparous sows. J. Anim. Sci., 76, 1091–1097.
Verstegen M.W.A., Moughan P.J., Schrama J.W. (1998): The Lactating Sow. Wageningen Press, Wageningen, The Netherlands. 4–9.
Westermeier C., Paulicks B.R., Kirchgessner M. (1998): Feed intake and body weights of suckling sows and piglets in dependence of dietary threonine supplemen-tation. 1. Contribution about the threonine require-ment of suckling pigs. J. Anim. Physiol. Anim. Nutr.,
79, 33–45.
Zeman L., Prudil M., Lichovníková M., Klecker D. (2000): Aminokyseliny a jejich význam ve výživě monogas-trických zvířat. Krmivářství, 3, 12–18.
Zhang J.Z., Shao Q.J., Lu W., Xu L.R., Hu J.P. (2001): Study on dietary protein and lysine requirement of sows nurs-ing large litters. Chin. J. Anim. Sci., 37, 7–9.
Received: 05–01–19 Accepted after corrections: 05–08–30
Corresponding Author
Ing. Jaroslava Bojčuková, Research Institute of Animal Production, Prague-Uhříněves, Kostelec nad Orlicí Workplace, Komenského 1239, 517 41 Kostelec nad Orlicí, Czech Republic