Association of bovine
PPARGC1A
and
OPN
genes with
milk production and composition in Holstein cattle
M. Pasandideh
1, M.R. Mohammadabadi
2, A.K. Esmailizadeh
2, A. Tarang
31Young Researchers and Elite Club, Bojnourd Branch, Islamic Azad University, Bojnourd, Iran 2Department of Animal Science, Faculty of Agriculture, Shahid Bahonar University of Kerman,
Kerman, Iran
3Department of Genomics, Branch of North Region of Iran (Rasht), Agricultural Biotechnology Research Institute of Iran, Rasht, Iran
ABSTRACT: Several studies have reported quantitative trait loci on chromosome 6 affecting milk production and composition traits in dairy cattle. Osteopontin (OPN) and peroxisome proliferator activated receptor-γ coactivator-1α (PPARGC1A) genes have been located on this chromosome and identified as positional candi-dates for milk traits. We investigated the associations of single nucleotide polymorphism (SNP) T>C at position 1892 and SNP A>C at position 3359 in PPARGC1A gene as well as SNP C>T at position 8514 in OPN gene with milk production and composition. Hence, 398 Iranian Holstein cows were genotyped through polymerase chain reaction and restriction fragment length polymorphism (PCR-RFLP). The Least Squares methods were used to examine the effects of genotypes on milk traits. The frequencies of the C allele at position 1892, A allele at position 3359, and T allele at position 8514 were 0.56, 0.64, and 0.53, respectively. In this study, c.1892T>C genotypes indicated significant associations with milk fat content adjusted for two milkings per day (FATP2X; %), estimated breeding value for milk (EBVM; kg), milk protein yield adjusted for mature body weight (PROME; kg),
milk protein yield adjusted for 305 days (PRO305; kg) (P < 0.05), and estimated breeding value for milk fat content (EBVFP; %) (P < 0.01). There were significant associations between c.3359A>C genotypes and FATP2X, EBVFP (P < 0.01). Moreover, significant associations were shown between c.8514C>T genotypes in OPN gene and FATP2X (P < 0.05), and PROPER305 (P < 0.01). Thus, these SNPs would provide an excellent opportunity for marker assisted selection programs in dairy cattle.
Keywords: cattle; OPN; PCR-RFLP; PPARGC1A; SNPs
INTRODUCTION
An essential field of research in livestock spe-cies is detection of genes that influence important production traits. In dairy cattle, most researches have detected quantitative trait loci (QTL) on autosomal chromosomes affecting one or more of the five milk traits (i.e. milk yield, fat yield and percentage, and protein yield and percentage). Many studies have reported that the highest num-ber of these QTL have been located on chromo-some 6 (Khatkar et al. 2004). Osteopontin (OPN) and peroxisome proliferator activated receptor-γ coactivator-1α (PPARGC1A termed PGC-1α) are
PPARGC1A gene is made from 13 exons composed of 6261 bp. Also, it is expressed at various levels in many tissues (Weikard et al. 2005).
OPN is a phosphoprotein secreted into body fluids firstly identified as a bone matrix protein. The recent researches reported that OPN could act as a cytokine (Eta-1) when produced by ac-tivated T cells (Denhardt et al. 2001). OPN gene has been located on chromosomes 4 and 5 in hu-man and mouse, respectively (Nemir et al. 2000).
OPN phosphorprotein is composed of about 300 amino acids (278 in cow, 280 in buffalo, 297 in mouse, 314 in human) (Liang and Ward 2006). It is reported that the OPN gene expression is higher in mammary gland epithelial cells and monocytes and macrophages in milk. It is recognized the range of OPN concentration is 3–10 µg/ml in hu-man (Senger et al. 1989) and 8 mg/l in raw milk of cows (Bayless et al. 1997). The different roles of human OPN are: cell adhesion and survival, tissue remodelling, regulation of inflammation, fetal growth and development, and in initiating and maintaining pregnancy (Denhardt et al. 2001). The OPN gene is located in a region of bovine chromosome 6 that comprises QTL affecting milk production traits (Ron et al. 2001; Rodriguez-Zas et al. 2002; Ashwell et al. 2004).
Weikard et al. (2005) showed that SNP T>C of
PPARGC1A gene had a significant effect on milk fat yield in the German Holstein population. Khatib et al. (2007) reported significant associations between SNP A>C of PPARGC1A gene and milk yield, milk protein percentage, and SCS in the North American Holstein population. Leonard et al. (2005) reported significant associations between SNP A>C of OPN
gene and milk protein percentage and milk fat per-centage in the North American Holstein population. Ron et al. (2001) detected QTL affecting protein percentage to a confidence interval of 4 cM in the region of OPN. A QTL affecting milk production traits was mapped to an interval of 420 kb between the genes ABCG2 and LAP3 on bovine chromo-some 6. This fine region harbours only 6 genes, including OPN (Olsen et al. 2005). Also, a quantita-tive trait nucleotide has been situated upstream of
OPN promoter region that has significant effects on percentage of milk protein and fat (Schnabel et al. 2005). Thus, in this study, the association of bovineOPN and PPARGC1A variants with milk production and composition were investigated in Iranian Holstein cows.
MATERIAL AND METHODS
A total of 398 Holstein-Friesian cows from 10 dairy herds were selected from Tehran and Esfahan provinces of Iran. They were fed standard diet and were milked twice a day using a pipeline machine. Rainfall (mm) and minimum daily tem-perature (°C) values are higher in Tehran than in Esfahan. The first lactation records of cows born within 2003–2006 were used. All phenotypic data (MILK305 (milk yield adjusted for 305 days; kg), MILK2X (milk yield adjusted for two-milkings per day; kg), MILKME (milk yield adjusted for mature body weight; kg), PRO305 (milk protein yield ad-justed for 305 days; kg), PROME (milk protein yield adjusted for mature body weight; kg), PROPER305 (milk protein content adjusted for 305 days; %), FAT2X (milk fat yield adjusted for two-milkings per day; kg), FATP2X (milk fat content adjusted for two milkings per day; %)) and estimated breeding values (EBVM (estimated breeding value for milk; kg), EBVF (estimated breeding value for milk fat yield; kg), EBVFP (estimated breeding value for milk fat content; %)) used in this study were obtained from the Animal Breeding Center of Iran. DNA isolation was performed using salting out method. Analysis of genotypes was performed using the PCR-RFLP method. Two polymorphisms were studied in the PPARGC1A gene. These sites were found in intron 9 (T/C at position 1892) and in the 3′ untranslated region (A/C at position 3359) (GenBank Accession No. AY321517). The primers used to amplify two fragments of the PPARGC1A
The PCR products of PPARGC1A gene (195 and 357 bp fragments) were incubated with restriction enzymes HaeIII and NheI respectively at 37°C for 3 h. PCR products of OPN gene (290 bp fragment) were digested with the restriction enzyme BsrI (BseNI) at 65°C for 5 h. The digestion products were electrophoresed on a 2% agarose gel.
The Pop Gene software (Version 1.31, 1999) was used to estimate the Hardy-Weinberg test, gene and genotype frequency, observed and expected heterozygosity. The standard error of allele fre-quency was calculated by the following formula (Falconer and Mackay 1996):
√
p(1 – p)/2nwhere:
n = sample size
p = frequency of the C allele
The haplotypes frequencies at a pair of loci were used to calculate linkage disequilibrium (r2
statis-tics) between the studied SNPs (Hill and Robertson 1968). The effects of PPARGC1A and OPN geno-types on milk production and composition traits were analyzed using the Least Squares method of the GLM procedure of SAS (Statistical Analysis System, Version 8.0, 1999). Tukey’s test was used to compare the means. The used model was as follows:
Yijkmn= µ + Gi + Sj + Mk + Nm + eijkmn
where:
Yijkmn = observed trait µ = overall mean
Gi = fixed effect of genotypes (3 levels)
Sj = fixed effect of herd (10 levels)
Mk = fixed effect of year (3 levels)
Nm = fixed effect of calving seasons (4 levels)
eijkmn = residual effect to each observation
In addition, the SNPs effects of PPARGC1A and
OPN genes on estimated breeding values were ana-lyzed using a statistical model including the genotypes effects. To calculate additive effects, the genotypes were ranked as the number of C alleles (0, 1, or 2) at the c.1892T>C and c.8514C>T loci and the number of A alleles (0, 1, or 2) at the c.3359A>C locus. To test for dominance, an additional regression covariate was added with value of 0 for homozygous and 1 for heterozygous animals. PPARGC1A and OPN genes variance was estimated using the (1 – MSfullmodel/ MSreducedmodel) equation (Knott et al. 1996), where MSfullmodel and MSreducedmodel – residual mean squares of the model with the PPARGC1A and OPN effect fitted and the model without the PPARGC1A and
OPN effect, respectively.
RESULTS AND DISCUSSION
The PPARGC1A and OPN genes were chosen for this research. The first reason was QTL studies that indicated an association of PPARGC1A and
OPN regions on milk production and composition traits in dairy cattle (Khatkar et al. 2004; Olsen et al. 2005; Weikard et al. 2005; Khatib et al. 2007). The second reason was the involvement of these genes in regulating important physiological pro-cesses – PPARGC1A plays a fundamental role in the regulation of cellular energy metabolism such as adaptive thermogenesis, mitochondrial biogen-esis, adipogenbiogen-esis, gluconeogenbiogen-esis, and glucose/ fatty acid metabolism (Liang and Ward 2006). Also, the existence of OPN protein in milk and its high expression in mammary gland epithelial cells are the evidences for effects of different OPN
genotypes on milk production and composition in Holstein dairy cattle population (Leonard et al. 2005). In the present study, three digestion
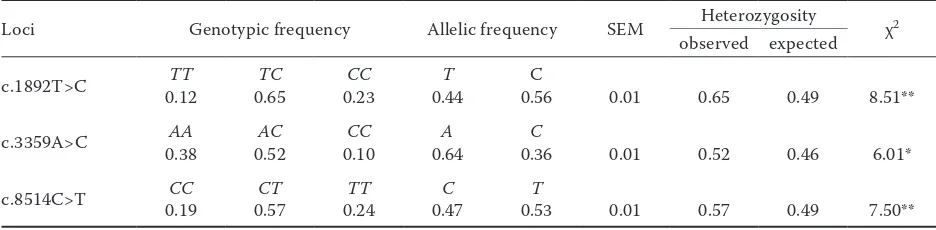
pat-Table 1. Summary of population genetic information for c.1892T>C, c.3359A>C, and c.8514C>T positions
Loci Genotypic frequency Allelic frequency SEM Heterozygosity χ2
observed expected
c.1892T>C 0.12TT 0.65TC 0.23CC 0.44T 0.56C 0.01 0.65 0.49 8.51**
c.3359A>C 0.38AA 0.52AC 0.10CC 0.64A 0.36C 0.01 0.52 0.46 6.01*
c.8514C>T 0.19CC 0.57CT 0.24TT 0.47C 0.53T 0.01 0.57 0.49 7.50**
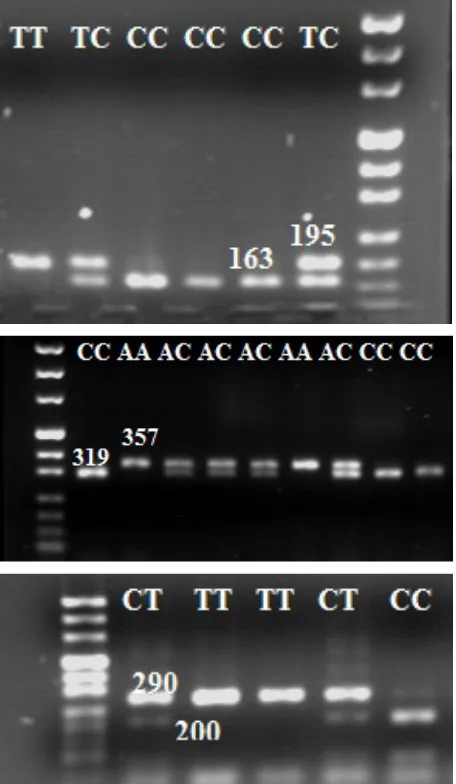
[image:3.595.63.531.622.737.2]terns were obtained for each of the three studied SNPs in Holstein cows (Figure 1).
In the examined group of 398 cows, the genotypes 46 TT, 259 TC, and 93 CC (c.1892T>C); 151 AA, 207 AC, and 40 CC (c.3359A>C); and 75 CC, 226 CT, and 97 TT (c.8514C>T) were identified. The allelic and genotypic frequencies, standard error of fre-quencies, observed and expected heterozygosity, and the value of chi-square test are shown in Table 1.
The highest and least frequencies of genotypes in c.1892T>C SNP were for TC and TT, respectively,
consistent with the results obtained by Khatib et al. (2007). The highest allele frequency was reported for C allele in this study and other researches (White et al., 2007; Komisarek and Dorynek 2009; Schen-nink et al. 2009). The frequencies were reported in c.3359A>C position of PPARGC1A gene as follows: the highest frequency was found for the AC geno-type and the lowest frequency for the CC genotype. These results are similar to those of Weikard et al. (2005) and Khatib et al. (2007), who reported the highest frequency for the AC genotype, as well as of Kowalewska-Luczak et al. (2010) who obtained the least genotypic frequency for the CC. It is interesting that the obtained allelic frequencies in our study are the same as those reported by Komisarek and Dorynek 2009 (A – 0.64 and C – 0.36). Also, we observed the highest and least genotypic frequen-cies at c.8514C>T position of OPN gene for the
CT and CC, respectively. The obtained results are consistent with the previous studies (Khatib et al. 2007; Pareek et al. 2008). The differences in geno-typic frequencies might be regarded as the reason of variation of the studied breeds or discrepancy in sample size. The chi-square test indicated the genotypes in all loci deviated from the Hardy Wein-berg equilibrium (P < 0.05). These values indicate that the population has been under selection for milk production and composition traits for years.
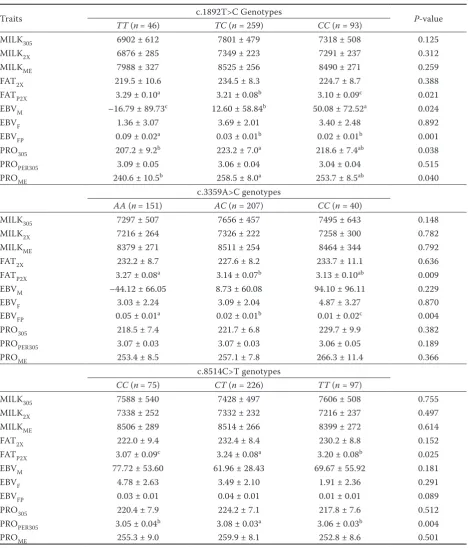
Table 2 shows the effect of the c.1892T>C geno-types of the PPARGC1A gene on milk production and composition traits. The results showed that the TT genotype is associated with higher FATP2X (P < 0.05) and more EBVFP (P < 0.01) if compared to other genotypes. The CC genotype had higher EBVM compared to TC and CC cows (P < 0.05). Finally, the TC genotype group yielded more PRO305 and PROME in comparison to the TT groups (P < 0.05). Significant differences were found for c.3359A>C genotypes of the PPARGC1A gene with FATP2X and EBVFP (Table 2). Cows of the AA genotype showed more FATP2X compared to AC cows (P < 0.01). Also, cows of AA genotypes had higher EBVFP compared to other genotypes (P < 0.01).
Khatib et al. (2007) reported that the A allele in c.3359A>C position of PPARGC1A gene was associated with increasing of protein percentage and decreasing of milk yield, whereas they did not find any association with c.1892T>C and milk production traits. Weikard et al. (2005) showed that cows with the TT genotypes of c.1892T>C position yielded higher milk fat than the other
Figure 1. (A) Enzymatic digestion for the 195 bp fragment of PPARGC1A gene: TT (195 bp), CC (163 and 32 bp),
TC (195, 163, and 32 bp); (B) enzymatic digestion for the 357 bp fragment of PPARGC1A gene: AA (357 bp), CC
[image:4.595.64.292.98.490.2]Table 2. Effect of c.1892T>C, c.3359A>C, and c.8514C>T positions genotypes of PPARGC1Aand OPNgenes on milk traits in Iranian Holstein cows (Least Squares Means ± standard errors)
Traits c.1892T>C Genotypes P-value
TT (n= 46) TC (n = 259) CC (n = 93)
MILK305 6902 ± 612 7801 ± 479 7318 ± 508 0.125
MILK2X 6876 ± 285 7349 ± 223 7291 ± 237 0.312
MILKME 7988 ± 327 8525 ± 256 8490 ± 271 0.259
FAT2X 219.5 ± 10.6 234.5 ± 8.3 224.7 ± 8.7 0.388
FATP2X 3.29 ± 0.10a 3.21 ± 0.08b 3.10 ± 0.09c 0.021
EBVM –16.79 ± 89.73c 12.60 ± 58.84b 50.08 ± 72.52a 0.024
EBVF 1.36 ± 3.07 3.69 ± 2.01 3.40 ± 2.48 0.892
EBVFP 0.09 ± 0.02a 0.03 ± 0.01b 0.02 ± 0.01b 0.001
PRO305 207.2 ± 9.2b 223.2 ± 7.0a 218.6 ± 7.4ab 0.038
PROPER305 3.09 ± 0.05 3.06 ± 0.04 3.04 ± 0.04 0.515
PROME 240.6 ± 10.5b 258.5 ± 8.0a 253.7 ± 8.5ab 0.040
c.3359A>C genotypes
AA (n= 151) AC (n = 207) CC (n = 40)
MILK305 7297 ± 507 7656 ± 457 7495 ± 643 0.148
MILK2X 7216 ± 264 7326 ± 222 7258 ± 300 0.782
MILKME 8379 ± 271 8511 ± 254 8464 ± 344 0.792
FAT2X 232.2 ± 8.7 227.6 ± 8.2 233.7 ± 11.1 0.636
FATP2X 3.27 ± 0.08a 3.14 ± 0.07b 3.13 ± 0.10ab 0.009
EBVM –44.12 ± 66.05 8.73 ± 60.08 94.10 ± 96.11 0.229
EBVF 3.03 ± 2.24 3.09 ± 2.04 4.87 ± 3.27 0.870
EBVFP 0.05 ± 0.01a 0.02 ± 0.01b 0.01 ± 0.02c 0.004
PRO305 218.5 ± 7.4 221.7 ± 6.8 229.7 ± 9.9 0.382
PROPER305 3.07 ± 0.03 3.07 ± 0.03 3.06 ± 0.05 0.189
PROME 253.4 ± 8.5 257.1 ± 7.8 266.3 ± 11.4 0.366
c.8514C>T genotypes
CC (n= 75) CT (n = 226) TT (n = 97)
MILK305 7588 ± 540 7428 ± 497 7606 ± 508 0.755
MILK2X 7338 ± 252 7332 ± 232 7216 ± 237 0.497
MILKME 8506 ± 289 8514 ± 266 8399 ± 272 0.614
FAT2X 222.0 ± 9.4 232.4 ± 8.4 230.2 ± 8.8 0.152
FATP2X 3.07 ± 0.09c 3.24 ± 0.08a 3.20 ± 0.08b 0.025
EBVM 77.72 ± 53.60 61.96 ± 28.43 69.67 ± 55.92 0.181
EBVF 4.78 ± 2.63 3.49 ± 2.10 1.91 ± 2.36 0.291
EBVFP 0.03 ± 0.01 0.04 ± 0.01 0.01 ± 0.01 0.089
PRO305 220.4 ± 7.9 224.2 ± 7.1 217.8 ± 7.6 0.512
PROPER305 3.05 ± 0.04b 3.08 ± 0.03a 3.06 ± 0.03b 0.004
PROME 255.3 ± 9.0 259.9 ± 8.1 252.8 ± 8.6 0.501
MILK305 = milk yield adjusted for 305 days (kg), MILK2X = milk yield adjusted for two milkings per day (kg), MILKME = milk yield adjusted for mature body weight (kg), FAT2X = milk fat yield adjusted for two milkings per day (kg), FATP2X = milk fat content
adjusted for two milkings per day (%), EBVM = estimated breeding value for milk (kg), EBVF = estimated breeding value for milk fat yield (kg), EBVFP = estimated breeding value for milk fat content (%), PRO305 = milk protein yield adjusted for 305 days (kg),
PROPER305 = milk protein content adjusted for 305 days (%), PROME = milk protein yield adjusted for mature body weight (kg)
individuals, without significant effect on milk yield and milk fat percentage traits. These au-thors did not observe significant differences in the analyzed milk traits of cows with different c.3359A>C genotypes. No significant difference between c.1892T>C and c.3359A>C genotypes and milk yield, fat, and protein percentage traits was reported by Kowalewska-Luczak et al. (2010) in Jersey cows. Schennink et al. (2009) found an association between c.1892T>C and milk fat com-position in Dutch Holstein-Friesian cattle.
Significant relationships were found between the c.8514C>T genotypes and FATP2X and PROPER305 traits (Table 2). Cows with the CT genotype had higher FATP2X (P < 0.05) and more PROPER305 (P < 0.01) than those carrying other genotypes. No associations were observed between the stud-ied SNPs genotypes and the other traits (P > 0.1). The results of our study are consistent with those of other researches that have shown the significant association of c.8514C>T in the OPN
gene with milk protein and fat percentage (Ron et al. 2001; Leonard et al. 2005; Schnabel et al. 2005; Khatib et al., 2007). Khatib et al. (2007) showed the significant additive effects for milk protein percentage, fat percentage, and fat yield traits at c.8514C>T position.
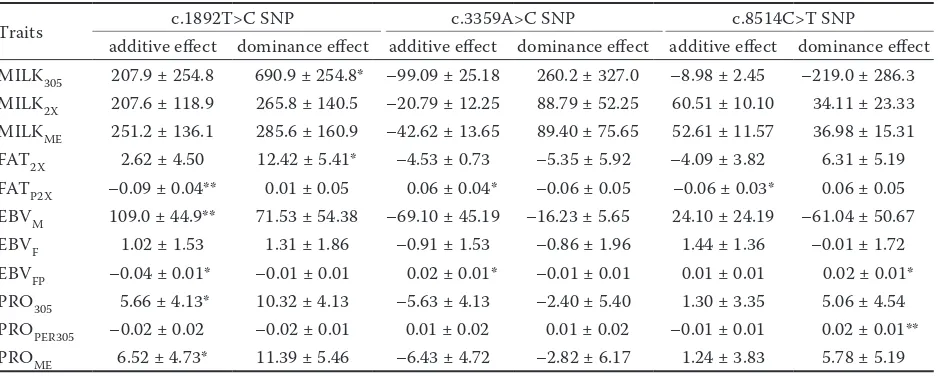
Additive and dominance effects of alleles are shown in Table 3. We observed an increase in FATP2X and EBVFP associated with the T allele in the c.1892T>C SNP while animals with TC geno-type had more PRO305 and PROME in milk. In-stead,Alim et al. (2012) indicated that this allele is associated with an increase in protein yield and protein concentration. Moreover, the A al-lele in c.3359A>C SNP was associated with an increase in FATP2X and EBVFP traits. These results are consistent with those in the previous study by Khatib et al. (2007) that showed an association between allele A and milk production traits. The
T allele at c.8514C>T SNP in OPN gene increases FATP2X whereas CT genotype is related to higher PROPER305 as compared to CC and TT genotypes. In contrast, Leonard et al. (2005) reported that the C allele increases milk protein percentage and fat percentage.
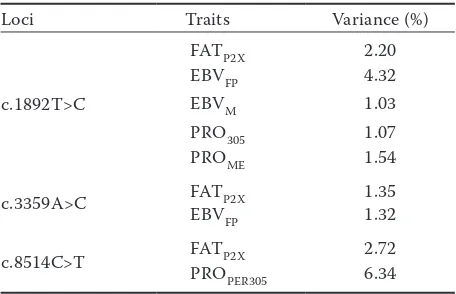
The PPARGC1A and OPN variances for sig-nificant traits are shown in Table 4. We obtained the highest variance of the PPARGC1A gene for EBVFP (4.32). This value suggests that PPARGC1A
[image:6.595.65.534.125.313.2]plays an essential role in lipid metabolism and was introduced as a candidate gene for milk fat. Also, the highest variance of the OPN gene was obtained for PROPER305 (6.34). This result proves
Table 3. Estimates (± SE) of additive and dominance effects associated with the single nucleotide polymorphism (SNP) at c.1892T>C, c.3359A>C, and c.8514C>T positionsin Iranian Holstein cows
Traits c.1892T>C SNP c.3359A>C SNP c.8514C>T SNP
additive effect dominance effect additive effect dominance effect additive effect dominance effect MILK305 207.9 ± 254.8 690.9 ± 254.8* –99.09 ± 25.18 260.2 ± 327.0 –8.98 ± 2.45 –219.0 ± 286.3 MILK2X 207.6 ± 118.9 265.8 ± 140.5 –20.79 ± 12.25 88.79 ± 52.25 60.51 ± 10.10 34.11 ± 23.33 MILKME 251.2 ± 136.1 285.6 ± 160.9 –42.62 ± 13.65 89.40 ± 75.65 52.61 ± 11.57 36.98 ± 15.31
FAT2X 2.62 ± 4.50 12.42 ± 5.41* –4.53 ± 0.73 –5.35 ± 5.92 –4.09 ± 3.82 6.31 ± 5.19
FATP2X –0.09 ± 0.04** 0.01 ± 0.05 0.06 ± 0.04* –0.06 ± 0.05 –0.06 ± 0.03* 0.06 ± 0.05 EBVM 109.0 ± 44.9** 71.53 ± 54.38 –69.10 ± 45.19 –16.23 ± 5.65 24.10 ± 24.19 –61.04 ± 50.67
EBVF 1.02 ± 1.53 1.31 ± 1.86 –0.91 ± 1.53 –0.86 ± 1.96 1.44 ± 1.36 –0.01 ± 1.72
EBVFP –0.04 ± 0.01* –0.01 ± 0.01 0.02 ± 0.01* –0.01 ± 0.01 0.01 ± 0.01 0.02 ± 0.01*
PRO305 5.66 ± 4.13* 10.32 ± 4.13 –5.63 ± 4.13 –2.40 ± 5.40 1.30 ± 3.35 5.06 ± 4.54 PROPER305 –0.02 ± 0.02 –0.02 ± 0.01 0.01 ± 0.02 0.01 ± 0.02 –0.01 ± 0.01 0.02 ± 0.01** PROME 6.52 ± 4.73* 11.39 ± 5.46 –6.43 ± 4.72 –2.82 ± 6.17 1.24 ± 3.83 5.78 ± 5.19
MILK305 = milk yield adjusted for 305 days (kg), MILK2X = milk yield adjusted for two milkings per day (kg), MILKME = milk yield adjusted for mature body weight (kg), FAT2X = milk fat yield adjusted for two milkings per day (kg), FATP2X = milk fat content
adjusted for two milkings per day (%), EBVM = estimated breeding value for milk (kg), EBVF = estimated breeding value for milk fat yield (kg), EBVFP = estimated breeding value for milk fat content (%), PRO305 = milk protein yield adjusted for 305 days (kg),
that OPN is a functional candidate for the QTL affecting protein percentage (Schnabel et al. 2005).
The r2 statistics was estimated to indicate if the
effects of the SNPs in the PPARGC1A and OPN
genes were partially explaining the same varia-tion. The r2 measure for the T>C SNP and T>C
SNP in PPARGC1A gene was calculated 0.85. The
r2 measure between the two SNPs in PPARGC1A
gene and C>T SNP in OPN gene were below 0.001. The figure of 0.85 means that the genotype of the T>C SNP explains 85% of the variation in the T>C SNP. So the SNPs are in a quite high linkage dis-equilibrium (LD) but not complete. On the other hand, the low r2 values indicate that the effect
of one SNP explains variation in the other SNPs just to a limited extent. Considering that the LD value between the c.1892T>C and the c.3359A>C loci was 0.85, the high LD can be the reason of significant associations between the genotypes and milk traits. Moreover, the significant associa-tions between the c.1892T>C, c.3359A>C, and c.8514C>T SNPs and milk traits may be due to LD with a yet-undetected functional polymorphism closely to PPARGC1A and OPN genes.
The investigated SNPs of the current study were located in the intronic and untranslated regions. The introns consist of genes for small nuclear RNA, which is important to the translation of messenger RNA. Also, they can be essential in alternative splicing process, which can produce
multiple types of messenger RNA from a single gene (Chorev and Carmel 2012). These functions of introns confirm that a variation in the noncoding region of these genes can influence glucose, fat, and energy metabolism during the high-lactation state. The differences in the studied breed, sample size, and the applied statistical model are considered as the main reasons of the contradictory results. In addition, these inconsistent results might be due to gene fusion and paternal effects. On the other hand, factors like animal’s age and health (particularly the mammary gland) would influence milk production and composition traits. The in-consistency of our findings with other researches necessitate more investigation in larger numbers of cows of different breeds to reveal molecular mechanisms causing the QTL effects.
CONCLUSION
Milk and its products are regarded as the most important nutritional resource, meeting the energy requirements and offering high quality protein and various vitamins and minerals. Earlier, most genetic improving programs of agriculturally im-portant livestock population have been carried out through complete phenotypic and pedigree information. However, applying molecular genetic information in breeding stock may lead to a bet-ter understanding of quantitative traits. Hence, the present study investigated the association of different PPARGC1A and OPN genotypes with milk production and composition traits in Iranian Holstein cows. Generally, detection and estima-tion of associaestima-tions of identified genes and genetic markers with economic traits are the basis of a successful application of marker-assisted selection (MAS) in breeding programs. The MAS strate-gies can be used for pre-selection of young bulls prior to progeny test. Finally, MAS can potentially raise annual genetic gain through increasing the accuracy of evaluation, increasing the selection intensity, and decreasing the generation interval.
REFERENCES
[image:7.595.63.291.125.272.2]Alim M.A., Fan Y., Xie Y., Wu X., Sun D., Zhang Y., Zhang S., Zhang Y., Zhang Q., Lin L. (2012): Single nucleotide polymorphism (SNP) in PPARGC1A gene associates milk production traits in Chinese Holstein cattle. Pakistan Veterinary Journal, 32, 609–612.
Table 4. PPARGC1A and OPN variances for significant milk traits in Iranian Holstein cows
Loci Traits Variance (%)
c.1892T>C
FATP2X 2.20
EBVFP 4.32
EBVM 1.03
PRO305 1.07
PROME 1.54
c.3359A>C FATP2X 1.35
EBVFP 1.32
c.8514C>T FATP2X 2.72
PROPER305 6.34
FATP2X = milk fat content adjusted for two milkings per day (%), EBVM = estimated breeding value for milk (kg), EBVFP =
esti-mated breeding value for milk fat content (%), PRO305 = milk protein yield adjusted for 305 days (kg), PROPER305 = milk
Ashwell M.S., Heyen D.W., Sonstegard T.S., Van Tassell C.P., Da Y., VanRaden P.M., Ron M., Weller J.I., Lewin H.A. (2004): Detection of quantitative trait loci affecting milk production, health, and reproductive traits in Holstein cattle. Journal of Dairy Science, 87, 468–475.
Bayless K.J., Davis G.E., Meininger G.A. (1997): Isolation and biological properties of osteopontin from bovine milk. Protein Expression and Purification, 9, 309–314.
Chorev M., Carmel L. (2012): The function of introns. Frontiers in Genetics, 3, 1–15.
Denhardt D.T., Noda M., O’Regan A.W., Pavlin D., Berman J.S. (2001): Osteopontin as a means to cope with environmen-tal insults: regulation of inflammation, tissue remodeling, and cell survival. Journal of Clinical Investigation, 107, 1055–1061.
Falconer D.S., Mackay T.F.C. (1996): Introduction to Quantita-tive Genetics. Addison Wesley Longman Ltd., Harlow, UK. Hill W.G., Robertson A. (1968): Linkage disequilibrium in
finite populations. Theoretical and Applied Genetics, 38, 226–231.
Khatib H., Zaitoun I., Wiebelhaus-Finger J., Chang Y.M., Rosa G.J.M. (2007): The association of bovine PPARGC1A and OPN genes with milk composition in two independent Holstein cattle populations. Journal of Dairy Science, 90, 2966–2970.
Khatkar M.S., Thomson P.C., Tammen I., Raadsma H.W. (2004): Quantitative trait loci mapping in dairy cattle: review and meta-analysis. Genetics Selection Evolution, 36, 163–190. Knott S.A., Elsen J.M., Haley C.S. (1996): Methods for
mul-tiple-marker mapping of quantitative trait loci in half-sib populations. Theoretical and Applied Genetics, 93, 71–80. Komisarek J., Dorynek Z. (2009): Effect of ABCG2, PPARGC1A,
OLR1 and SCD1 gene polymorphism on estimated breed-ing values for functional and production traits in Polish Holstein-Friesian bulls. Journal of Applied Genetics, 50, 125–132.
Kowalewska-Luczak I., Kulig H., Kmiec M. (2010): Associa-tions between the bovine PPARGC1A gene and milk produc-tion traits. Czech Journal of Animal Science, 55, 195–199. Leonard S., Khatib H., Schutzkus V., Chang Y.M., Maltecca
C. (2005): Effects of the osteopontin gene variants on milk production traits in dairy cattle. Journal of Dairy Science, 88, 4083–4086.
Liang H., Ward W. (2006): PGC-1 α: a key regulator of en-ergy metabolism. Advances in Physiology Education, 30, 145–151.
Nemir M., Bhattacharyya D., Li X., Singh K., Mukherjee A.B., Mukherjee B.B. (2000): Targeted inhibition of osteopontin
expression in the mammary gland causes abnormal mor-phogenesis and lactation deficiency. Journal of Biological Chemistry, 14, 969–976.
Olsen H.G., Lien S., Gautier M., Nilsen H., Roseth A., Berg P.R., Sundsaasen K.K., Svendsen M., Meuwissen T.H. (2005): Mapping of a milk production quantitative trait locus to a 420-kb region on bovine chromosome 6. Genetics, 169, 275–283.
Pareek C.S., Czarnik U., Pierzchala M., Zwierzchowski L. (2008): An association between the C>T single nucleotide polymor-phism within intron IV of osteopontin encoding gene (SPP1) and body weight of growing Polish Holstein-Friesian cattle. Animal Science Papers and Reports, 26, 251–257.
Rodriguez-Zas S.L., Southey B.R., Heyen D.W., Lewin H.A. (2002): Detection of quantitative trait loci influencing dairy traits using a model for longitudinal data. Journal of Dairy Science, 85, 2681–2691.
Ron M., Kliger D., Feldmesser E., Seroussi E., Ezra E., Weller J.I. (2001): Multiple quantitative trait locus analysis of bo-vine chromosome 6 in the Israeli Holstein population by a daughter design. Genetics, 159, 727–735.
Schennink A., Bovenhuis H., Leon-Kloosterziel K.M., Aren-donk A.M., Visker M.H.P. (2009): Effect of polymorphisms in the FASN, OLR1, PPARGC1A, PRL and STAT5A genes on bovine milk-fat composition. Animal Genetics, 40, 909–916 Schnabel R.D., Kim J.J., Ashwell M.S., Sonstegard T.S., Van Tassell C.P., Connor E.E., Taylor J.F. (2005): Fine-mapping milk production quantitative trait loci on BTA6: analysis of the bovine osteopontin gene. Proceedings of the National Academy of Sciences of the United States of America, 102, 6896–6901.
Senger D.R., Perruzzi C.A., Papadopoulos A., Tenen D.G. (1989): Purification of a human milk protein closely similar to tumor-secreted phosphoproteins and osteopontin. Bio-chimica et Biophysica Acta, 996, 43–48.
Weikard R., Kuhn C., Goldammer T., Freyer G., Schwerin M. (2005): The bovine PPARGC1A gene: molecular character-ization and association of an SNP with variation of milk fat synthesis. Physiological Genomics, 21, 1–13.
White S.N., Casas E., Allan M.F., Keele J.W., Snelling W.M., Wheeler T.L., Shackelford S.D., Koohmaraie M., Smith T.P.L. (2007): Evaluation in beef cattle of six deoxyribo-nucleic acid markers developed for dairy traits reveals an osteopontin polymorphism associated with postweaning growth. Journal of Animal Science, 85, 1–10.
Received: 2014–05–25 Accepted after corrections: 2014–09–26
Corresponding Author