Electron Concentration and Structural Transformation of Ni2MnGa Based Shape Memory Alloys
6
0
0
Full text
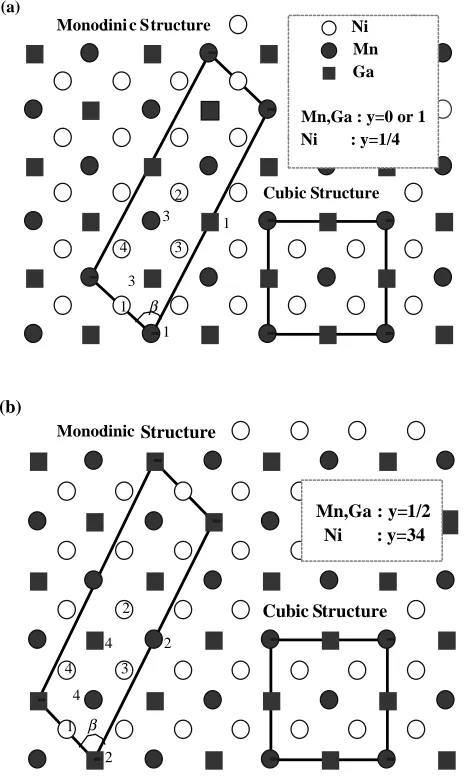
(2) Electron Concentration and Transformation of Ni2 MnGa-Based Alloys. (a) Monoclini c Structure. Ni Mn Ga Mn,Ga : y=0 or 1 Ni : y=1/4 Cubic Structure. 2 3 4. 1 3. 3 1 1. 847. e/a = 7.5–7.625 and Ni2 (Ni1/6 Mn4/6 X1/6 )Ga (sys-M2) in the range of e/a = 7.625–7.8. The range of e/a for the sys-N1 and the sys-M2 correspond to the range of e/a = 7.50–7.80 of Tsuchiya et al.9) When we cannot choose a real element as the X atom for the special value of e/a, we adopt an artificial atom. The artificial atom is described like Z27.5 where the number of 27.5 means the atomic number and the number of electrons. When we estimate the value of e/a, the numbers of valence electrons of Z27.5 and Z28.5 are assumed to be 9.5 and 10.5, respectively. Band calculations were carried out self-consistently by the LMTO-ASA method.10) The exchange correlation potential was treated within the framework of the local-spin-density (LSD) approximation.11) 3. Results and Discussion. (b) Monoclinic Structure. Mn,Ga : y=1/2 Ni : y=34. 2 2. 4 4. Cubic Structure. 3 4. 1 2. Fig. 1 Crystal structure of Ni2 MnGa. The constituent atoms on the y = 0 and y = 1/4 planes are shown in (a) and ones on y = 1/2 and y = 3/4 planes in (b). The cubic structure has the monoclinic symmetry expect for the cubic symmetry. The unit cell with the monoclinic symmetry are shown, where the unique angle β is 71.565 degrees. The four types of constituent atoms are distinguished by the numbers. In Ni2 (Ni1/6 Mn5/6 )Ga, the Mn(1) atoms in Ni2 MnGa are replaced with the Ni atoms. In the pseudo ternary alloys Ni–Mn–Ga–X, the Mn(2) or the Ni(1) atoms are replaced with the X atoms.. planes.2) The alloy where a sixth of Mn atoms in stoichiometric Ni2 MnGa are replaced with Ni atoms is described as Ni2.17 Mn0.83 Ga in the previous papers.4) In this paper, the alloy is described as Ni2 (Ni1/6 Mn5/6 )Ga where the excess Ni atoms at the Mn(1) sites are described in parentheses with the Mn atoms. Here, we consider two cases where Ni or Mn atoms in Ni2 (Ni1/6 Mn5/6 )Ga are replaced with X atoms. That is, X atoms are replaced with Ni atoms at the Ni(1) sites or Mn atoms at the Mn(2) sites. The former alloys are described as sys-N1 and the latter alloys as sys-M2 in this paper. The alloys in the sys-N1 and the sys-M2 are described as (Ni5/6 X1/6 )2 (Ni1/6 Mn5/6 )Ga and Ni2 (Ni1/6 Mn4/6 X1/6 )Ga respectively. The environments of the constituent atoms are largely different in the cubic structure and the monoclinic structure. When transition elements are chosen as the X atoms, (Ni5/6 X1/6 )2 (Ni1/6 Mn5/6 )Ga (sys-Ns1) is in the range of. 3.1 Density of states 3.1.1 Density of states in the sys-M2 We examine the local density of states (DOS) of the sysN1 and the sys-M2 for the two structures, in order to examine the effect of substituting Ni(1) atoms or Mn(2) atoms for the X atoms. Then, we pay attention to the DOS of d-states of the X atom, because they are most different in the two systems. The X atom is strongly affected by the surrounding atoms, which are eight Ni atoms in the sys-M2 and four Ni atoms and four Ga atoms in the sys-N1. First of all, we pay attention to the local DOS of the X atom (X-DOS) in the sysM2. The X-DOS the cubic structure is shown in Figs. 2(a) and (b) and those of the monoclinic structure in Figs. 2(c) and (d). The variation is seen in the X-DOS for X=Mn, Fe, Co and Ni atoms. The vertical line denotes the Fermi level. The X-DOS curves of the cubic structure have two large peaks. These two large peaks are the characteristic of the DOS of a bcc transition metal, because eight Ni atoms surround these atoms. The large valley of X atoms disappears and the occupied states generally move to the states with the lower energy, when the cubic structure changes to the monoclinic structure. This suggests that the energy of the monoclinic structure is lower than the cubic structure. The X-DOS curve in the minority spin states shifts from the higher energy region to the lower energy region beyond the Fermi level with increasing e/a, when the X atom changes from Mn to Ni in the order of Mn, Fe, Co and Ni. This is mainly due to the fact that the Coulomb potential becomes deeper with increasing the atomic number. On the other hand, the two large peaks of the majority spin exist under the Fermi level and shift to the higher energy region with increasing e/a, when the X atom is replaced with Fe, Co and Ni atom except for Mn in this order. This is a reason why the exchange split becomes small from X=Fe to Ni. That is, the split between the majority spin and the minority spin decreases with decreasing of the magnetic moment. The disappearance of the valley with a change from the cubic structure to the monoclinic structure brings a large difference in the occupancy of electrons. This difference tends to be larger with increasing number of valence electrons of the X atoms, that is, the electron concentration e/a. The difference also causes the energy difference between the two crystal structures..
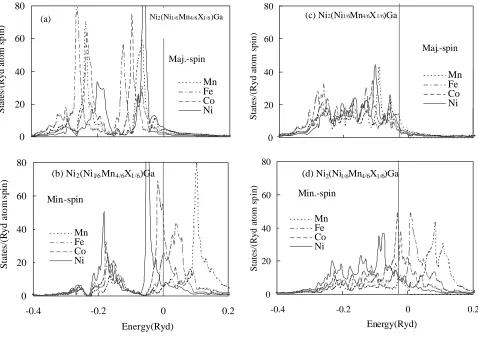
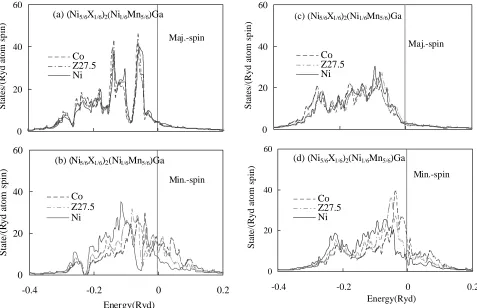
(3) 848. K. Yamaguchi, S. Ishida and S. Asano. 80. 80 States/(Ryd atom spin). States/(Ryd atom spin). (c) Ni2(Ni1/6Mn4/6X 1/6)Ga. Ni2(Ni1/6 Mn4/6 X1/6 )Ga. (a). 60 Maj.-spin. 40 Mn Fe Co Ni. 20 0. 60 Maj.-spin 40. 20. 0 80. 80. 40 20 0 -0.4. (d) Ni2(Ni1/6Mn4/6X1/6)Ga States/(Ryd atom spin). States/(Ryd atom spin). (b) Ni 2(Ni1/6 Mn 4/6X1/6)Ga 60. Mn Fe Co Ni. Min.-spin Mn Fe Co Ni. 60. 40. Min.-spin Mn Fe Co Ni. 20. 0. -0.2. 0. 0.2. Energy(Ryd). -0.4. -0.2. 0. 0.2. Energy(Ryd). Fig. 2 Local DOS of X atoms in the sys-M2. Four curves distinguish the cases of X=Mn, Fe, Co and Ni in Ni2 (Ni1/6 Mn4/6 X1/6 )Ga, respectively. The DOS ((a) and (b)) of the cubic structure are shown in the left-hand side and those ((c) and (d)) of the monoclinic structure in the right-hand side. The upper ((a) and (c)) and the lower ((b) and (d)) are of the majority and the minority spin. The vertical line shows the Fermi level.. 3.1.2 Density of states in the sys-N1 As described above, the circumstances of the X atom in the sys-N1 are different from those in the sys-M2. It is expected that the X-DOS is different between the two systems. The X-DOS in the sys-N1 is compared for the cubic structure and the monoclinic structure in Fig. 3. In the cubic structure, the X-DOS of the sys-N1 has peaks in the large valley of the X-DOS in the sys-M2. In the monoclinic structure, the DOS of the sys-N1 roughly preserves the shape of the cubic structure, compared with the case of the sys-M2. Therefore, the moldering of the DOS peaks with transforming from the cubic structure to the monoclinic structure is smaller in the sys-N1 than in the sys-M2. It is guessed that the energies difference (∆E) between the two structures is smaller in the sys-N1 than the sys-M2. Next, we examine the change of the DOS against e/a. In the cubic and the monoclinic structures, although the changes due to the difference of the X atom are seen in the majority spin as shown Figs. 3(a) and (c), the changes are extremely small, compared with those in the sys-M2 (in Figs. 2(a) and (c)). In the minority spin, the X-DOS shown in Figs. 3(b) and (d) is more occupied with increasing the atomic number as those in the sys-M2 (in Figs. 2(b) and (d)). Thus, the change of X-DOS due to the difference of X atoms is smaller, compared with those in the sys-M2. Therefore, the slope of ∆E (e/a) is expected to be small. The relation between the X-DOS and ∆E (e/a) will be described later in more detail.. 3.2 Magnetic moment The magnetic moment per atom for the cubic structure decreases like a straight line for the sys-N1 and like a sigmoid for the sys-M2 with increasing e/a as shown in Fig. 4. The magnetic moment per atom of the cubic is 2.87 µB for X=Fe (e/a = 7.667), 1.57 µB for X=Co (e/a = 7.708) of the sysM2 and 1.21 µB for X=Co (e/a = 7.542) of the sys-N1. The magnetic moment of Co for the sys-M2 is about 23 percent greater than Co in the sys-N1. This is due to the difference of the DOS of shapes of DOS curve between the sys-M2 and the sys-N1. The magnetic moment of Fe for the sys-M2 is about 30 percents greater than magnetic moment of bcc Fe. 3.3 Total energy and valence electron concentration The difference (∆E) of the total energies between the cubic and the monoclinic structure were calculated as a function of the valence electron concentration per atom (e/a). The total energies of (Ni5/6 X1/6 )2 (Ni1/6 Mn5/6 )Ga (sys-N1) were calculated for X=Co, Z27.5 and Ni and those of Ni2 (Ni1/6 Mn4/6 X1/6 )Ga (sys-M2) for X=Mn, Fe, Co, Z27.5, Ni and Z28.5. Their values per unit cell are plotted by triangles for the sys-N1 in Fig. 5 and by circles for the sys-M2. The e/a range of the former is e/a = 7.542–7.625 and one of the latter e/a = 7.625–7.77. The case of X=Ni in the sys-N1 is equivalent to the case of X=Mn in the sys-M2 which corresponds to e/a = 7.625. The curve consists of a straight line and a parabolic line with a boundary of e/a = 7.625. The.
(4) Electron Concentration and Transformation of Ni2 MnGa-Based Alloys. 60. 60 (c) (Ni5/6X1/6)2(Ni1/6Mn5/6)Ga States/(Ryd atom spin). States/(Ryd atom spin). (a) (Ni5/6X1/6)2(Ni1/6Mn5/6)Ga Maj.-spin 40. Co Z27.5 Ni 20. Maj.-spin. 40. Co Z27.5 Ni. 20. 0. 0. 60. 60. (d) (Ni5/6X1/6)2(Ni1/6Mn5/6)Ga State/(Ryd atom spin). (b) (Ni5/6X1/6)2(Ni1/6Mn5/6)Ga State/(Ryd atom spin). 849. Min.-spin. 40. Co Z27.5 Ni. 20. 40. Co Z27.5 Ni 20. 0. 0 -0.4. Min.-spin. -0.2. 0. -0.4. 0.2. -0.2. 0 Energy(Ryd). Energy(Ryd). 0.2. 4 Pseudo ternary alloys Ni-Mn-Ga-X 3.5 Mn Mn Moment on X atom 3 (Ni2MnGa) Fe 2.5 sys-M2 2 sys-N1 Co 1.5 1 Co Z27.5 0.5 Z27.5 Ni Ni Z28.5 0 7.45 7.55 7.65 7.75 7.85 Valence Electron Concentration, e/a. Fig. 4 Magnetic moment per atom of the X atom against the valence electron concentration (e/a) in the cubic structure. The open circles and the open triangles show the sys-M2 and the sys-N1, respectively. A open square shows the magnetic moment of the Mn atom in Ni2 MnGa.. difference ∆E increases linearly with increasing e/a in the range of the sys-N1. On the other hand, ∆E changes like a parabola with a top at X=Co, with increasing e/a in the range of the sys-M2. That is, the variation of ∆E is steeper for the sys-M2 than for the sys-N1. Now, we examine relation between the difference ∆E and change of the X-DOS. As seen in Fig. 2 and Fig. 3, the X-DOS of the sys-N1 (X atoms at the Ni sites) and the sysM2 (X atoms at the Mn sites) are fairly different in the cubic. 0.36. E(Cub)-E(Mono )=. Cal.. 0.35. Co. 0.34. E (Ryd). Moment,. B. Fig. 3 Local DOS of X atoms in the sys-N1. Three curves distinguish for the case of X=Co, Z27.5 and Ni in (Ni5/6 X1/6 )2 (Ni1/6 Mn5/6 )Ga, respectively. The DOS ((a) and (b)) of the cubic structure are shown in the left-hand side and those ((c) and (d)) of the monoclinic structure in the right-hand side. The upper ((a) and (c)) and the lower ((b) and (d)) are of the majority and the minority spin. The vertical line shows the Fermi level.. Fe. sys -N1. 0.33 0.32. E Z27.5 Ni Z28.5. Mn Ni. 0.31 Z27.5 0.3. Co 7.625. Mn. 0.29 0.28. 7.48. 7.53. 7.58. 7.63. 7.68. 7.73. 7.78. Valence Electron Concentrat ion, e/a Fig. 5 Difference (∆E) of total energies between a cubic and a monoclinic structure and valence electron concentration(e/a). A straight line with the triangles and a parabolic line with the circles denote the sys-N1 and the sys-M2, respectively. A heavy broken line with the solid circles shows the line connecting ∆E for Ni2 (Mn)Ga, Ni2 (Ni1/6 Mn5/6 )Ga and Ni2 (Ni2/6 Mn4/6 )Ga. The vertical line shows e/a = 7.625. The case of X=Ni in the sys-N1 is equivalent to the case of X=Mn in the sys-M2 which corresponds to e/a = 7.625.. structure. When the cubic structure transforms to the monoclinic one, the change of the X-DOS is larger in the sys-M2 than in the sys-N1. Therefore, the structural transformation brings larger differences ∆E for the sys-M2, compared with.
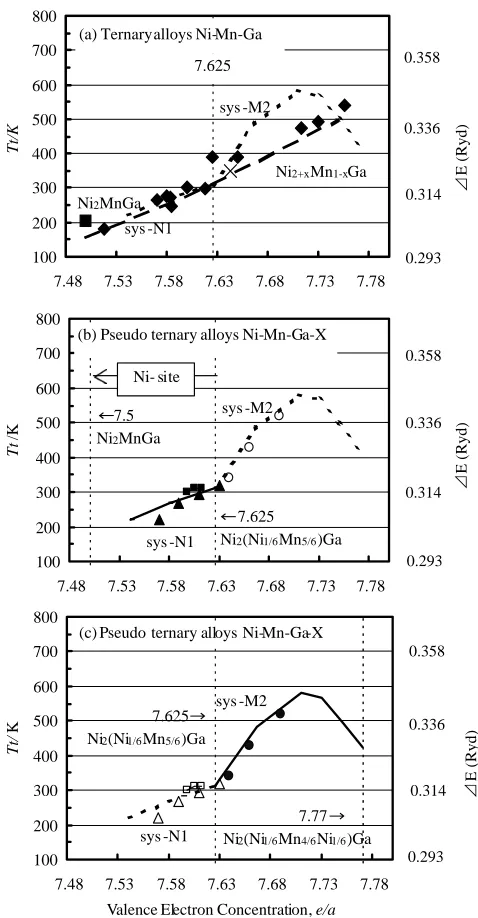
(5) K. Yamaguchi, S. Ishida and S. Asano. 800 (a) Ternary alloys Ni-Mn-Ga 700 600 0.336. 400 Ni2+x Mn1-xGa 0.314. Ni2MnGa 200. sys -N1. 100 7.48. where U is the internal energy, T is a temperature and S is the entropy. The differences of F, U and S between the cubic and monoclinic structures satisfy the equation. E (Ryd). sys -M2. 500. 300. F = U − T S,. 0.293. 7.53. 7.58. 7.63. 7.68. 7.73. 7.78. 800 (b) Pseudo ternary alloys Ni-Mn-Ga-X 700. 0.358. Ni- site. Tt /K. 600. 7.5 Ni2MnGa. 500. sys -M2 0.336. 400 300. E (Ryd). ∆F = ∆U − Tt ∆S = 0. 0.314. 200. sys -N1. 100 7.48. 7.625 Ni2(Ni1/6 Mn5/6 )Ga 0.293. 7.53. 7.58. 7.63. 7.68. 7.73. 7.78. 800 (c) Pseudo ternary alloys Ni-Mn-Ga-X 0.358. 700 600 Tt/ K. at the transition temperature Tt . Therefore, Tt can be estimated by ∆U/∆S. However, we cannot calculate ∆S and the total energy does not include the temperature effects on the electronic structures and the lattice vibration energy. As generally speaking, it is very difficult to calculate Tt as well as the Curie temperature from the electronic structure. When we assume daringly ∆U = ∆E and use the observed values of Tt , we can estimate very roughly the ∆S. For example, the values of ∆S for e/a = 7.5–7.77 are ∆S = 2.0–0.3 J/gK, which decrease with increasing e/a. These values should be evaluated seriously because of the reasons described above. In the followings, we compare Tt and ∆E. The heavy broken line in Fig. 5 corresponds to a line connecting three points of ternary alloys Ni–Mn–Ga: Ni2 (Mn)Ga (e/a = 7.5), Ni2 (Ni1/6 Mn5/6 )Ga (e/a = 7.625) and Ni2 (Ni2/6 Mn4/6 )Ga (e/a = 7.75). To examine the correspondence between ∆E and Tt , they are compared for the ternary alloys Ni–Mn–Ga and the pseudo ternary alloys Ni–Mn–Ga–X in Fig. 6.5, 8, 9) Here, the values of Tt denotes a martensitic temperature. The values of Tt refer to the left axis and those of ∆E to the right axis. In the Fig. 6, the curves of ∆E are shown with the values of Tt so that the ∆E values of the case X=Ni in the sys-N1 and the case X=Mn in the sys-M2 are superposed on the values of Tt at e/a = 7.625 and 7.708 of the two cases. The values of Tt for ternary Ni2+x Mn1−x Ga and Ni2.18 Mn0.82 Ga are plotted by diamonds and cross, which were observed by Tsuchiya et al. and Inoue et al., respectively.5, 9) These values distribute along the heavy broken line in Fig. 5. The Tt values of the pseudo ternary alloys Ni–Mn– Ga–X are also plotted in Figs. 6(b) and (c). In the lower range e/a < 7.625, their values distribute along the heavy line of ∆E (e/a) obtained for the sys-N1. That is, the heavy line of the sys-N1 corresponds to the data plotted by the solid squares for (e/a, Tt ) = (7.6125, 313 K), (7.605, 311 K) and (7.5975, 301 K) of Ni2.16−x Cox Mn0.84 Ga and the solid triangles for (e/a, Tt ) = (7.57, 220 K), (7.59, 266 K), (7.61, 292 K) and (7.63, 317 K) of Ni2.20 Fez Mn0.80−z Ga. Next, we pay attention to the data plotted in the higher range e/a > 7.625 which are shown in Fig. 6(c) by the solid circles for (e/a, Tt ) = (7.64, 342 K), (7.67, 429 K), (7.69, 518 K) in Ni2.16 Mn0.84−y Co y Ga. They are along the heavy curve for the sys-M2. The correspondence between ∆E (e/a) and Tt (e/a) described above suggests that the X atoms prefer the Ni sites for the range e/a < 7.625 and the Mn sites for the range. 0.358. 7.625. 500. sys -M2 7.625 Ni2(Ni1/6 Mn5/6 )Ga. 0.336. 400 300. 0.314. 200 100 7.48. E (Ryd). those of the sys-N1. Furthermore, we noticed that change of the X-DOS due to the difference of the X atom is larger for the sys-M2 than the sys-N1. These features correspond to the linear change and the parabolic change of the ∆E (e/a), respectively. Thus, the differences ∆E are reflected on the differences of the DOS curves due to different structures and different X atoms. The variation ∆E (e/a) is compared with the structural transition temperature Tt (e/a) in followings. The Helmholtz free energy F is expressed as. Tt/K. 850. sys -N1. 7.77 Ni2(Ni1/6 Mn4/6 Ni1/6 )Ga 0.293. 7.53. 7.58. 7.63. 7.68. 7.73. 7.78. Valence Electron Concentration, e/a Fig. 6 Comparison between transition temperature (Tt ) and Difference (∆E). The ∆E (e/a) curves drawn by a heavy line are compared with the experimental values (solid or open marks) of the Tt (e/a). In Fig. (a), the solid diamonds and cross and large square are of ternary alloys Ni–Mn–Ga, Ni2.18 Mn0.82 Ga and Ni2 MnGa, respectively. In Figs. (b) and (c), the solid squares, triangles and circles, show the data of Ni2.16−x Cox Mn0.84 Ga, Ni2.20 Fez Mn0.80−z Ga and Ni2.16 Mn0.84−y Co y Ga respectively. That is, Figs. (b) and (c) are for the sys-N1 and the sys-M2.. e/a > 7.625, when the constituent atoms of Ni2 MnGa are substituted for the X atoms. The value e/a = 7.625 seems to be the critical point for the structural transition temperature. 4. Conclusion The electronic structures of (Ni5/6 X1/6 )2 (Ni1/6 Mn5/6 )Ga (sys-N1) and Ni2 (Ni1/6 Mn4/6 X1/6 )Ga (sys-M2) were calculated for the cubic structure and the monoclinic one to examine the electron concentration dependence of the structural transition temperature Tt (e/a). The difference of the total energies between the cubic structure and the monoclinic one is also calculated as a function of the concentration ∆E (e/a)..
(6) Electron Concentration and Transformation of Ni2 MnGa-Based Alloys. It was found that the features of Tt (e/a) and ∆E (e/a) are similar each other. That is, there is a good correspondence between Tt (e/a) and ∆E (e/a). Their curves consist of two parts with a boundary of e/a = 7.625 (Ni2 (Ni1/6 Mn5/6 )Ga). In the range e/a < 7.625 (sys-N1), they increase linearly with increasing e/a and in the range e/a > 7.625 (sys-M2), they vary along a heavy line. Paying attention to the X atom which replaces the Mn or Ni atom in Ni2 (Ni1/6 Mn5/6 )Ga, we can guess the variation of ∆E (e/a) from the local DOS of the X atom and the occupancy. The X atom occupies the Ni site in the range e/a < 7.625 (sys-N1) and the Mn site in the range e/a > 7.625. The change of the local DOS is larger for the X atom at the Mn site than the X atom at the Ni site, when the crystal structure changes between the cubic structure the monoclinic one. The changes reflect on the features of ∆E (e/a). Thus, the site of the X atom is an important factor in considering the structural transition temperature. Acknowledgments The authors wish to thank Professor Koichi Tsuchiya of Toyohashi University of Technology for giving information and significant discussions. This work was supported by a Grant-in-Aid (13640638) for scientific Research from the. 851. Ministry of education, Science and Culture of Japan. REFERENCES 1) P. J. Webster, K. R. A. Ziebeck, S. L. Town and M. S. Peak: Philos. Mag. B 49 (1984) 259–310. 2) K. Inoue, K. Enami, M. Igawa, K. Inoue, Y. Yamaguchi and K. Ohoyama: Proc. Int. Conf. on Solid-Solid Phase Transformations (1999) pp. 1120–1123. 3) A. N. Vasil’ev, A. D. Bozhko, V. V. Khovailo, I. E. Dikshtein, V. G. Shavrov, V. D. Buchelnikov, M. Matsumoto, S. Suzuki, T. Takagi and J. Tani: Phys. Rev. B 59 (1999) 1113–1120. 4) S. Ishida, M. Furugen and S. Asano: Int. J. of Appl. Electro. and Mechan. 12 (2000) 41–48. 5) K. Inoue, K. Enami, M. Igawa, Y. Yamaguchi, K. Ohoyama, Y. Morii, Y. Matsuoka and K. Inoue: Int. J. of Appl. Electro. and Mechan 12 (2000) 25–34. 6) V. A. Chernenko: Scr. Mater. 40 (1999), 523–527. 7) K. Tsuchiya: Private communication. 8) V. Khovalio: Proc. Seminar. on Shape Memory Alloys Related Technology, (Inst. Fluid Science, Tohoku University, 1999) pp. 30–33. 9) K. Tsuchiya, A. Ohashi, D. Ohtoyo, H. Nakamura, M. Umemoto and P. G. McCormik: Mater. Trans., JIM, 41 (2000) 938–942. 10) O. K. Andersen, O. Jepsen and D. Glotzel: Proc. Int. School of Physics “Enrico Fermi” Course 89, ed. by F. Bassami, F. Fumi and M. P. Tosi (North-Holland, Amsterdam, 1985) pp. 59–176. 11) V. L. Moruzzi, J. F. Janak and A. R. Williams: Calculated Electronic Properties of Metals, (Pergamon, New York, 1978) pp. 1–22..
(7)
Figure
Related documents