XPS Study of Corrosion Behavior of Ti–18Nb–4Sn Shape Memory Alloy
in a 0.05 mass% HCl Solution
Asahi Kawashima
1, Sadao Watanabe
2, Katsuhiko Asami
2and Shuji Hanada
2 1The Oarai Branch, Institute for Materials Research, Tohoku University, Ibaraki 311-1313, Japan 2Institute for Materials Research, Tohoku University, Sendai 980-8577, Japan
The Ti–18Nb–4Sn alloy has been confirmed to possess much higher corrosion resistance compared to the NiTi alloy throughout immersion time up to 604.8 ks in a 0.05 mass% HCl at 310 K open to air. The Ti–18Nb–4Sn alloy shows higher open circuit potential, compared to titanium metal and NiTi alloy. The higher open circuit potential results in an increase in the thickness of the passive film formed on the alloy. The passive film on the Ti–18Nb–4Sn alloy is rich in niobium as well as tin due to preferential dissolution of titanium. The degree of enrichment of niobium and tin in the film increases with an increase in immersion time. On the other hand, the passive film on the NiTi alloy consists exclusively of titanium. The angle-resolved XPS analysis reveals that the outer part of the passive film on the Ti–18Nb–4Sn alloy is rich in niobium and deficient in titanium. Furthermore, the passive film on the Ti–18Nb–4Sn alloy is composed of a double oxyhydroxide containing titanium, niobium and tin cations. It can, therefore, be said that the formation of the thick and homogeneous double oxyhydroxide film whose outer part is rich in niobium seems responsible for the excellent corrosion resistance of the Ti–18Nb–4Sn alloy.
(Received March 19, 2003; Accepted May 29, 2003)
Keywords: Ti–18Nb–4Sn shape memory alloy, biomaterial, X-ray photoelectron spectroscopy, surface composition, passive film, 0.05 mass% HCl solution
1. Introduction
Among currently available shape memory alloys, NiTi
alloys have superior mechanical properties.1,2)These alloys
have been utilized for selected in vivo applications due to
their shape memory effect and superelasticity over the past two decades. On the other hand, there have been a number of reports associated with the susceptibility of NiTi alloys to
corrosion.3–5)When a metallic materials exposed within the
human body for a long time, elemental release is inevitable. It is well known that nickel is allergic and possibly
carcino-genic for the human body.6,7)Therefore it is desirable to use
nickel-free titanium-based shape memory alloys for bioma-terials.
Nitta et al. have reported that Ti–Nb–Sn alloys show a
good shape memory effect in a wide temperature range including room temperature and excellent deformability at
ambient temperature in comparison with NiTi alloys.8)
Niobium and tin are known to have no negative influences
on its biological environment,9) i.e. sufficiently low
cyto-toxicity.10,11) Recently, some of the present authors have
reported that the Ti–Nb–4Sn alloys were found to possess superior corrosion resistance in the simulated oral environ-ments, such as 0.9 mass% NaCl, 0.05 mass% HCl and
1.0 mass% lactic acid solutions open to air at 310 K.12)The
corrosion resistance of the alloys was comparable to or higher than that of commercially pure Ti (CPTi) and was much higher than that of the conventional shape memory NiTi alloy. In particular, in the 0.05 mass% HCl solution Ti–Nb– Sn alloys exhibited much higher corrosion resistance in comparison to CPTi and NiTi alloy. The total amount of released ions from Ti–18Nb–4Sn alloy in the HCl was about one fifth and one fifteenth as large as that from CPTi and NiTi alloy, respectively. Moreover, the amounts of ions released from the Ti–Nb–4Sn alloys were almost independent of alloyed niobium content from 10 to 20 at% in both the HCl and lactic acid solutions.
The work reported herein was undertaken to examine correlation between the surface composition and protective quality of a Ti–18Nb–4Sn alloy, which shows the highest shape memory performance among the Ti–Nb–4Sn alloys, in a 0.05%HCl and to compare with that of the currently used NiTi shape memory alloy. In the present work, X-ray photoelectron spectroscopy (XPS) was used to investigate the composition and thickness of the surface film.
2. Experimental Procedure
Ti–18Nb–4Sn (at%) alloy was arc-melted in an argon atmosphere using 99.99 mass% pure Ti, Nb and Sn. Speci-men plate of 1 mm in thickness was prepared by cold rolling of the cast alloy after heat treatment at 1373 K for 43.2 ks. In order to obtain reproducible results, the air-formed oxide film on the alloy was removed by mechanical polishing just before immersion of the specimen. Mechanical polishing was performed with SiC paper up to No. 1500 in cyclohexane, the specimen was then rinsed thoroughly with distilled water and ultrasonically with acetone.
The electrolyte used was a 0.05 mass% HCl solution open to air at 310 K, which was prepared by reagent grade chemical and distilled water. After open circuit immersion for various periods of time up to 604.8 ks (7 days), solution analysis was performed by inductively coupled plasma emission spectrometry (ICP) (Hitachi P-5200). The open circuit potential was also measured as a function of immersion time.
Before and after immersion in the solution, XPS spectra from the alloy specimens were measured by using a SSI
SSX-100 photoelectron spectrometer with Al K excitation
(h¼1486:6eV). In order to observe the inner and outer
by using a tilted specimen stage. Binding energies of electrons were determined by a calibration method described
elsewhere.13,14) The composition and thickness of surface
film and the composition of the substrate alloy immediately under the surface film were quantitatively determined by a previously proposed method, using integrated intensities of
spectra.15)The spectral peaks used for analysis were those of
Ti 2p3=2, Nb 3d5=2, Sn 3d5=2 and Ni 2p3=2, C 1s and O 1s
electrons. The photo-ionization cross-sections of the Ti 2p3=2,
Nb 3d5=2, Sn 3d5=2 and Nim 2p3=2, Niox 2p3=2 electrons
relative to the O 1s electrons used were 1.28,16) 2.98,17)
5.05,18) 7.4619) and 2.32,20) where superscripts m and ox
denote the metallic and oxidized states of element, respec-tively.
3. Results and Discussion
3.1 Immersion test
Figure 1 shows the change in amounts of released metal ions from Ti–18Nb–4Sn and NiTi alloys measured in a 0.05 mass% HCl at 310 K open to air as a function of immersion time. It is clearly seen that the dissolution rate of titanium of the Ti–18Nb–4Sn alloy is lower than that of NiTi alloy throughout immersion time up to 604.8 ks (7 days). The total amount of released ions from the Ti–18Nb–4Sn alloy is
much lower than that of NiTi alloy. Consequently, the Ti– 18Nb–4Sn alloy is confirmed to possess much higher corrosion resistance compared to NiTi alloy throughout the immersion time. For the Ti–18Nb–4Sn alloy, concentration of titanium ions released from the alloy is much higher than that of bulk alloy, indicating that preferential dissolution of titanium occurs.
3.2 Open circuit potential
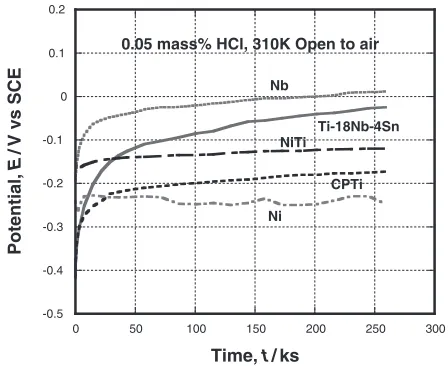
The change in the open circuit potentials with time for the Ti–18Nb–4Sn and the NiTi alloys in a 0.05 mass% HCl solution open to air at 310 K is shown in Fig. 2. Open circuit potentials of the CPTi, commercially pure Ni and Nb metals are also shown for comparison. Among these specimens, only pure Ni dissolved actively in the solution. Actually, after immersion for 260 ks uneven surface due to active dissolu-tion was observed on the pure nickel, although there were no evidences of significant change in the surface appearance of the other specimens even after immersion for 604.8 ks. Just after immersion, the open circuit potential of Ti–18Nb–4Sn alloy, which is lower than that of NiTi alloy and almost the
same level as that of CPTi, is about 0:4V (SCE), but
increases rapidly exceeding that of NiTi alloy and reaches a
value of 0:025V after immersion for about 260 ks, being
close to that of highly corrosion-resistant pure Nb.
3.3 XPS analysis of surface film
The corrosion behavior under the open circuit condition was further examined by XPS analysis of the surfaces formed on Ti–18Nb–4Sn and NiTi alloys before and after immersion in the HCl solution. XPS spectra from the alloys exhibited peaks of titanium, niobium, tin, nickel, oxygen, chlorine and carbon. The C 1s peak arose from a contaminant hydrocarbon layer covering the specimen surface. Cl 2p peak was assigned
to Clion in the surface film, but the concentration of Clion
[image:2.595.314.538.72.255.2]was negligibly small.
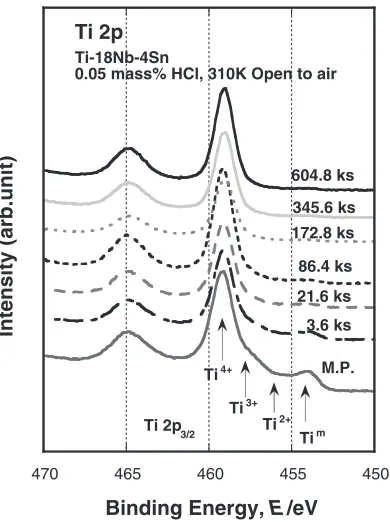
Figure 3 shows Ti 2p spectra for Ti–18Nb–4Sn specimen polished mechanically and after immersion in the solution for various times. The Ti 2p spectra consist of four sets of
doublet peaks corresponding to 2p3=2 and 2p1=2 peaks of
0.0 10.0 20.0 30.0 40.0 50.0 60.0 70.0
0 100 200 300 400 500 600 700
Released Metal Ions,
M
/
mg m
-2
Immersion Time, t/s
NiTi
0.05% HCl, 310K, Open to air
Ni
Ti
0.0 2.0 4.0 6.0 8.0 10.0
0 100 200 300 400 500 600 700
Released Metal Ions,
M
/mg m
-2
Immersion Time t/s
Ti-18Nb-4Sn
0.05% HCl, 310K, Open to air
Ti
Nb Sn
Fig. 1 Change in amounts of released metal ions from the Ti–18Nb–4Sn and NiTi alloys in a 0.05 mass% HCl open to air at 310 K as a function of immersion time.
-0.5 -0.4 -0.3 -0.2 -0.1 0 0.1 0.2
0 50 100 150 200 250 300
Potential,
E
/
V vs SCE
Time, t / ks
0.05 mass% HCl, 310K Open to air
Ti-18Nb-4Sn
CPTi NiTi
Ni Nb
[image:2.595.58.280.398.750.2]metallic and oxidized states. The dominant Ti 2p3=2peaks at
about 454.1 and 459.1 eV are assigned to the metallic (Tim)
and Ti4þ states, respectively. In the mechanically polished
surface a broad shoulder at around 457 eV which consists of two peaks at about 456 and 458 eV can be seen and are
assigned to Ti2þ and Ti3þ states, respectively.21) The
intensity in metallic state peak for the specimen decreases with immersion time and after immersion for 172.6 ks becomes very low, while the oxidized (4+) peak intensity increases with immersion time, indicating the formation of thick surface film and thickening with immersion time. After integration of individual spectra, the relative concentrations
[image:3.595.73.268.70.331.2]of Ti2þ, Ti3þand Ti4þions in the surface film were obtained.
Figure 4 shows the relative amounts of titanium species in the
air-formed film and spontaneously passivated film in the solution. It is obvious from this figure that major titanium
species in the passive film is Ti4þspecies. Similar result was
obtained for the passive film formed on the NiTi alloy. The Nb 3d spectrum consisted of two sets of doublet peaks
corresponding to 3d5=2 and 3d3=2 peaks of metallic and
oxidized states. As shown in Fig. 5, a pair of the metallic state
at about 202.4 and 205.2 eV and a doublet of the Nb5þstate
appears at about 207.8 and 210.5 eV.17)It can be clearly seen
that prolonged immersion leads to an increase in oxidized niobium, indicating an increase in niobium content in the film.
Sn 3d spectra consisted of two sets of doublet peaks
corresponding to 3d5=2 and 3d3=2 peaks of metallic and
oxidized states. The Sn 3d spectra consisted of two peaks at about 484.7 and 486.9 eV, corresponding to the metallic state
and Sn4þ state, respectively.22) Ni 2p3=2 spectra from NiTi
alloy specimen consisted of two peaks at about 853.0 and
856.3 eV, corresponding to the metallic and the Ni2þ states,
respectively.19) However, the intensity of the spectra for
nickel ion in the surface film was quite low, in contrast to those of titanium ions.
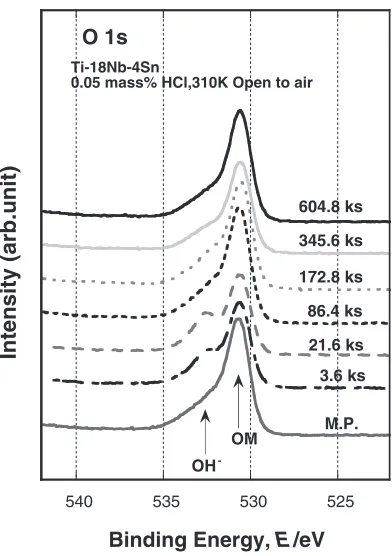
The O 1s spectra from the Ti–18Nb–4Sn alloy in various immersion times are shown in Fig. 6. The O 1s spectrum has apparently two peaks at about 530.6 and 532.6 eV. The low binding energy peak is assigned to oxygen in the metal-O-metal bond (OM oxygen). The broad signal in the high binding energy corresponds to oxygen in the metal-OH bond
and bound water (OH oxygen).14) The OM oxygen
corre-sponds to O2ions in oxyhydroxide and/or oxide. As can be
seen in Fig. 6, the relative intensities of OM peak increase with immersion time, indicating that the concentration of
O2 ions in passive film increases with immersion time.
Accordingly, stable passive film formed on Ti–18Nb–4Sn 450
455 460
465 470
Intensity (arb.unit)
Binding Energy, E/eV
M.P. 3.6 ks
Ti 2p
Ti-18Nb-4Sn
0.05 mass% HCl, 310K Open to air
21.6 ks 86.4 ks 172.8 ks 345.6 ks 604.8 ks
Tim
Ti4+
Ti 2p
3/2
Ti3+
Ti2+
Fig. 3 Ti 2p spectra for the Ti–18Nb–4Sn alloy immersed in a 0.05 mass% HCl open to air at 310 K for various durations.
0.0 0.3 0.7 1.0
100 101 102 103
Ti
n+ / Ti
ox
Immersion Time, t/ks
as-polished
Ti-18Nb-4Sn
open to air at 310K 0.05 mass% HCl
Ti
4+Ti
3+Ti
2+Fig. 4 Change in the ratios of titanium ion species in film on the Ti–18Nb– 4Sn alloy as a function of immersion time in a 0.05 mass% HCl open to air at 310 K.
195 200
205 210
Intensity (arb.unit)
Binding Energy,
E
/eV
M.P. 3.6 ks 21.6 ks 86.4 ks 172.8 ks 345.6 ks 604.8 ksNb 3d
Ti-18Nb-4Sn
0.05 mass% HCl, 310K Open to air
Nbm
Nb5+
[image:3.595.331.525.70.341.2] [image:3.595.59.280.568.747.2]alloy consists of oxyhydroxide in which O2 ions are the major oxygen species.
Figure 7 shows the change in thickness of the surface film formed on the alloys with immersion time. The thickness of the air-formed film is also shown for comparison. The thickness of air-formed film formed on Ti–18Nb–4Sn alloy is about 3.0 nm and gradually increases with immersion time, reaching 5.4 nm after immersion of 604.8 ks. Thus a significantly thick passive film is formed on the Ti–18Nb– 4Sn alloy specimen. As shown in Fig. 2, a positive shift in the open circuit potential with immersion time enhances the formation of a thicker passive film. The film thickness is directly proportional to the potential drop across the metal/
solution interface.23) An increase in film thickness should
lead to a further decrease in the already low metal release. By contrast, the thinner passive film was formed on the NiTi alloy. The film thickness of air-formed film formed on the NiTi alloy is about 2.8 nm, and after immersion for 3.6 ks film thickness slightly increases up to about 3.2 nm, and after 21.6 ks it becomes about 3.0 nm and keeps almost same value for prolonged immersion for 604.8 ks.
Figure 8 shows the change in the mass of cations in the passive film on Ti–18Nb–4Sn alloy as a function of immersion time. The mass of both cations of niobium and tin largely increases with immersion time, while that of titanium is almost independent of immersion time. Conse-quently, both niobium and tin cations contribute film thickening on the Ti–18Nb–4Sn alloy.
Figure 9 shows the cationic fractions of spontaneously passivated film for Ti–18Nb–4Sn alloy as a function of immersion time in the HCl solution open to air at 310 K. The composition of air-formed film on the alloy is also shown for
525 530
535 540
Intensity (arb.unit)
Binding Energy, E/eV
M.P. 3.6 ks 21.6 ks 86.4 ks 172.8 ks 345.6 ks 604.8 ks
Ti-18Nb-4Sn
0.05 mass% HCl,310K Open to air O 1s
OM
OH
-Fig. 6 O 1s spectra for the Ti–18Nb–4Sn alloy immersed in a 0.05 mass% HCl open to air at 310 K for various durations.
2.0 4.0 6.0 8.0
100
101
102
103
Film Thickness,
l
/nm
Immersion Time, t/ks
as-polished
Ti-18Nb-4Sn open to air at 310K 0.05 mass% HCl
NiTi
Fig. 7 Thickness of the surface films on the Ti–18Nb–4Sn and NiTi alloys in a 0.05 mass% HCl open to air at 310 K as a function of immersion time.
0.0 4.0 8.0 12.0 16.0 20.0
100
101
102
103
Mass of Surface Film,
M
/mg m
-2
as-polished
Ti Nb
Sn Ti-18Nb-4Sn
open to air at 310K 0.05 mass% HCl
Immersion Time, t/ks
Fig. 8 Mass of cations in the surface film formed on the Ti–18Nb–4Sn alloy as a function of immersion time in a 0.05 mass% HCl open to air at 310 K.
0.0 0.2 0.4 0.6 0.8 1.0
100
101
102
103
Cationic Fraction in Film
Immersion Time, t/ks
as-polished
Ti
Nb
Sn Ti-18Nb-4Sn
open to air at 310K 0.05 mass% HCl
[image:4.595.72.268.69.347.2] [image:4.595.314.537.331.507.2] [image:4.595.314.537.575.757.2] [image:4.595.59.281.577.757.2]comparison. As shown in this figure, the concentrations of constituent elements in the air-formed film for Ti–18Nb–4Sn alloy are nearly the same as those of bulk alloy. The immersion in the HCl for 3.6 ks leads to slight enrichment of Nb and Sn cations in the surface film and both Nb and Sn contents increase gradually with immersion time due to the preferential dissolution of Ti from the surface film. This is in agreement with the result of immersion test for Ti–18Nb–4Sn alloy, as shown in Fig. 1. Thus, the decrease in titanium content with a consequent increase in niobium and tin contents in the passive film on Ti–18Nb–4Sn alloy seems to enhance the corrosion resistance.
Figure 10 exhibits the cationic fraction in the passive film and atomic fraction in the underlying alloy surface for the NiTi alloy as a function of immersion time. The composition of air-formed film on the alloy is also shown for comparison. The air-formed film is significantly rich in Ti cation and underlying alloy surface is largely deficient in Ti atom, indicating that preferential oxidation of Ti takes place after/ during mechanical polishing in air. After immersion for 3.6 ks in the HCl solution, the cationic fraction of Ti further increases up to 0.95 due to dissolution of Ni and the Ti content keeps almost the same value for prolonged immer-sion of 604.8 ks. Accordingly, passive film on the NiTi alloy consists exclusively of titanium and such hydrated titanium
oxyhydroxide passive film is not sufficient to maintain high corrosion resistance in the HCl solution, compared with Ti– 18Nb–4Sn alloy.
In order to determine in-depth distribution of ions in the surface film, angle-resolved XPS analysis was performed. In general, the change in take-off angle of detection of photoelectrons from low to high angle gives information from the upper-most surface to the interior of the surface. Figures 11 and 12 show the cationic fraction in the passive film immersed in the HCl solution for 604.8 ks on Ti–18Nb– 4Sn and NiTi alloys as a function of sine of photoelectron take-off angle, respectively.
As shown in Fig. 11, the niobium content in the passive film for Ti–18Nb–4Sn alloy increases with decreasing the take-off angle of photoelectron, while the titanium content decreases with the take-off angle. Thus the passive film is significantly rich in niobium cation and deficient in titanium cation in the exterior part of the film. On the other hand, tin content in the film is almost independent of the take-off angle
0.0 0.2 0.4 0.6 0.8 1.0
100
101
102
103
Atomic Fraction
in Underlying Alloy
Immersion Time, t/ks
as-polished
Ti Ni
NiTi
open to air at 310K 0.05 mass% HCl (b)
0.0 0.2 0.4 0.6 0.8 1.0
100
101
102
103
Cationic Fraction in Film
Immersion Time, t/ks
as-polished
Ti
Ni NiTi
[image:5.595.317.538.323.502.2]open to air at 310K 0.05 mass% HCl (a)
Fig. 10 (a) Cationic fraction in the passive film and (b) atomic fraction in the underlying alloy surface for the NiTi alloy as a function of immersion time in a 0.05 mass% HCl open to air at 310 K.
0.0 0.2 0.4 0.6 0.8 1.0
0 0.2 0.4 0.6 0.8 1
Cationic Fraction in Film
Sin(Take-off Angle) Ti
Nb
Sn Ti-18Nb-4Sn
open to air at 310K 0.05 mass% HCl
Fig. 11 Cationic fraction in the passive film for the Ti–18Nb–4Sn alloy after immersion in a 0.05 mass% HCl open to air at 310 K for 604.8 ks as a function of sine of the photoelectron take-off angle.
0.0 0.2 0.4 0.6 0.8 1.0
0 0.2 0.4 0.6 0.8 1
Cationic Fraction in Film
Sin(Take-off Angle) Ti
Ni NiTi
[image:5.595.62.279.397.748.2]open to air at 310K 0.05 mass% HCl
[image:5.595.315.537.567.747.2]of photoelectron, indicating that tin cation is distributed homogeneously in the film.
The titanium content in the passive film for NiTi alloy is also almost independent of the take-off angle of photoelec-tron. Accordingly, the passive film on TiNi alloy consists exclusively of titanium and the titanium cation is distributed homogeneously in the film.
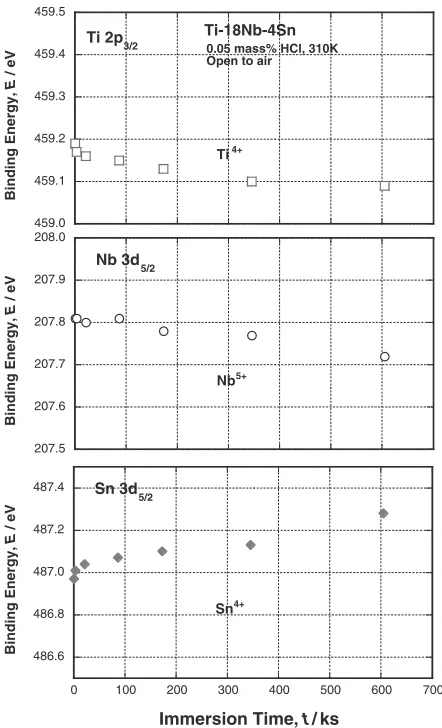
As mentioned above, XPS spectra of the Ti–18Nb–4Sn
alloy immersed in the HCl showed Ti4þ, Nb5þ and Sn4þ
peaks as major cations. The binding energy shifts of core electrons of oxidized states of titanium, niobium and tin with immersion time were observed. Figure 13 shows the change
in the binding energies of core electrons, that is Ti4þ 2p
3=2,
Nb5þ 3d5=2 and Sn4þ 3d5=2 electrons in the air-formed film
and in the passive film formed by immersion in the HCl solution as a function of immersion time. The binding
energies of Ti4þ 2p
3=2 and Nb5þ 3d5=2 electrons decrease
with immersion time, while that of Sn4þ 3d
5=2 electrons
increases with immersion time. This fact suggests that titanium, niobium and tin ions are distributed very closely and homogeneously in both air-formed and passive films, so
as to show the electronic interaction among Ti4þ, Nb5þand
Sn4þ ions. This revealed that the passive film on the Ti–
18Nb–4Sn alloy is not a simple mixture of titanium, niobium
and tin oxyhydroxides but a double oxyhydroxide of alloy components in which these cations are homogeneously distributed. The formation of the homogeneous double oxyhydroxide film enriched with niobium and tin cations seems to be responsible for the high corrosion resistance of Ti–18Nb–4Sn alloy in a 0.05 mass% HCl solution.
4. Conclusions
The newly developed shape memory Ti–18Nb–4Sn alloy immersed in a 0.05 mass% HCl solution open to air at 310 K was investigated by XPS measurements. The following conclusions are drawn:
(1) The higher corrosion resistance for Ti–18Nb–4Sn alloy compared to NiTi alloy is confirmed by immersion test up to 604.8 ks (7 days). The open circuit potential for the Ti–18Nb–4Sn alloy is higher than that of pure titanium or NiTi alloy.
(2) For the Ti–18Nb–4Sn alloy, the passive film is rich in niobium as well as tin due to preferential dissolution of titanium, although composition of air-formed film is nearly the same as that of bulk alloy. On the other hand, the passive film formed on the NiTi alloy consists exclusively of titanium.
(3) The significantly thicker passive film is formed on the Ti–18Nb–4Sn alloy, compared to the NiTi alloy. (4) According to the angle-resolved XPS analysis, the outer
part of the passive film is rich in niobium, and is deficient in titanium.
(5) The air-formed film and passive film on the Ti–18Nb– 4Sn alloy are composed of double oxyhydoxides of titanium, niobium and tin. The double oxyhydroxide passive film on the Ti–18Nb–4Sn alloy seems to possess higher stability and protective quality than the film on the NiTi alloy consisting exclusively of titanium.
Acknowledgments
The authors would like to thank Dr. Kunio Takada and Mr. Kanichi Makabe for measurement of ICP, IMR Tohoku University. The present work is supported in part by Grant-in-Aid for Scientific Research (c) (2) No. 13650772 from the Ministry of Education, Culture, Sports, Science and Tech-nology, Japan.
REFERENCES
1) S. Miyazaki and K. Otsuka: ISIJ Int.29(1989) 353–377.
2) K. N. Melton:Engineering Aspects of Shape Memory Alloys, T. W. Duerig, K. N. Melton, D. Stockel and C. M. Wayman (eds), (Butterworth-Heinemann, New York, 1990) pp. 21–35.
3) N. K. Sarkar, W. Redmond, B. Schwaninger and A. J. Goldberg: J. Oral Rehabil.10(1983) 121–128.
4) S. Lu:Engineering Aspects of Shape Memory Alloys, T. W. Duerig, K. N. Melton, D. Stockel and C. M. Wayman (eds), (Butterworth-Heinemann, New York, 1990) pp. 445–451.
5) Y. Oshida, R. Sachdeva, S. Miyazaki and S. Fukuyo: Mater. Sci. Forum 56–58(1990) 705–710.
6) L. S. Castleman and S. M. Motzkin: Biocompatibility of clinical implant materials, D. F. Williams (ed.), in CRC Series in Biocompat-ibility, (CRC Press, Baca Raton, FL, 1981).
459.0 459.1 459.2 459.3 459.4 459.5
Binding Energy,
E
/ eV
Ti-18Nb-4Sn 0.05 mass% HCl, 310K Open to air
Ti4+
Ti 2p3/2
207.5 207.6 207.7 207.8 207.9 208.0
Binding Energy,
E
/ eV
Nb5+
Nb 3d5/2
486.6 486.8 487.0 487.2 487.4
0 100 200 300 400 500 600 700
Binding Energy,
E
/ eV
Immersion Time, t / ks
Sn4+
[image:6.595.57.278.383.747.2]Sn 3d 5/2
Fig. 13 Change in binding energies of Ti4þ2p3
7) International Agency for Research on Cancer, Monogragh on the evaluation of carcinogenic risk of chemicals to humans, (IARC, Lyon, France, 1996).
8) K. Nitta, S. Watanabe, N. Masahashi, H. Hosoda and S. Hanada: Structural Biomaterials for the 21th Century, ed. M. Niinomiet al., (TMS, 2001) pp. 25–34.
9) S. G. Steinemann:Evaluation of Biomaterials, Ed. By G. D. Winter, J. L. Leray, K. de Groot, (John Wiley & Sons Ltd., 1980) 1. 10) Y. Okazaki, S. Asao, S. Rao and T. Tateishi: J. Japan Inst. Metals60
(1996) 902–906.
11) A. Yamamoto, R. Honma, A. Tanaka and M. Sumita: J. Biomed. Mat. Res.47(1999) 396–403.
12) A. Kawashima, S. Watanabe and S. Hanada:Proc. 15th Int. Corrosion Congress, (2002) paper No. 274.
13) K. Asami: J. Electron Specrosc.9(1976) 469–478.
14) K. Asami and K. Hashimoto: Corros. Sci.17(1977) 559–570.
15) K. Asami, K. Hashimoto and S. Shimodaira: Corros. Sci.17(1977) 713–723.
16) K. Asami, S.-C. Chen, H. Habazaki, A. Kawashima and K. Hashimoto: Corros. Sci.31(1990) 727–732.
17) E. Hirota, H. Yoshioka, H. Habazaki, A. Kawashima, K. Asami and K. Hashimoto: Corros. Sci.32(1991) 1213–1226.
18) J. H. Scofield: J. Electron Specrosc.8(1976) 129–137. 19) K. Asami and K. Hashimoto: Corros. Sci.24(1984) 83–97. 20) E. Akiyama, H. Habazaki, A. Kawashima, K. Asami and K.
Hashimoto: Mater. Sci. Eng.A181/182(1994) 1128–1226.
21) K. Asami, S.-C. Chen, H. Habazaki and K. Hashimoto: Corros. Sci.35 (1993) 43–49.
22) S. Tsunekawa, J. Kang, K. Asami, Y. Kawazoe and A. Kasuya: Appl. Surf. Sci.201(2002) 69–74.