Precipitation of an Intermetallic Phase in Mo-alloyed Tungsten Heavy Alloys
Kuan-Hong Lin
1, Chen-Sheng Hsu
2and Shun-Tian Lin
11Department of Mechanical Engineering, National Taiwan University of Science and Technology, 43, Sec. 4, Keelung Road, Taipei 106, Taiwan, R.O.China
2
Department of Materials Science and Engineering, Huwei Institute of Technology, Yulin 632, Taiwan, R.O.China
This study examined the sintering phenomena of two different tungsten heavy alloys, W–8Mo–7Ni–3Fe (mass%) and W–22.4Mo–7.8Ni– 3.4Fe (mass%). Experimental results revealed that extending the isothermal hold caused increase in the concentration of Mo in the liquid phase. A high concentration of Mo in the liquid phase tended to trigger the precipitation of a MoNi-type intermetallic phase at the interface between the W–Mo grains (solid solution of W and Mo) and the matrix phase. The approximate chemical formulation of this intermetallic phase is (W4Mo6)(Ni7Fe3). It was difficult to suppress the precipitation of this intermetallic phase by rapid cooling, because the phase transformation temperature of matrix phase into this intermetallic phase (1628K) is very close to the solidification temperature of the liquid phase (1645 K).
(Received October 7, 2002; Accepted January 6, 2003)
Keywords: tungsten heavy alloys, molybdenum, microstructure, intermetallic phase
1. Introduction
The various superior properties of tungsten heavy alloys
make them widely used in various fields.1–4) In order to
promote densification, tungsten heavy alloys processed via liquid phase sintering require a high solubility of W in the liquid phase. Accordingly, tungsten atoms easily precipitate on the surface of W grains, resulting in not only rapid grain growth, but also grain coalescence. This problem was
encountered in different matrix phases2,5–8) and could be
overcome by several approaches. First, researchers attempted to use post-sintering swaging deformation combined with aging to improve the mechanical properties of tungsten heavy alloys,9)but this method is usually unsatisfactory as products via powder metallurgy route generally are net-shaped components. Subsequently, some researchers focused on the addition of various elements to the W–Ni–Fe heavy alloys,10–12) and thus obtained solid solution strengthening and refined microstructure. So far, the elements alloyed into the W–Ni–Fe heavy alloys were Mo, Ta, Re and Nb. Among them, Nb is effective in strengthening the alloy, but causes difficulties in machining and fabrication.13)The alternative element is Mo due to high strengthening, especially at elevated temperatures. Furthermore, Mo forms an isomor-phous solid solution with W, and has a higher solubility in the Ni–Fe based liquid phase than W.14)
Some researchers have observed several different types of compounds precipitating at the interfaces between the W grains and the matrix phase of furnace-cooled or isothermally
aged W–Ni–Fe alloys.1,15–18)These precipitated phases may
reduce the impact toughness of the alloy and compromise its mechanical properties. It is believed that most of the intermetallic phases in W–Ni–Fe alloys could be eliminated
through following solid-solution and quenching.1,2,17,18)
Recently, it was reported that Mo addition to W–Ni–Fe heavy alloys could modify their mechanical properties.
Bose19) added Mo to W–Ni–Fe heavy alloys and obtained
smaller W grains in the microstructure, and solid solution strengthening in the matrix phase. It is stated that the sum of the solubility by both W and Mo in the matrix phase of W–
Mo–Ni–Fe heavy alloys essentially is constant.2,9,20) Accord-ingly, alloying by Mo reduces the solubility of tungsten in the liquid phase during sintering, which retards the growth of W grains, promotes refinement, and exhibits better mechanical
properties. Kemp2) analyzed the microstructural evolution
and the kinetic process of grain growth of W–Mo–Ni–Fe alloys, and noted that during furnace cooling a new intermetallic phase precipitated in the interfaces between the W–Mo grains and the matrix phase, and modified the mechanical properties. However, its exact composition and structure were not identified. It was also noted that the intermetallic phase could not be eliminated through conven-tional heat treatment.
The above-mentioned reports mentioned some phenomena in the liquid-phase-sintered W–Ni–Fe alloys. However, the detail of microstructural evolution of W–Mo–Ni–Fe heavy alloys during liquid phase sintering remains unclear, and the effect of the Mo addition has not been fully discussed. Furthermore, the precipitation mechanism of the intermetal-lic phase, and the relationship between the intermetalintermetal-lic phase and cooling rate has still not been clear yet. Therefore, this study aims to provide further analysis of the issues mentioned above.
A transmission electron microscopy (TEM) with an attached Energy Dispersive X-ray Spectrometer (EDS) was used to perform more accurate analysis, because the electron beam of TEM was only 10 nm in diameter and the effective excitation volume was approximately 10 5mm3.21)As only
few studies have used TEM with EDS to analyze the microstructures of the matrix phase in the sintered W–Mo– Ni–Fe heavy alloys, TEM with EDS were used as the primary tools to examine the above-mentioned questions.
2. Experimental Procedures
and paraffin wax (1.5 mass%), using 304 stainless steel balls. The powder slurry was then dried at 353 K and the granules were sieved through a screen of 70 mesh. Cylindrical specimens, 15 mm in diameter and 3 mm in height, were die-pressed with a pressure of 110 MPa. The specimens were then sintered in a tube furnace, with a heat treatment scheme for dewaxing, oxide reduction, decarburization, and densifi-cation. The heat treatment profile was heating at 3 K/min to 623 K, holding for 60 minutes, and heating at 3 K/min to 773 K, holding for 60 minutes. This was followed directly by heating at 10 K/min to 1273 K, holding for 60 minutes, and heating at 10 K/min to 1773 K, holding for 5, 120 or 240 minutes. In the heat treatment, an atmosphere of hydrogen was maintained until the last 10 minutes (or 5 minutes for an isothermal holding time of 5 minutes) of the isothermal holding, and after that the atmosphere was changed to argon. All the specimens were furnace-cooled. For comparison, one group of specimens were also heat-treated in the same condition, except that it was held at 1773 K for 240 minutes and quenched in water.
Phase transformation of the sintered alloys was analyzed using a differential thermal analyzer (LABSYS, TG-DTA/ DSC, SETARAM), using a heating rate of 10 K/min to 1773 K. Back-scattered electron images (BEI); secondary electron images (SEI) and corresponding mapping of W, Mo, Ni, Fe of the etched specimens were examined by electron probe microanalysis (EPMA), using a scanning electron microscope (SEM, JEOL, JXA-8900R) operated at an accelerating voltage of 20 kV. The accuracy in this
composi-tion analysis was about1at%, and the effective excitation
volume was approximately 1mm3. Further accurate analyses of smaller domains were carried out using a transmission electron microscope (AEM, JEOL-2010), at an accelerating voltage of 200 kV, and with an Energy Dispersive X-ray Spectrometer (EDS, OXFORD, ISIS-300) attachment. The electron beam size of this EDS analysis was 7 nm and the analyzed area was approximately 50 nm in diameter. Quan-titative composition analysis of the selected area was carried out using the Cliff-Lorimer Ratio of Thin Section, using copper as the calibration standard. The ratio of the intensity of an element to that of the tungsten L line series was used to determine the relative concentrations of the element, which was calculated by the attached software (Oxford Link ISIS). The signal of Cu, which was a contaminant during ion milling, was ignored in the calculation. The specimens were thinned to less than 100 nm, and were believed to be electron-transparent. Accordingly, the absorption correction and
fluorescence correction were neglected21) and only atomic
number correction was carried out using the attached
software. Only the results of the compositional analysis are presented in this paper. The results of the structural analysis are presented in the other paper.22)
3. Results
3.1 W–8Mo–7Ni–3Fe
Figure 1 shows the BEI image of the W–8Mo–7Ni–3Fe
specimen isothermally held at 1773 K for 5 minutes and furnace-cooled. There are three areas with different contrast of BEI pictures, which are assigned to be W-rich phase, Mo-rich phase, and Ni (and Fe)-Mo-rich matrix phase with an increase of darkness, respectively. This figure revealed not only shape irregularities but also the bimodal size distribution of grains. The smaller grains (W 95.8–97.8 at%) were about
1mm in size, which primarily were the consequences of
[image:2.595.48.291.84.173.2]fragmentation of the polycrystalline W particles by the liquid during sintering. Besides, several small W grains tended to sinter around Mo grains in a transient liquid phase sintering, causing the formation of large W–Mo grains with Mo-rich cores.23)Particularly it is noteworthy that some packets of matrix phase visible inside the large grains were observed. To investigate the composition variation, line scanning analysis by EPMA was conducted. Line scanning revealed that the Table 1 Characteristics of the elemental powders used in this study.
W Mo Ni Fe
Vendor Korea Tungsten Climax INCO BASF
Designation KM-8OMP-6 123 OM
Purity, (mass%) 99.95 99.899.897.8 Mean particle size, (mm) 2.5 4 5 4 Tap density, (g/cm3) 2.82.2 4.7 4.3 Major impurities O Si,Fe,Sn C,O,Fe N,C,O
[image:2.595.305.548.378.749.2]large grain contained a Mo-rich core, and at the core the
composition was W–34.0Mo–2.5Ni–1.5Fe (at%). Figure 2
displays the BEI image and the line scanning using EPMA of the W–8Mo–7Ni–3Fe specimen isothermally held at 1773 K for 240 minutes and furnace-cooled. The Mo-rich core could be observed in the W–Mo grains. With an increase of isothermal holding time, the grains became spheroidal and its size distribution became a single modal. Based on the EPMA analysis the composition of the Mo-rich core was W– 35.0Mo–0.3Ni–0.7Fe (at%), which was very close to that of the W–8Mo–7Ni–3Fe alloy that was isothermally held at 1773 K for 5 minutes and furnace-cooled.
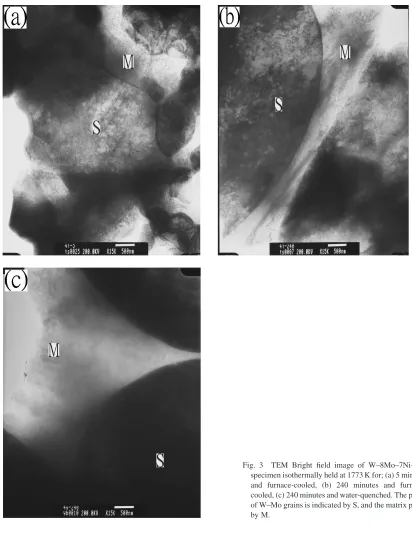
Due to the limit of resolution in EPMA, TEM was used to examine the interface between the W–Mo grains and the matrix phase and EDS was used to measure the composition variation in the matrix phase and interface. Figure3(a) shows the TEM bright field image of the W–8Mo–7Ni–3Fe alloy isothermally held at 1773 K for 5 minutes and furnace-cooled. There was no extra phase observed at the interface between the W–Mo grains and the matrix phase. EDS analysis revealed significantly different results of composi-tion in the matrix phase. Measurements of a total of 9 positions in the matrix phase showed that the average
composition of the matrix phase was: 8:81:1W–
4:31:2Mo–59:71:0Ni–27:20:7Fe (at%). Figure3(b) displays the TEM bright field image of the W–8Mo–7Ni–3Fe
alloy isothermally held at 1773 K for 240 minutes and furnace-cooled. There was no extra phase observed near the interface between the W–Mo grains and the matrix phase
similar to Fig. 3(a), though previous study showed the
segregation of Mo at this interface.2) EDS analysis of 8
different points revealed that the average composition of the matrix phase was: 6:21:0W–5:50:8Mo–62:60:9Ni–
25:70:8Fe (at%). A W–8Mo–7Ni–3Fe specimen was also
sintered isothermally at 1773 K for 240 minutes and quenched in water to elucidate the effect of cooling rate.
Figure 3(c) displays the TEM bright field image of the
quenched specimen, revealing a free of the third phase around the W–Mo grains. EDS analysis of 12 different points revealed that the average composition of the matrix phase was: 8:90:9W–5:80:9Mo–60:41:4Ni–24:91:1Fe (at%).
3.2 W–22.4Mo–7.8Ni–3.4Fe
Figure4presents the BEI image of the W–22.4Mo–7.8Ni–
3.4Fe alloy isothermally held at 1773 K for 5 minutes and furnace-cooled. The large W–Mo grains contained packets of
matrix phase, similar to that shown in Fig.1 for W–8Mo–
7Ni–3Fe. The composition near the center of the Mo-rich core was W–60.0Mo–1.0Ni–1.0Fe (at%) determined by EPMA. No third phase was observed in TEM micrographs
as shown in Fig.5. The average composition of the matrix
phase was: 5:11:5W–8:81:3Mo–60:60:8Ni–25:5
0:9Fe (at%), from TEM-EDS analysis of 9 different points.
Figure6(a) shows the BEI image of the W–22.4Mo–7.8Ni–
3.4Fe alloy isothermally held at 1773 K for 120 minutes and furnace-cooled. It revealed that increasing the isothermal holding time up to 120 minutes promoted grain growth, and precipitation of the third phase surrounding the W–Mo grains. According to EDS analysis of 6 different points, the
average composition of the matrix phase was 3:90:3W–
8:70:9Mo–62:30:7Ni–25:10:5Fe (at%). Figure6(b) presents the BEI image of the W–22.4Mo–7.8Ni–3.4Fe alloy isothermally held at 1773 K for 240 minutes and furnace-cooled. The third phase precipitated more frequently around the W–Mo grains. EPMA analysis revealed that the compo-sition of the core of the Mo-rich area was W–45.0Mo–1.0Ni– 1.0Fe (at%). Compared with the alloy that was isothermally held at 1773 K for 5 minutes, the Mo concentration in the core of the W–Mo grains was reduced by 15 at%, from 60 at% to 45 at%. EDS analysis of 9 different points showed that the average composition of the matrix phase was:4:9 0:4W–8:40:7Mo–62:00:5Ni–24:70:6Fe (at%).
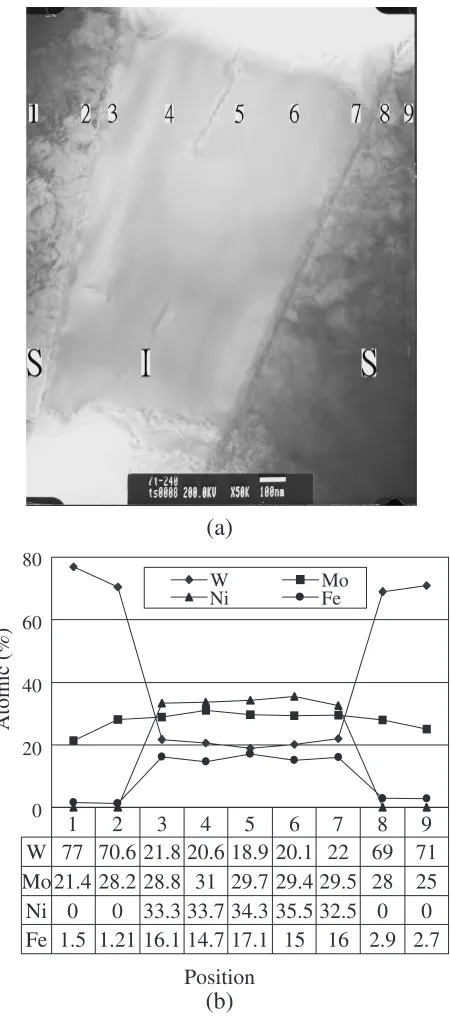
Figure7(a) displays the TEM bright field image of the W– 22.4Mo–7.8Ni–3.4Fe alloy isothermally held at 1773 K for 240 minutes and furnace-cooled. The third phase, whose
thickness was about 1mm, precipitated at the interface
between two W–Mo grains. Figure7(b) shows the result of
EDS analysis. The average composition of the third phase was: 20:71:3W–29:71:3Mo–33:91:4Ni–15:7 1:4Fe (at%), from the average of 16 different points. Based
on the phase diagrams,24–29)the corresponding composition
is not in the range of solid solution, while, it is supposed to be an intermetallic phase of (W4Mo6)(Ni7Fe3), derived from its
composition. The structural analysis of this phase was presented in the other paper.22)
[image:3.595.50.291.74.421.2]Figure 8displays the TEM bright field image of the W– 22.4Mo–7.8Ni–3.4Fe alloy isothermally held at 1773 K for 240 minutes and quenched in water. The third phase can still be observed. EDS analysis revealed that the mean composi-tion of the third phase was: 19:31:5W–31:01:0Mo– 34:51:0Ni–15:20:4Fe (at%), close to that of the furnace-cooled alloy (20:71:3W–29:71:3Mo–33:9 1:4Ni–15:71:4Fe (at%)). As the quenched sample showed a small quantity of the third phase around the W–Mo grains, the cooling rate employed in this study was not enough to suppress the precipitation of this intermetallic phase.
4. Discussion
4.1 Effect of isothermal holding time
Table2 shows the average compositions of the rims of
large W–Mo grains for W–8Mo–7Ni–3Fe and W–22.4Mo– 7.8Ni–3.4Fe. These regions correspond to the newly grew area of W–Mo phase. It could be observed that, with an increase of isothermal holding time, the molar ratio of W to Mo in the rims of W–Mo grains decreased. This implies that the composition of W in the liquid phase decreased, while that of Mo increased with an increase of isothermal holding time, which accordingly resulted in gradual increase in the composition of Mo in the newly grew regions of W–Mo phase. The increase in the composition of Mo in the liquid
[image:4.595.92.504.70.603.2] [image:4.595.93.295.74.576.2]phase with an increase of isothermal holding time is reflected in the results of differential thermal analysis (DTA). Figure9 shows the DTA results of four sintered alloys, tested at a heating rate of 10 K/min. For W–8Mo–7Ni–3Fe, there was only one transformation in this heating cycle, which was the transformation of the solid matrix into a liquid phase. It is estimated that the phase transformation temperatures were 1717 K and 1690 K in the alloy isothermally held at 1773 K for 5 and 240 minutes, respectively. These results were due to the concurrent increase in Mo and decrease in W in the liquid phase with an increase of isothermal holding, because the eutectic temperature of binary W–Ni is above that of Mo–Ni. On the other hand, there are two characteristic peaks for W– 22.4Mo–7.8Ni–3.4Fe, associated with the decomposition of an intermetallic phase and the transformation of the matrix phase into a liquid phase. Different peak heights are observed in the specimens with different isothermal holding times, where the peak height at the higher temperature (1659 K) was larger than that at the lower temperature (1626 K) for an isothermal holding of 5 minutes, and vice versa for an isothermal holding of 240 minutes. Such a variation was due Fig. 4 BEI image and line scanning analysis of W–22.4Mo–7.8Ni–3.4Fe
alloy isothermally held at 1773 K for 5 minutes and furnace-cooled. The packets of matrix phase in the W–Mo grains are indicated by arrows.
Fig. 5 TEM micrograph of the W–22.4Mo–7.8Ni–3.4Fe alloy isothermal-ly held at 1773 K for 5 minutes. The phase of W–Mo grains is indicated by S, and the matrix phase by M.
[image:5.595.327.526.68.477.2] [image:5.595.49.288.69.434.2] [image:5.595.69.267.497.750.2]Fig. 8TEM Bright field image of W–22.4Mo–7.8Ni–3.4Fe alloy isother-mally held at 1773 K for 240 minutes and water-quenched. The phase of W–Mo grains is indicated by S, the intermetallic phase by I, and the matrix phase by M.
Table 2 EPMA composition analysis for the rims of W–Mo grain phase. All the specimens were furnace-cooled.
Alloy Isothermal Rims of grains Atomic ratio hold (min) (at%) (W : Mo)
W–8Mo–7Ni–3Fe 5 W78Mo20Ni0:5Fe1:5 3:90 : 1 W–8Mo–7Ni–3Fe 240 W75Mo23Ni1:0Fe1:0 3:26 : 1 W–22.4Mo–7.8Ni–3.4Fe 5 W71Mo26Ni1:8Fe1:2 2:73 : 1 W–22.4Mo–7.8Ni–3.4Fe 240 W67Mo30Ni1:3Fe1:7 2:23 : 1
Position
77
21.4
0
1.5
W
8060
40
W
Ni MoFe
20
0
Atomic (%)
Mo
Ni
Fe
1
70.6
28.2
0
1.21
2
21.8
28.8
33.3
16.1
3
20.6
31
33.7
14.7
4
18.9
29.7
34.3
17.1
5
20.1
29.4
35.5
15
6
22
29.5
32.5
16
7
69
28
0
2.9
8
71
25
0
2.7
9
(a)
(b)
Fig. 7 W–22.4Mo–7.8Ni–3.4Fe alloy isothermally held at 1773 K for 240 minutes and furnace-cooled, (a) TEM bright field image, the phase of W– Mo grains is indicated by S, and the intermetallic phase by I, (b) EDS composition analysis.
W-8Mo-7Ni-3Fe 5min
W-8Mo-7Ni-3Fe 240min
W-22.4Mo-7.8Ni-3.4Fe 5min
W-22.4Mo-7.8Ni-3.4Fe 240min
1717K
1690K
1626K 1659K
1645K
1628K
1550 1650 1750
1450
Temperature,
T
/K
Endothermic
Heat Flow (Arbitrary Unit)
[image:6.595.319.534.415.746.2] [image:6.595.48.290.699.776.2]to the difference in the relative quantity of the intermetallic phase to the matrix phase in the microstructure. As the ratio of the intermetallic phase to the matrix phase in the alloy isothermally held at 1773 K for 240 minutes was higher than that for 5 minutes, the peak at the lower temperature was associated with the decomposition of the intermetallic phase during heating, while that at the higher temperature was associated with the transformation of matrix phase into liquid phase. Similar to W–8Mo–7Ni–3Fe, the transformation temperature of matrix phase into liquid phase also decreased with an increase of isothermal holding time, because the composition of Mo in the matrix phase increased with increasing isothermal holding time for W–22.4Mo–7.8Ni– 3.4Fe.
Figure10shows the relationship between the thickness of the intermetallic phase and the isothermal holding time at 1773 K. The relative quantity of the intermetallic phase increased with an increase of isothermal holding time, and a similar relationship between holding time and grain growth is
observed.30) As indicated previously, the increase in the
composition of Mo in the liquid phase was related to grain growth, where the Mo/W ratio in the rims of W–Mo grains was lower than that in the liquid phase. Thus, accompanying with grain growth, the increase in the composition of Mo in the liquid phase also promotes the precipitation of inter-metallic phase, whose dependence on holding time is similar to that of grain growth.
4.2 Effect of Mo addition
For W–8Mo–7Ni–3Fe alloy isothermally held at 1773 K for 5 minutes and furnace-cooled, the atomic ratio of W to Mo in the matrix phase was around 2.0 to 1, while that of the original powder was 5.3 to 1. This difference indicates that the apparent activity coefficient of Mo in the matrix phase exceeded that of W by a factor of about 2.6. Such a phenomenon was also observed in W–22.4Mo–7.8Ni–3.4Fe alloy isothermally held at 1773 K for 5 minutes and furnace-cooled. In this alloy, the atomic ratio of W to Mo in the matrix phase was 0.6 to 1, while that of the original powder
was 1.6 to 1. The apparent activity coefficient of Mo in the matrix phase exceeded that of W by a factor of 2.7. Consequently, under the condition of the same alloying composition, Mo more easily dissolves into the matrix phase than W by a factor of about 2.6. On the other hand, the sum of
W and Mo in the matrix phase was almost steady.2,9,20)For
example, the sum of W and Mo in the matrix phase for W– 8Mo–7Ni–3Fe and W–22.4Mo–7.8Ni–3.4Fe were 13.1 at% and 13.9 at%, respectively. Based on these observations, it is clear that, in the composition range investigated, the addition of a small quantity of Mo reduce the W composition in the matrix phase.
With an increase of isothermal holding time, the composi-tion of Mo in the liquid phase increased, while that of W decreased. Eventually, when the composition of Mo in the liquid phase became higher than a critical value for precipitation of an intermetallic phase triggered during
cooling.31)For W–8Mo–7Ni–3Fe alloy isothermally held at
1773 K for 240 minutes, the compositions of W and Mo in the matrix phase of the quenched specimen were higher than those in the furnace-cooled specimen by 2.7 at% and 0.3 at%, respectively. Accordingly, during furnace cooling, there was a much larger quantity of W than Mo precipitating from the liquid phase to the W–Mo phase. Under such a condition, no intermetallic phase was observed around the W–Mo grains. On the other hand, for W–22.4Mo–7.8Ni–3.4Fe alloy isothermally held at 1773 K for 240 minutes, the composi-tions of W and Mo in the matrix phase of the quenched specimen were higher than those in the furnace-cooled specimen by 1.0 at% and 3.1 at%, respectively. Thus, when the precipitation of Mo from the liquid phase during cooling was much larger than W, the intermetallic phase could be formed.
4.3Thermodynamic consideration
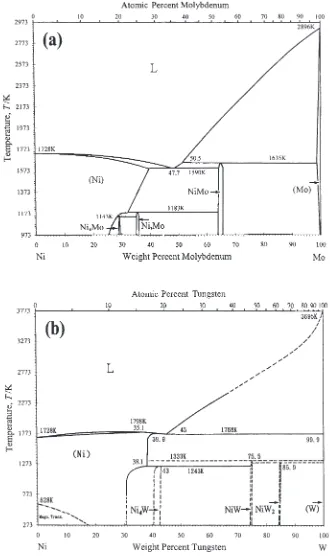
The observation that Mo is prone to trigger the precipita-tion of an intermetallic phase, compared with W, can be judged by the partial phase diagrams of W–Ni and Mo–Ni.
Figure 11 shows the binary phase diagrams of Ni–Mo and
Ni–W.24,25)Table3shows the thermodynamic data of these
two binary systems. For W–Ni, there are large temperature differences between the eutectic temperature (1768K) and the phase transformation temperature of the intermetallic
phases (WNi: 1333 K, W2Ni: 1298K, WNi4: 1243 K).
During cooling, the liquid phase transformed into a matrix phase, which subsequently decomposed into the other matrix phase and intermetallic phases. Accordingly, the precipita-tion of the intermetallic phases from the matrix phase would become sluggish and could be inhibited by rapid cooling,
which was commonly observed.1,2,17,18)On the other hand,
for Mo–Ni, the eutectic temperature (1590 K) is lower than the phase transformation temperature of MoNi intermetallic phase (1635 K). Thus, the rate of forming this intermetallic phase during cooling would be fast, because this MoNi intermetallic phase could precipitate from the liquid phase. Based on the above consideration, a high composition of Mo in the liquid phase is prone to trigger the precipitation of the intermetallic phase during cooling.
In the DTA data for W–22.4Mo–7.8Ni–3.4Fe held at 1773 K for 240 minutes, the phase transformation
tempera-0 200 400 600 800 1000 1200 1400
0 30 60 90 120 150 180 210 240
Time,
t
/min
Thickness,
l
[image:7.595.56.285.70.267.2]/nm
ture of the intermetallic phase (1628K) was slightly lower than the solidification temperature of the liquid phase (1645 K), by only 17 degree. The precipitation of this intermetallic phase would take place in a solid state, but its rate would be fast, because the phase transformation temperature of the intermetallic phase was high and the temperature difference between the solidification tempera-ture of the liquid phase and the phase transformation of the intermetallic phase was very small. Although rapid quench-ing might suppress the precipitation of this intermetallic
phase, it still existed in the water-quenched W–22.4Mo– 7.8Ni–3.4Fe specimen.
[image:8.595.132.462.72.632.2]and 28.4 at%, respectively, whose difference is 6.6 at%. Based on these facts, the degree of over-saturation of Mo in the matrix phase as a result of phase transformation at the eutectic temperature is higher than that of W. Accordingly, the potential for Mo–Ni based intermetallic phase is higher than that for W–Ni one.
5. Conclusion
Addition of Mo to W–Ni–Fe alloys reduced the W composition in the matrix, because Mo is soluble in the matrix compared with W by a factor of about 2.6 for a short isothermal holding at 1773 K. The composition of Mo in the matrix gradually increased, while that of W decreased with an increase of isothermal holding time. The increase in the Mo composition in the matrix with an increase of Mo addition and/or isothermal holding time lowered the solidi-fication temperature of the liquid phase. This is caused by a smaller difference between the solidification temperature of the liquid phase and the phase transformation temperature of an intermetallic phase, (W4Mo6)(Ni7Fe3). Suppression of
intermetallic phase precipitation during cooling was difficult, even when rapid cooling was employed.
Acknowledgments
The authors would like to thank the National Science Council of the Republic of China for financially supporting this research under Contract No. NSC-902216E011050.
REFERENCES
1) D. V. Edmonds and P. N. Jones: Metall. Trans. A10A(1979) 289–295. 2) P. B. Kemp and R. M. German: J. Less-Common Metals175(1991)
353–368.
3) C. L. Briant: Adv. Mater. & Proc.11(1998) 29–32.
4) R. J. Dowding and Martin G. H. Wells:P/M in Aerospace, Defense and Demanding Application-1993, (Edited by F. H. Fores, MPIF, Princeton, NJ, 1993) pp. 25–37.
5) T. K. Kang and D. N. Yoon: Metall. Trans. A9A(1978) 433–438. 6) P. W. Voorhees and M. E. Glicksman: Metall. Trans. A15A(1984)
1081–1088.
7) M. Kumazawa: Mater. Trans., JIM31(1990) 685–688.
8) S. C. Yang, S. S. Mani and R. M. German: Advance in Powder Metallurgy, Vol. 1, ed. by E. R. Andreotti and J. McGeehan, (Metal Powder Industries Federation, Princeton, NJ, 1990) pp. 469–482. 9) A. Bose A and R. M. German:Proceeding of the 1988 International
Powder Metallurgy Conference, ed. by Gummeson PULF and Gustafson DA, (Metal Powder Industries Federation, Princeton, NJ, 1988) pp. 139–153.
10) A. Bose and R. M. German: Metall. Trans. A19A(1988) 3100–3103. 11) G. C. Wu, Q. You and D. Wang: Inter. J. of Ref. Met. & Hard Mater.17
(1999) 299–304.
12) Q. Wang and B. Zhang:Tungsten and Tungsten alloys-1992, ed. by A. Bose and R. J. Dowding, (Metal Powder Industries Federation, Princeton, NJ, 1992) pp. 431–435.
13) S. W. H. Yih:Tungsten: source, metallurgy, properties, and applica-tions, (Plenum Press, New York, 1979) pp. 335–345.
14) H. H. Hausner:Handbook of Powder Metallurgy, 2nd. Ed., (Chemical Publishing Co., Inc., New York, 1982), pp. 358.
15) V. M. Romashov, G. V. Kurganov and E. E. Vlasov: Soviet Pow. Metall. Metal Ceramic21(1979) 952–953.
16) C. Lea, B. C. Muddle and D. V. Edmonds: Metall. Trans. A14A(1983) 667–677.
17) B. C. Muddle and D. V. Edmonds: Acta Metall.33(1985) 2119–2128. 18) J. B. Posthill, M. C. Hogwood and D. V. Edmonds: Pow. Metall.29
(1986) 45–51.
19) A. Bose and R. M. German: Metall. Trans. A21A(1990) 1325–1327. 20) H. D. Park, W. H. Baik, S. J. Kang and D. Y. Yoon: Metall. Mater.
Trans. A27A(1996) 3120–3125.
21) D. B. Williams and C. B. Carter:Transmission Electron Microscopy, (Plenum Press, New York, 1996) pp. 587–632.
22) K. H. Lin, C. S. Hsu and S. T. Lin: Mater. Trans. 2002. (Submitted). 23) C. S. Hsu and S. T. Lin: Scr. Mater.46(2002) 869–873.
24) T. B. Massalski:Binary Alloy Phase Diagrams, 2nd ed. Vol. 3 (ASM International, 1996) pp. 2637.
25) T. B. Massalski:Binary Alloy Phase Diagrams, 2nd ed. Vol. 3 (ASM International, 1996) pp. 2883.
26) P. Villars, A. Prince and H. Okamoto:Handbook of Ternary Alloy Phase Diagrams, Vol. 8(ASM International, 1995) pp. 10466–10468. 27) P. Villars, A. Prince and H. Okamoto:Handbook of Ternary Alloy Phase Diagrams, Vol. 8(ASM International, 1995) pp. 10499–10504. 28) P. Villars, A. Prince and H. Okamoto:Handbook of Ternary Alloy Phase Diagrams, Vol. 8(ASM International, 1995) pp. 10671–10687. 29) P. Villars, A. Prince and H. Okamoto:Handbook of Ternary Alloy Phase Diagrams, Vol. 10 (ASM International, 1995) pp. 12553– 12557.
30) T. Y. Chan and S. T. Lin: Metall. Mater. Trans. A31A(1998) 2885– 2891.
[image:9.595.47.292.85.148.2]31) K. H. Lin, C. S. Hsu and S. T. Lin:Proceeding of the 2002 World Congress on Powder Metallurgy and Particulate Materials, compiled by V. Arnhold, C. L. Chu, W. F. Jandeska, Jr and H. I. Sanderow, (Metal Powder Industries Federation, Princeton, NJ, 2002) part 13–224. Table 3 Thermodynamic data of binary W–Ni and Mo–Ni alloys.24,25)
Alloy Teut(T/K) Tint(T/K) Cl(at%) Cs(at%) Cl–Cs(at%)
W–Ni 17681333 20.7 17.5 3.2
(WNi)
Mo–Ni 1590 1635 35.0 28.4 6.6
(MoNi)
Cl: Eutectic composition of W or Mo.
Cs: Solubility limit of W or Mo in the nickel solid solution at the eutectic temperature.
Teut: Eutectic temperature.