JOURNAL OF FOREST SCIENCE, 62, 2016 (3): 97–106
doi: 10.17221/94/2015-JFS
Relation between selected indicators of forest stand
diversity and quality of timber production in managed
Central European forests
J. Merganič, K. Merganičová, R. Marušák, L. Tipmann, L. Šálek,
L. Dragoun, R. Stolariková
Department of Forest Management, Faculty of Forestry and Wood Sciences, Czech University of Life Sciences Prague, Prague, Czech Republic
ABSTRACT: The present study examines the relationship between the quality of timber production and the species and structural diversity of forest stands. The data used came from a regional forest inventory of the University Forest Enterprise “Kostelec nad Černými lesy”, Czech Republic. The inventory was performed from 2009 to 2011 on 1,188 sam-ple plots that represented 86 strata defined by the combination of three variables: site (5 categories), age (12 categories) and canopy cover (5 categories). On each sample plot, we quantified 171 partial biodiversity indicators that represented species or structural diversity. The quality of timber production was specified by four indicators quantified using local assortment tables. In total, we analysed 58,824 univariate linear regressions describing the relationships between diver-sity indicators and timber quality in individual strata. The results revealed that their relationship changes with stand age. The proportion of the best-quality assortments increases with the increasing species richness in all age categories.
Keywords: assortment; species diversity; structural diversity; timber quality
Recent trends in central European forestry show that the traditional economically oriented forest management is being transformed to multipurpose sustainable forest management (Schmithüsen 2007). This shift results from multiple reasons in-cluding the loss of species diversity (Johann 2004), reduced forest stability (Spiecker 2003), climate change (European Environment Agency 2014), in-creasing occurrence of disturbances (Schelhaas et al. 2003), changes in human perceptions of for-ests (Glück, Weiss 1996; Eland, Wiersum 2001) and in human demands on forests (Schmithüsen 2007), and adverse effects of some plantations on soil properties (Fritz 2006). Such an approach fa-vours mixed structurally more diverse forest stands over homogeneous even-aged plantations.
There is ample evidence about the ecological ad-vantages of diversified forests (Fritz 2006). They are more resistant to biotic and abiotic
disturbanc-es (Knoke et al. 2008), more efficient in using avail-able sources of space, light and nutrients (Rothe, Binkley 2001), they provide diverse habitats for wildlife (Honnay et al. 1998, 1999). They also tend to be more aesthetically pleasing (Guldin 1996; Li-ang et al. 2007), which enhances their recreational values (Lawesson 2004). Hence, such forests pro-vide multiple non-timber benefits that justify their promotion from the ecological point of view.
However, demands for timber and timber prod-ucts are often considered to be in conflict with demands to maintain biodiversity and ecosystem processes (Fox et al. 2006), although some works indicated the contrary. For example, Liang et al. (2007) reported that stands with a higher species and structural diversity also contained a higher percentage of high-quality timber. Nevertheless, economic evaluation of the shift towards ecologi-cally more feasible forests is still rare (Knoke et al.
2008). Forest production research has mostly dealt with the effect of species and structural diversity on productivity (e.g. Pretzsch 2005; Lei et al. 2009; Long, Shaw 2010; Belote et al. 2011; Wang et al. 2011). Although productivity and assortment struc-ture are closely interconnected, higher productivity does not necessarily generate better timber quality. The quantity and quality of wood assortments that can be obtained from a forest depend on the tree habitus and the occurrence of timber faults (Prka 2012). Thus, the assortments produced from the trees of the same dimensions may differ in their quality (Prka 2012) due to stand characteristics such as density (Liang et al. 2007), and species or structural diversity.
Therefore, the goal of this study was to analyse the relationships between the indicators of tree species and structural diversity and the quality of timber production in Central European forest stands. We searched for the answers to the following ques-tions: (1) how is the quality of timber production
influenced by stand diversity?; (2) is the effect of diversity on the quality of timber production con-stant over time and stand development or does it change with stand age and stand structure?
MATERIAL AND METHODS
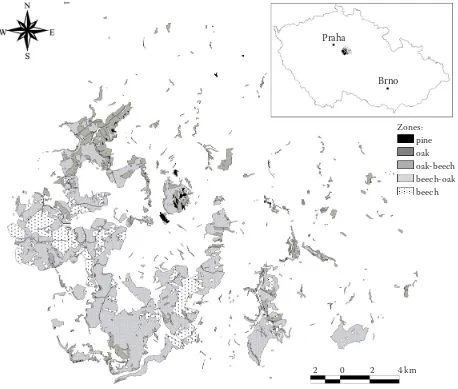
[image:2.595.72.530.337.726.2]The data used in this study were collected dur-ing a regional forest inventory of the University Forest Enterprise “Kostelec nad Černými lesy” of the Czech University of Life Sciences (Fig. 1). The total area of the enterprise is 6,581 ha, 95.4% of which is covered with forests. The elevation ranges from 220 to 560 m a.s.l. The average length of the growing season is 153 days. Mean annual temperature varies from 7 to 7.5°C, mean tem-perature in the growing season ranges between 13 and 13.8°C. Mean annual precipitation fluctuates from 600 to 650 mm. Five forest altitudinal zones as defined by Zlatník (1976) occur within the
Fig. 1. The area of the University Forest Enterprise “Kostelec nad Černými lesy”. Forest altitudinal zones as defined by Zlatník (1976)
Zones: pine oak oak-beech beech-oak beech
2 0 2 4 km Praha
enterprise: pine zone (0.8%), oak zone (0.5%), oak-beech zone (18.6%), oak-beech-oak zone (61.5%) and beech zone (18.5%).
Forest inventory was performed from 2009 to 2011 using a stratification sampling design. The area of the enterprise was stratified on the basis of three vari-ables: site (5 categories), stand age (12 categories) and canopy cover (5 categories) in order to ensure that the whole gradient of ecological conditions and stand development would be covered in the data. The suitability of the applied stratification design for these purposes was confirmed by the validation analysis of the inventory data (Merganič et al. 2012).
In total, 1,188 inventory sample plots were estab-lished in 86 strata. The sample plots were of circular shape with an area of 500 m2. On each plot approxi-mately 100 variables describing site conditions (e.g. slope, aspect, soil moisture), stand development (e.g. canopy cover, level of tree aggregation and mixture) and tree status (e.g. tree species, tree diameter at breast height, tree height, stem quality, health condi-tion) were assessed. For further analyses, trees were divided into three groups: (1) young trees with diam-eter at breast height below 7 cm (hereinafter as ML); (2) old trees with diameter at breast height above 7 cm (hereinafter as ST); (3) all trees, i.e. young and old trees together (hereinafter as SP). Overall, 29 tree species were identified within the inventory. Norway spruce (Picea abies L. Karst.) was the most common tree species in both young and old stands (26% and 53% calculated from the number of young trees and stand volume of old trees, respectively).
Biodiversity was quantified by the following basic indicators that describe species and structural diver-sity: (i) indices of species richness: N0 (Hill 1973), R1 (Margalef 1958), R2 (Menhinick 1964); (ii) indices of species evenness: BP (Berger, Parker 1970), E1 (Pielou 1975, 1977), E3 (Heip 1974), E5 (Hill 1973), D (McIntosh 1967); (iii) indices of spe-cies heterogeneity: Si (Simpson 1949), H (Shannon, Weaver 1949), HB (Brillouin 1956); (iv) indices of similarity: QS (Sørensen 1948), BC (Bray, Curtis 1957), ED – Euclidian distance, BUB (Baroni-Ur-bani, Buser 1976), Y (Boyce 2003), DF – Canberra distance (Lance, Williams 1966), PS – proportional similarity (Czekanowski 1909); (v) other indicators: absolute and relative range of tree heights, species ag-gregation and mixture assessed in the field, volume of fine and coarse woody debris on a plot, number of vertical layers according to Zlatník (1976), number of shrub species, number of moss and lichen species.
Indicators of species diversity were calculated for the above-mentioned three groups of trees. Structural diversity indicators were quantified for
the group of all trees only. If possible, the indica-tors were calculated using one of the four stand parameters: total number of trees, sum of tree heights, average tree height and total growth area. Partial biodiversity indicators were defined by combining basic indicators with groups of trees, and stand parameters. For example, from the ba-sic indicator H, which is an index of species het-erogeneity (Shannon, Weaver 1949), 12 different partial indicators were derived, because this index could be calculated for each of the three groups of trees and four stand parameters (3 × 4 = 12). The abbreviation of each partial indicator is com-posed of three parts, where the first part represents the basic diversity indicator, the second part indi-cates the group of trees, and the third part repre-sents the stand parameter from which the indicator was calculated. An example of a partial indicator is H_ML_Nr, i.e. it is H index of species heterogene-ity (Shannon, Weaver 1949) that was calculated for young trees with diameter below 7 cm (ML), while tree species composition was derived from tree number (Nr). In total, 171 partial biodiversity indicators were quantified on every plot.
Tree volume was calculated according to Petráš and Pajtík (1991). Wood assortment was per-formed using assortment tables of Petráš and Nociar (1990, 1991) that quantify the proportion of six different quality assortment classes from high quality assortments to fuel wood. For the purposes of this study, six quality assortment classes defined in tables were aggregated to four assortment class-es as follows: (1) timber of the highclass-est quality used for veneer, musical instruments, sport equipment, and barrels; (2) timber of high quality used for con-struction purposes (sawn timber); (3) concon-struction sawn timber of lower quality; (4) pulp wood and fuel wood. Four indicators of the quality of timber production (QTP) were quantified for each sample plot as volumetric proportions of each of the four timber quality classes, i.e. as the ratio between the volume of wood in a particular timber quality class and the total volume of wood on a sample plot.
The relationship between QTP and diversity in-dicators (DI) in each stratum was examined using a univariate linear regression, below as Eq. (1):
QTP = a + b × DI (1)
where:
a, b – regression coefficients of the linear regression.
combi-nation of stratum, diversity and quality indicators. This was performed in order to test the hypothesis if the trend and the strength of the relationship change in individual strata due to different ecologi-cal conditions and stand development.
Correlations coefficients of the derived linear regressions were statistically tested by Student’s t-test to identify their significance at 95% signifi-cance level. The null hypothesis was that the corre-lation coefficient of the regression is equal to zero. The frequency of significant relationships (P ≤ 0.05) from all analysed relationships was calculated and the average correlation coefficient of significant relationships was determined for each diversity indicator. In order to analyse the overall influence of the diversity indicator on the quality of timber production, the absolute values of correlation coef-ficients of each diversity indicator in all strata were summed up. The diversity indicators were ranked with regard to the calculated sum in descending order to identify the indicators with the highest correlations to the quality of timber production. A similar approach was applied by Holubec and Halounová (2015).
The selected diversity indicators were analysed on the basis of the calculated averages and sums of cor-relation coefficients, the frequency and the trend of significant relationships. This was performed first for the whole data set, and then for the four catego-ries of QTP as defined above, and four age classes (young, middle-aged, old, and uneven-aged stands). Young stands were all stands with the mean age be-low 40 years, middle-aged stands were aged between 40 and 100 years, and the stands older than 100 years were considered old stands. Stands were classified as uneven-aged stands if the crown cover of young trees with diameter below 7 cm exceeded 30%. From 86 strata, young, middle-aged, old, and uneven-aged stands were in 24, 30, 21 and 11 strata, respectively.
RESULTS
The analysis of the relationship between diversity indicators and quality of timber production revealed that the average values of correlation coefficient did not exceed 0.4. Out of the total of 58,824 analysed regressions, 7,413 (12.6%) relationships were signifi-cant. The occurrence of species and structural diver-sity indicators in significant correlations with QTP was balanced with only a slight prevalence of species diversity indicators (53%). The mean correlation coef-ficient of significant relationships of the first ten diver-sity indicators with the highest correlation with
tim-ber quality fluctuated around 0.6 (0.58–0.65, Fig. 2). The highest average correlation coefficient and the highest frequency (27.3%) of significant relationships were found for R2 Menhinick species richness index that integrates the effect of stand density and number of species. Among the first ten diversity indicators, only one indicator was structural (Euclidean distance ED1, Fig. 2). Three species diversity indicators repre-sented species richness (R2, R1, N0), while evenness and heterogeneity were represented by 2 (BP, D) and 4 (2× Si, H, HB) indicators, respectively. All nine spe-cies diversity indicators were calculated for a group of old trees with diameter at breast height above 7 cm.
Next, we analysed the correlations inside the groups of individual indicators of the quality of timber pro-duction. We found that R2 Menhinick species rich-ness index was a diversity indicator with the highest correlation with each indicator of the quality of tim-ber production (Fig. 3a). The highest quality of timtim-ber production (QTP1) was predominantly correlated with species diversity indicators, as all first five indi-cators represented species diversity. In lower qualities of timber production, structural diversity indicators also occurred among the first five ones (Fig. 3a). The second and third indicators of the quality of timber production (QTP2 and QTP3) were significantly cor-related with Euclidean distance ED1, the structural index quantifying similarity between old and young trees, here in the sums of tree heights. In the case of the lowest quality of timber production (QTP4), the range of tree heights of all trees calculated as a dif-ference between maximum and minimum tree height (Var_SP_Ha) was the structural index ranked among the first five diversity indicators with the highest cor-relation with QTP (Fig. 3a).
The analysis of the correlations within the indi-vidual age categories revealed that the set of the first five diversity indicators with the highest correlations with indicators of the quality of timber production comprised both species and structural indicators, although the actual indicators differed between the categories (Fig. 3b). The greatest similarities were revealed between the groups of middle-aged and old stands, for which the same three basic indicators were ranked among the top five indicators: ED1 Euclide-an distEuclide-ance (rEuclide-anked first in both age categories), E1 Pielou index of species evenness, and E3 Heip index of species evenness (Fig. 3b).
trees only using the species composition derived from relative growth area (Fig. 3b). In middle-aged stands, four species indicators and one structural indica-tor were ranked among the first five indicaindica-tors with the highest correlation with QTP. In old stands, two structural indicators were among the first five indica-tors. In young and uneven-aged stands, one species diversity indicator and four structural diversity indi-cators were ranked first, while their types and their order differed between the age categories (Fig. 3b). R2 Menhinick species richness index was ranked among the five species diversity indicators with the highest correlation with the quality of timber production in young and middle-aged stands (Fig. 3b). In the cat-egory of uneven-aged stands, the structural indica-tors were Bray-Curtis index of similarity (BC2) and Canberra index of similarity (DF1) between young and old trees (i.e. trees with diameter below 7 cm and above 7 cm, respectively) calculated from the average tree heights of species, and the ratios of the number
of trees with diameter below 7 cm to the number of trees above 7 cm or vice versa (PmM and PmS, re-spectively). In the category of uneven-aged stands, the only species diversity indicator ranked among the first five indicators was Simpson index of species het-erogeneity (Si). This index was among the five most closely correlated with QTP also in the category of old stands (Fig. 3b).
[image:5.595.185.408.51.219.2]In the next step we analysed the trend of the rela-tionship between particular species or structural di-versity indicators to the quality of timber production. Fig. 4 shows the trend for one species and one struc-tural indicator and the best quality of timber produc-tion (QTP1) in individual age categories. From the graphs we can see that both species and structural diversity have a positive impact on the proportion of high-quality assortments. Only in the case of young stands, the proportion of best-quality assortments was slightly decreasing with the increasing number of tree layers in stands (Fig. 4b).
Fig. 2. Top ten diversity indicators with the highest correlation with the quality of timber production in the study area black circle – percentage of significant correlations of the diversity indicator with the quality of timber produc-tion, grey bar – average value of correlation coefficient Rxy calculated from significant correlations of a particu-lar diversity indicator, white rectangle – 95% confidence interval of the average value of correlation coefficient
Rxy calculated from all correlations derived for a particular diversity indicator, black dagger – average value of correlation coefficient Rxy calculated from all correlations derived for a particular diversity indicator, black diamond – structural indicator of diversity, BP_ST_Ha – BP index of species evenness (Berger, Parker 1970) calculated from the sum of tree heights of trees with diameter above 7 cm, D_ST_Na – D index of species even-ness (McIntosh 1967) of trees with diameter above 7 cm calculated from the number of trees, ED1_SP_Ha – ED1 index of similarity (absolute Euclidean distance) between the trees with diameter below 7 cm and the trees with diameter above 7 cm calculated from the sum of tree heights per species, H_ST_Hr – H index of species heterogeneity (Shannon, Weaver 1949) of trees with diameter above 7 cm, while the species compo-sition was derived from the sum of tree heights, HB_ST_Na – HB index of species heterogeneity (Brillouin 1956) of trees with diameter above 7 cm, N0_ST_Na – N0 index of species richness (Hill 1973) of trees with diameter above 7 cm, R1_ST_Na – R1 index of species richness (Margalef 1958) of trees with diameter above 7 cm, R2_ST_Na – R2 index of species richness (Menhinick 1964) of trees with diameter above 7 cm, Si_ST_Hr – Si index of species heterogeneity (Simpson 1949) of trees with diameter above 7 cm, while the species composition was derived from the sum of tree heights, Si_ST_Nr – Si index of species heterogeneity (Simpson 1949) of trees with diameter above 7 cm, while the species composition was derived from the number of trees
Me
an
Fig. 3. Top five diversity indicators with the highest correlation: with individual qualities of timber production (a), with individual age categories (b) with the study area
QTP – indicator of the quality of timber production, QTP1 – best-quality timber, QTP2, QTP3 – sawn timber of higher and lower quality, QTP4 – pulp and fuel wood, black circle – percentage of significant correlations of the diversity indicator with the quality of timber production, grey bar – average value of correlation coefficient Rxy calculated from significant correlations of a particular diversity indicator, white rectangle – 95% confidence interval of the average value of correlation coefficient Rxy
calculated from all correlations derived for a particular diversity indicator, black dagger – average value of correlation coef-ficient Rxy calculated from all correlations derived for a particular diversity indicator, black diamond – structural indicator of diversity, BC1_SP_Rr – BC1 index of similarity (Bray, Curtis 1957) between the trees with diameter below 7 cm and the trees with diameter above 7 cm, while the species composition was derived from the growth area, BC2_SP_Hpa – BC2 index of similarity (Bray, Curtis 1957) between the trees with diameter below 7 cm and the trees with diameter above 7 cm calculated from the average tree heights of species, BP_ST_Ha – BP index of species evenness (Berger, Parker 1970) calculated from the sum of tree heights of trees with diameter above 7 cm, BUB_SP_Rr – BUB index of similarity (Baroni-Urbani, Buser 1976) between the trees with diameter below 7 cm and the trees with diameter above 7 cm, while the species composition was derived from the growth area, D_ST_Na – D index of species evenness (McIntosh 1967) of trees with diameter above 7 cm, DF1_SP_Hpa – DF1 index of similarity (Canberra distance) (Lance, Williams 1966) be-tween the trees with diameter below 7 cm and the trees with diameter above 7 cm calculated from the average tree heights of species, E1_SP_Hr – E1 index of species evenness (Pielou 1975, 1977) of all trees, while the species composition was derived from the sum of tree heights, E1_ST_Rr – E1 index of species evenness (Pielou 1975, 1977) of trees with diameter above 7 cm, while the species composition was derived from the growth area, E3_SP_Hr – E3 index of species evenness (Heip 1974) of all trees, while the species composition was derived from the sum of tree heights, E3_ST_Hr – E3 index of species evenness (Heip 1974) of trees with diameter above 7 cm, while the species composition was derived from the sum of tree heights, E3_ST_Rr – E3 index of species evenness (Heip 1974) of trees with diameter above 7 cm, while the species composition was derived from the growth area, E5_SP_Hr – E5 index of species evenness (Hill 1973) of all trees, while the species composition was derived from the sum of tree heights, E5_ST_Hr – E5 index of species evenness (Hill 1973) of trees with diameter above 7 cm, while the species composition was derived from the sum of tree heights, ED1_SP_Ha
(a)
(b)
Me
an
Rxy
Me
an
DISCUSSION
Stand assortment structure is influenced by a combination of several factors including site con-ditions (Danilović 2006), silvicultural measures (Danilović 2008; Prka, Krpan 2010), stand density, spatial distribution of trees, species com-position (Liang et al. 2007), and diversity of tree habitus (Prka 2012). The results of our analysis confirmed that the quality of timber production is a result of multiple relations because the explana-tory power of the univariate linear regressions was low (the average significant correlation coefficients did not exceed 0.7, Fig. 2). Moreover, the analysis also revealed that there was no supreme diversity indicator that could be preferred over others, as the number of different species and structural diversity indicators were significantly correlated with quality indicators (Figs 2 and 3). The R2 Menhinick species richness index that integrates the effect of stand
density and species richness occurred seven times among the best indicators, while six times it was ranked first. From structural indicators, Euclidean distance ED1, i.e. a structural index of similarity, was most frequent among the best diversity indica-tors: it occurred five times (Figs 2 and 3). Similarly, Simpson index of species heterogeneity (Si), which is frequently applied in forestry studies (Pretzsch 1996; Lexerod, Eid 2006; Pretzsch 2009; Zhou et al. 2009; Duduman 2011), also occurred five times among the best diversity indicators. On the contrary, the number of species – N0 index as the most commonly used diversity measure, occurred only twice among the indicators with the highest correlation with quality indicators (Figs 2 and 3). Three other species diversity indicators, i.e. Pielou and Heip indices of evenness (E1 and E3), and Margalef index of species richness (R1) were also more frequent species diversity indicators than the number of species. These results indicate that the
[image:7.595.69.527.536.709.2](a) (b)
Fig. 4. Correlation of the best-quality timber proportion (QTP1) with R2 Menhinick index of species richness of trees with diameter above 7 cm (a), number of vertical tree layers (b) according to Zlatník (1976) in individual age categories of stands
Fig. 3. to be continued
number of species itself is not a satisfactory indi-cator, because it does not account for other diver-sity elements, e.g. species evenness, heterogeneity, and structural diversity. Thus, in order to obtain complex information about ecosystem properties, other metrics of biodiversity than species richness should also be included (Hooper 2014). From the mathematical point of view, the effect of the num-ber of species is included in the above-mentioned species diversity indicators together with other di-versity elements.
As seen in Figs 2 and 3a, all species diversity in-dicators ranked among the first inin-dicators were calculated for a group of old trees, i.e. trees with diameter at breast height above 7 cm. This group of trees is principal for timber production at the actu-al time. Young trees with diameter at breast height below 7 cm represent the prospective state of for-est ecosystems. Their impact on timber quality was found only in the case of middle-aged stands, for which three out of four species diversity indicators ranked among the top five indicators were calcu-lated from the group of all trees (Fig. 3b).
The results of individual age categories indi-cate that the impact of diversity on timber quality changes with stand age. In young stands (younger than 40 years), structural diversity influences the quality of timber production more, while in mid-dle-aged and old stands the species diversity has a more profound effect on the quality of timber pro-duction. In uneven-aged stands, structural diver-sity seems to be more important for timber quality production than species diversity (Fig. 3b).
The analysis of the trend in the relationship be-tween diversity and the quality of timber produc-tion revealed a positive effect of species diversity on the proportion of high quality assortments (QTP1) in all examined age categories (Fig. 4a). This is in accordance with Liang et al. (2007), who found that the proportion of peeler logs was positively correlated with species diversity. This finding can help to promote mixed forest stands in spite of the fact that the yield of mixtures may not always reach the yields of pure stands (Knoke et al. 2008). Ac-cording to Pretzsch (2012), species composition is the driving parameter that affects the productiv-ity of mixed stands.
The impact of structural diversity seems to be more complex, because in some cases structural indicators showed a positive relationship to high-quality timber assortments, while in other cases the trend was negative (Fig. 4b). After a more detailed analysis of the applied structural indicators we con-cluded that the selected indices of similarity, e.g.
Euclidean distance, do not describe the forest struc-ture to its full extent, but rather quantify differences between the two stand parts, in our case young and old trees. Due to this, we analysed the trend be-tween the quality of timber production and struc-tural diversity using a simple indicator represented by the number of tree layers (Fig. 4b), although this indicator was not ranked among those with the highest correlation with the quality of timber pro-duction. We found that in uneven-aged stands and even-aged stands older than 40 years, the propor-tion of high-quality assortments is greater than in the stands with the greater number of tree layers (Fig. 4b). However, in stands younger than 40 years, the relationship was negative (Fig. 4b). This can be influenced by the fact that the proportion of high-quality assortments is lower in young stands due to their small dimensions. Moreover, the results may also be influenced by a greater error of timber qual-ity estimates in young stands. Since the structure of a forest is the result of natural processes and hu-man disturbances that include forest hu-management practices, such as thinnings, fellings, and plantings (Gadow et al. 2012), the negative trend of the per-centage of high-quality assortment with increasing structural diversity may also be caused by the ap-plied silvicultural treatments.
To conclude we can say that the results of the pres-ent study indicate that stand diversity and quality of timber production are not in conflict with each other. Hence, promoting diversified stands both from spe-cies and structural points of view may enhance the economic value of the final timber products at the same time. According to our knowledge, there is a lack of similar studies dealing with the relationship between the quality of timber production and diver-sity. However, considering modern forestry concepts aimed at sustainable development and utilisation of forest resources, such studies are highly valuable as they can provide us with objective information that can modify or support the applied forest management.
References
Baroni-Urbani C., Buser M.W. (1976): Similarity of binary data. Systematic Zoology, 25: 251–259.
Belote R.T., Prisley S., Jones R.H., Fitzpatrick M., de Beurs K. (2011): Forest productivity and tree diversity relationships depend on ecological context within mid-Atlantic and Ap-palachian forests (USA). Forest Ecology and Management, 261: 1315–1324.
Boyce R. (2003): Choosing the best similarity index when performing fuzzy set ordination on abundance data. Avail-able at http://www.nku.edu/~boycer/ESA03b.pdf (accessed Oct 16, 2015).
Bray J.R., Curtis J.T. (1957): An ordination of upland forest communities of southern Wisconsin. Ecological Mono-graphs, 27: 325–349.
Brillouin L. (1956): Science and Information Theory. New York, Academic Press: 347.
Czekanowski J. (1909): Zur differential Diagnose der Ne-andertalgruppe. Korrespondenz-Blatt der Deutschen Gesellschaft für Anthropologie, 40: 44–47.
Danilović M. (2006): Effect of quality factors especially of sweep of poplar trees on assortment structure. Glasnik Šumarskog Fakulteta, 94: 135–150.
Danilović M. (2008): Assessment of the effect of quality fac-tors on the assortment structure in poplar plantations. Bulletin of the Faculty of Forestry, 97: 127–146.
Duduman G. (2011): A forest management planning tool to cre-ate highly diverse uneven-aged stands. Forestry, 84: 301–314. Eland B.H.M., Wiersum K.F. (2001): Forestry and rural develop-ment in Europe: An exploration of social-political discourse. Forest Policy and Economics, 3: 5–16.
European Environment Agency (2014): Climate change. Avail-able at http://www.eea.europa.eu/themes/climate/intro (ac-cessed Oct 16, 2015).
Fox T.R., Haas C.A., Smith D.W., Loftis D.L., Zedaker S.M., Jones R.H., Hammett A.L. (2006): Alternative silvicultural practices in appalachian forest ecosystems: Implications for species diversity, ecosystem resilience, and commercial timber production. In: Buckley D.S., Clatterbuck W.K. (eds): Proceed-ings of 15th Central Hardwood Forest Conference, University of Tennessee, Knoxville, Feb 27–Mars 1, 2006: 276–280. Fritz P. (2006): Ökologischer Waldumbau in Deutschland –
Fragen, Antworten, Perspektiven. München, Oekom: 360. Gadow K., Zhang C.Y., Wehenkel C., Pommerening A., Rivas
J.C., Korol M., Myklush S., Hui G.Y., Kiviste A., Zhao X.H. (2012): Forest structure and diversity. In: Pukkala T., Gadow K. (eds): Continuous Cover Forestry: Managing Forest Eco-systems 23. 2nd Ed. Dordrecht, Springer Science + Business Media B.V.: 29–84.
Gluck P., Weiss G. (eds) (1996): Forestry in the context of rural development: Future research needs. In: EFI Proceeding No. 15, Vienna, April 15–17, 1996: 173.
Guldin J.M. (1996): The role of uneven-aged silviculture in the context of ecosystem management. Western Journal of Ap-plied Forestry, 11: 4–12.
Heip C. (1974): A new index measuring evenness. Journal of the Marine Biological Association, 54: 555–557.
Hill M.O. (1973): Diversity and evenness: A unifying notation and its consequences. Ecology, 54: 427–432.
Holubec V., Halounová L. (2015): Impact of particular indica-tors of urban development of cities in the Czech Republic on average road traffic intensity. In: Ivan I., Benenson I., Jiang B.,
Horák J., Haworth J., Inspektor T. (eds): Geoinformatics for Intelligent Transportation. Lecture Notes in Geoinformatics and Cartography. Cham, Springer International Publishing Switzerland: 77–92.
Honnay O., Degroote B., Hermy M. (1998): Ancient-forest plant species in western Belgium: A species list and pos-sible ecological mechanisms. Belgian Journal of Botany, 130: 139–154.
Honnay O., Hermy M., Coppin P. (1999): Impact of habitat quality on forest plant species colonization. Forest Ecology and Management, 115: 157–170.
Hooper D. (2014): On beyond S: Why other metrics of biodi-versity can tell more about ecosystem services than species richness. The International Forestry Review, 16: 13. Johann E. (2004): Landscape Changes in the History of the
Austrian Alpine Regions: Ecological Development and the Perception of Human Responsibility. In: Honnay O., Ver-heyen K., Bossuyt B., Hermy M. (eds): Forest Biodiversity: Lessons from History for Conservation. Trowbridge, IUFRO, CABI Publishing: 27–40.
Knoke T., Ammer C., Stimm B., Mosandl R. (2008): Admixing broadleaved to coniferous tree species: A review on yield, ecological stability and economics. European Journal of Forest Research, 127: 89–101.
Lance G.N., Williams W.T. (1966): Computer programs for hierarchical polythetic classification (“similarity analysis”). Computer Journal, 9: 60–64.
Lawesson J.E. (2004): Ancient forests in Denmark and the importance of Tilia. In: Honnay O., Verheyen K., Bossuyt B., Hermy M. (eds): Forest Biodiversity: Lessons from History for Conservation. Trowbridge, IUFRO, CABI Publishing: 97–115.
Lei X., Wang W., Peng C. (2009): Relationships between stand growth and structural diversity in spruce-dominated forests in New Brunswick, Canada. Canadian Journal of Forest Research, 39: 1835–1847.
Lexerod N.L., Eid T. (2006): An evaluation of different di-ameter diversity indices based on criteria related to forest management planning. Forest Ecology and Management, 222: 17–28.
Liang J., Buongiorno J., Monserud R.A. (2007): Optimizing wood quality and stand diversity in uneven-aged forest management. In: Dykstra D.P., Monserud R.A. (eds): Forest Growth and Timber Quality: Crown Models and Simulation Methods for Sustainable Forest Management. Proceedings of an International Conference, Portland, Aug 7–10, 2007: 169–176.
Long J.N., Shaw J.D. (2010): The influence of compositional and structural diversity on forest productivity. Forestry, 83: 121–128.
Margalef R. (1958): Information theory in ecology. General Systematics, 3: 36–71.
Menhinick C.F. (1964): A comparison of some species – indi-viduals diversity indices applied to samples of field insects. Ecology, 45: 859–861.
Merganič J., Marušák R., Merganičová K., Tipmann L., Stolari-ková R., Audolenská V. (2012): Sampling design for integrated noncash and economic valuation of biodiversity – case study. Scientia Agriculturae Bohemica, 43: 145–152.
Petráš R., Nociar V. (1990): Nové sortimentačné tabuľky hlavných listnatých drevín. Lesnícky časopis – Forestry Journal, 36: 535–552.
Petráš R., Nociar V. (1991): Nové sortimentačné tabuľky hlavných ihličnatých drevín. Lesnícky časopis – Forestry Journal, 37: 377–392.
Petráš R., Pajtík J. (1991): Sústava česko-slovenských ob-jemových tabuliek drevín. Lesnícky časopis – Forestry Journal, 37: 49–56.
Pielou E.C. (1975): Ecological Diversity. New York, Wiley: 165.
Pielou E.C. (1977): Mathematical Ecology. New York, Wiley: 385.
Pretzsch H. (1996): Strukturvielfalt als Ergebnis Waldbau-lichen Handels. Allgemeine Forst- und Jagdzeitung, 167: 213–221.
Pretzsch H. (2005): Diversity and productivity in forests: Evidence from long-term experimental plots. In: Scherer-Lorenzen M., Körner C., Schulze E.D. (eds): Forest Diver-sity and Function: Temperate and Boreal Systems. Berlin Heidelberg, Springer-Verlag: 41–64.
Pretzsch H. (2009): Forest Dynamics, Growth and Yield. Berlin Heidelberg, Springer-Verlag: 664.
Pretzsch H. (2012): Räumliche und zeitliche Variation von Mischungseffekten in Abhängigkeit von Umweltbedin-gungen. In: Nagel J. (ed.): Tagungsband der Jahrestagung 2012 der Sektion Ertragskunde des Deutschen Verbandes Forstlicher Forschungsanstalten, Ottenstein, May 21–23, 2012: 44–55.
Prka M. (2012): Impact of sustainable management of natural even-aged beech stands on assortment structure of beech in Croatia. In: Oteng-Amoako A.A.(ed.): New Advances
and Contributions to Forestry Research. Rijeka, InTech: 171–196.
Prka M., Krpan A.P.B. (2010): Impact of tending measures on assortment structure of fellings in central Croatian beech stands. Acta Silvatica et Lignaria Hungarica, 6: 171–182. Rothe A., Binkley D. (2001): Nutritional interactions in mixed
species forests: a synthesis. Canadian Journal of Forest Research, 31: 1855–1870.
Schelhaas M.J., Nabuurs G., Schuck A. (2003): Natural disturbances in the European forests in the 19th and 20th centuries. Global Change Biology, 9: 1620–1633.
Schmithüsen F. (2007): Multifunctional forestry practices as a land use strategy to meet increasing private and public demands in modern societies. Journal of Forest Science, 53: 290–298.
Shannon C., Weaver W. (1949): The Mathematical Theory of Communication. Urbana, University of Illinois Press: 117. Simpson E.H. (1949): Measurement of diversity. Nature,
163: 688.
Sørensen T. (1948): A Method of Establishing Groups of Equal Amplitude in Plant Sociology Based on Similarity of Species and its Application to Analyses of the Vegeta-tion on Danish Commons. Copenhagen, Munksgaard: 34. Spiecker H. (2003): Silvicultural management in maintaining
biodiversity and resistance of forests in Europe – temperate zone. Journal of Environmental Management, 67: 55–65. Wang W., Lei X., Ma Z., Kneeshaw D.D., Peng C. (2011):
Positive relationship between aboveground carbon stocks and structural diversity in spruce-dominated forest stands in New Brunswick, Canada. Forest Science, 57: 506–515. Zhou P., Luukkanen O., Tokola T., Hares M. (2009): Com-parison of forest stand characteristics and species diversity indices under different human impacts along an altitudinal gradient. Fennia, 187: 17–30.
Zlatník A. (1976): Lesnická fytocenologie. Praha, SZN: 495.
Received for publication October 16, 2015 Accepted after corrections January 20, 2016
Corresponding author: